Note
Go to the end to download the full example code or to run this example in your browser via Binder
Using GeoVista#
This is provided by @bjlittle in this discussion and modified by @tkoyama010 .
You may think that PyVista is a little too abstract for what you want to do. Therefore, we will introduce GeoVista, which was developed as a gateway to cartographic capability.
GeoVista is a very good external example of using PyVista in a more concrete use case.
import subprocess
import sys

if "google.colab" in sys.modules:
    subprocess.run("pip install geovista", shell=True, check=True)
else:
    import geovista.theme

import geovista as gv
import pyvista as pv
Note
Motivation of GeoVista
The goal of GeoVista is simple; to complement PyVista with a convenient cartographic capability.
In this regard, from a design perspective we aim to keep GeoVista as pure to PyVista as possible i.e., minimise specialisation as far as practically possible in order to maximise native compatibility within the PyVista and VTK ecosystems.
We intend GeoVista to be a cartographic gateway into the powerful world of PyVista, and all that it offers.
GeoVista is intentionally agnostic to packages such as geopandas, iris, xarray et al, which specialise in preparing your spatial data for visualisation. Rather, we delegate that responsibility and choice of tool to you the user, as we want GeoVista to remain as flexible and open-ended as possible to the entire Scientific Python community.
Simply put, “GeoVista is to PyVista”, as “Cartopy is to Matplotlib”.
Note
Plotting Theme
GeoVista defines its own plotting theme in geovista.theme. PyVista allows you to set global and local plotting themes to easily set (learn more in Control Global and Local Plotting Themes ).
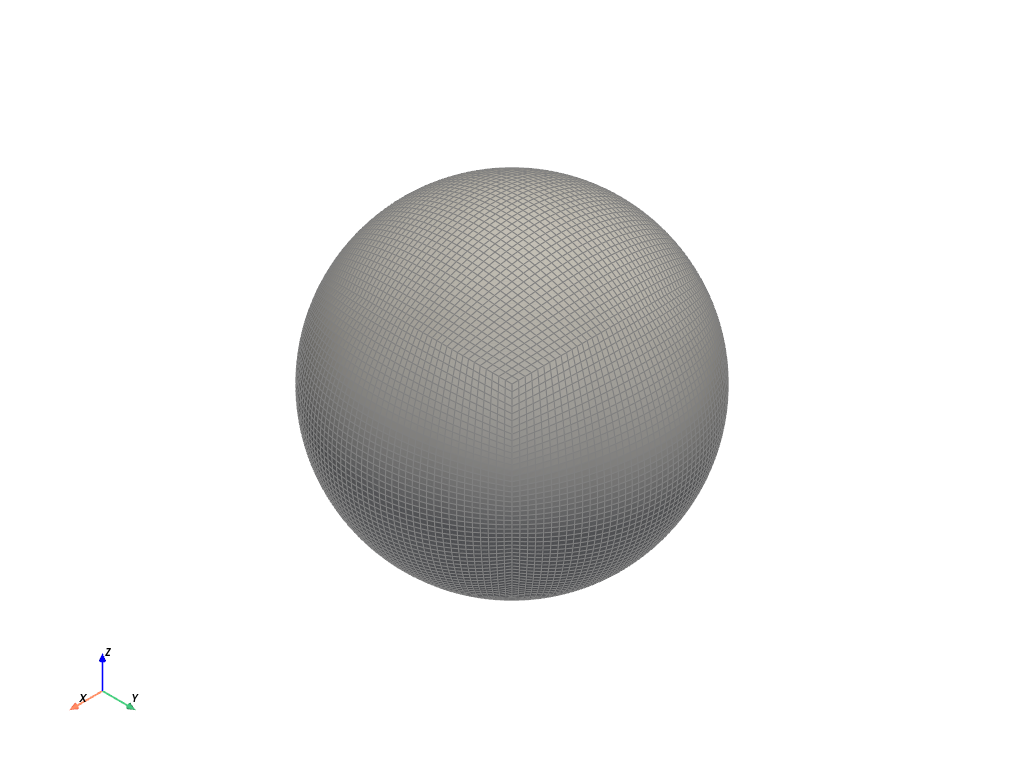
At the Met Office , they are moving to an unstructured cube-sphere mesh which is a cube projected out onto a sphere i.e., there are six panels on the sphere. Each cube-sphere is defined by the number of “cells squared” within each panel e.g., the following example is a C48 cube-sphere, so there are 6 * 48 * 48 cells.
GeoVista has samples for it.
help(gv.samples.lfric)
Help on function lfric in module geovista.samples:

lfric(resolution: 'str | None' = None) -> 'pv.PolyData'
    Create a mesh from :mod:`geovista.pantry` sample data.

    Get the LFRic model unstructured cubed-sphere at the specified `resolution`.

    Parameters
    ----------
    resolution : str, optional
        The resolution of the LFRic model mesh, which may be either
        ``c48``, ``c96`` or ``c192``. Defaults to :data:`LFRIC_RESOLUTION`.
        Also see :data:`LFRIC_RESOLUTIONS`.

    Returns
    -------
    PolyData
        The LFRic cubed-sphere mesh.

    Notes
    -----
    .. versionadded:: 0.1.0
c48 = gv.samples.lfric(resolution="c48")
Note
LFRic - a modelling system fit for future computers
If you are interested in LFRic, please refer to LFRic - a modelling system fit for future computers .
Since the c48 is defined as PolyData in PyVista, it can be drawn using PyVista’s plot method.
c48.plot(show_edges=True)
Here’s a sample C48 cube-sphere populated with Sea Surface Temperature data. In this data, cell data from PyVista’s PolyData object is used as temperature data:
help(gv.samples.lfric_sst)
Help on function lfric_sst in module geovista.samples:

lfric_sst() -> 'pv.PolyData'
    Create a mesh from :mod:`geovista.pantry` sample data.

    Generate a global Sea Surface Temperature (SST) mesh.

    Returns
    -------
    PolyData
        The SST mesh.

    Notes
    -----
    .. versionadded:: 0.1.0
c48_sst = gv.samples.lfric_sst()
c48_sst.plot(show_edges=True)
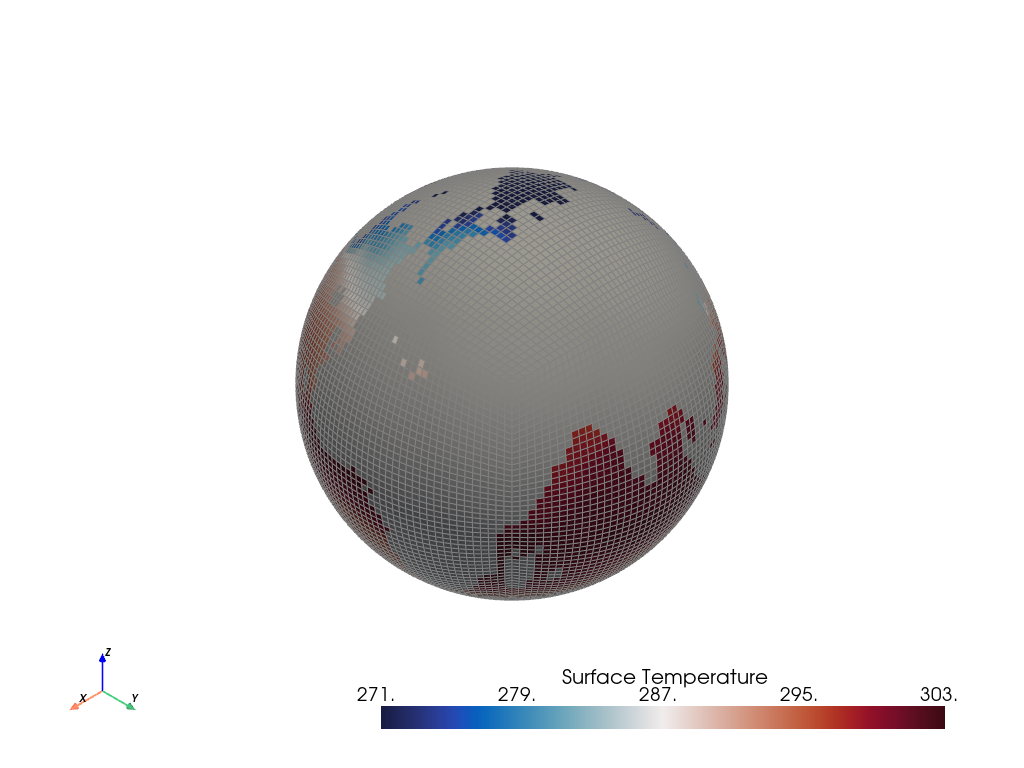
Note that, the land masses are masked.
There is a convenience within geovista.geodesic that creates a geovista.geodesic.BBox instance for any 1 of the 6 cube-sphere panels i.e., geovista.geodesic.panel
from geovista.geodesic import panel

help(panel)
Help on function panel in module geovista.geodesic:

panel(name: 'int | str', ellps: 'str | None' = 'WGS84', c: 'int | None' = 256, triangulate: 'bool | None' = False) -> 'BBox'
    Create boundary-box for specific cubed-sphere panel.

    Parameters
    ----------
    name : int or str
        The cubed-sphere index, see :data:`PANEL_NAME_BY_IDX`, or name, see
        :data:`PANEL_IDX_BY_NAME`, which specifies the panel bounding-box,
        see :data:`PANEL_BBOX_BY_IDX`.
    ellps : str, default=ELLIPSE
        The ellipsoid for geodesic calculations. See :func:`pyproj.get_ellps_map`.
    c : float, default=BBOX_C
        The bounding-box face geometry will contain ``c**2`` cells.
    triangulate : bool, default=False
        Specify whether the panel bounding-box faces are triangulated.

    Returns
    -------
    BBox
        The bounding-box that encloses the required cubed-sphere panel.

    Notes
    -----
    .. versionadded:: 0.1.0
bbox = panel("americas")
bbox.mesh.plot()
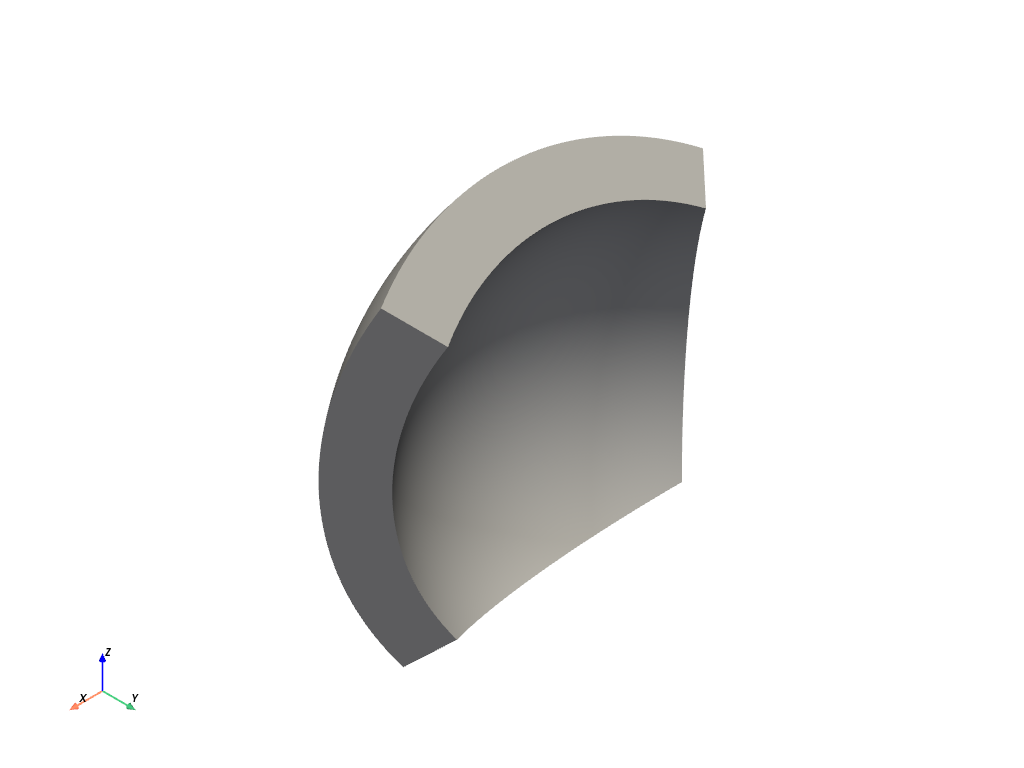
Note that, this bounding box (bbox) is constructed from geodesic lines i.e., great circles, and is a 3D manifold. As such, we can then use it to extract points/cells from any underlying mesh. Before doing that, first let’s render the bounding box and the mesh together so that we can see their relationship to one another. Note that, our bbox instance is indeed covering the correct panel of the cube-sphere.
plotter = pv.Plotter()
plotter.add_mesh(c48_sst, show_edges=True)
plotter.add_mesh(bbox.mesh)
plotter.add_axes()
plotter.view_yz()
plotter.show()
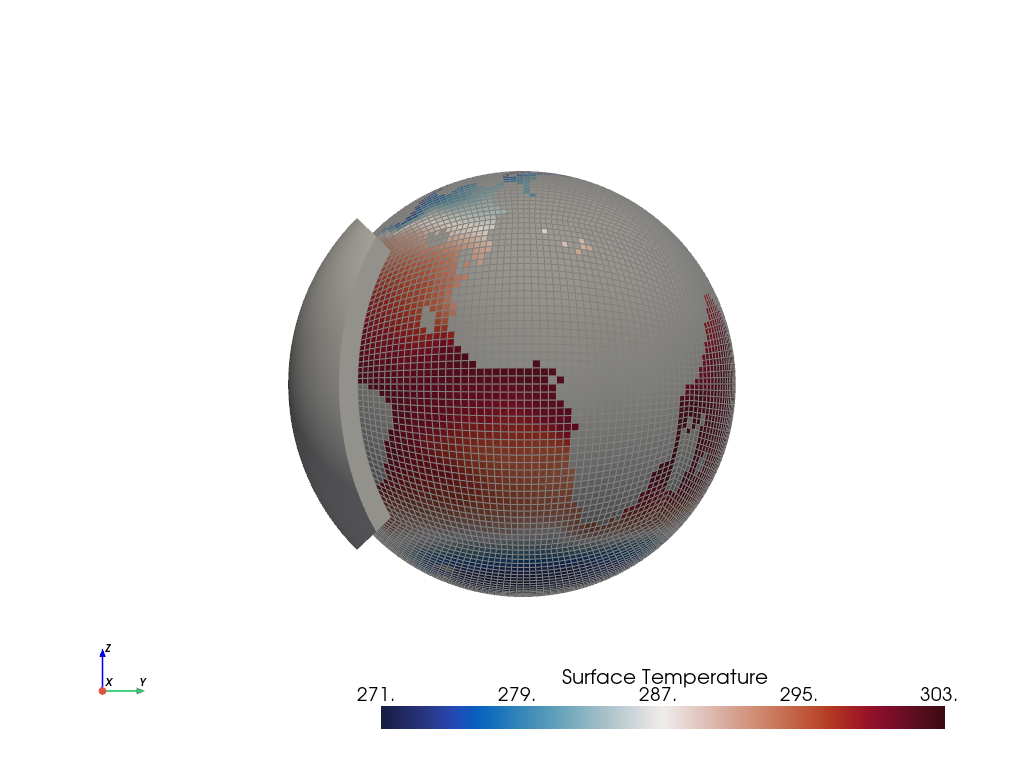
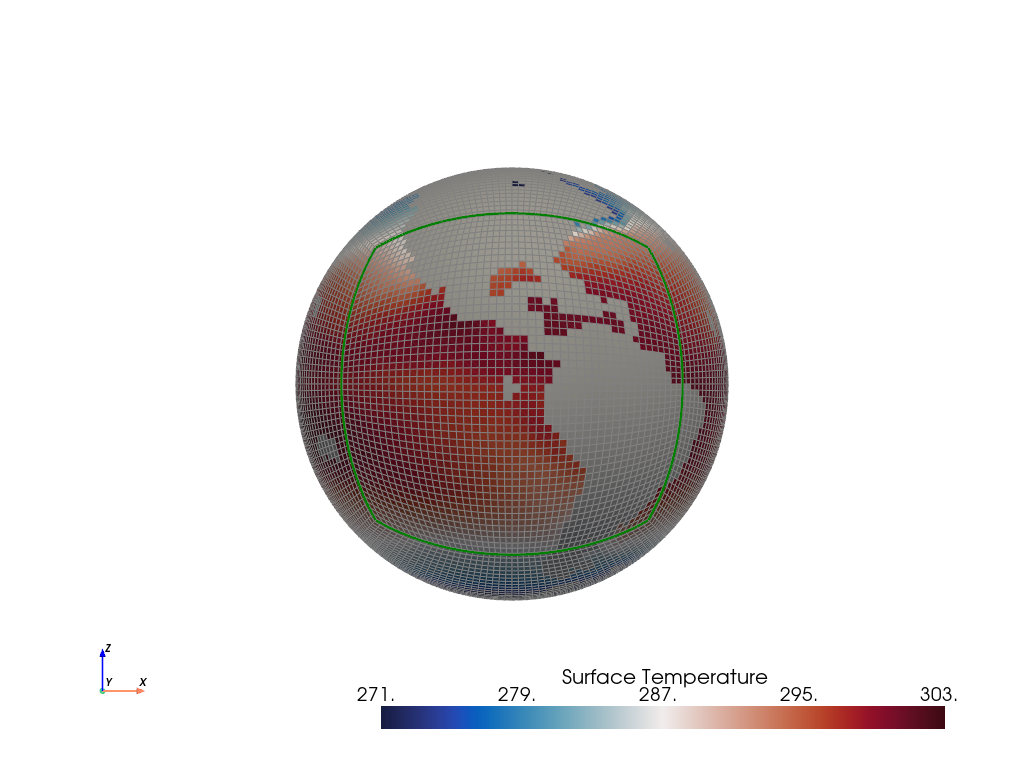
As a fun exercise, you could play with opacity on the bbox.mesh to see through the manifold to the underlying cube-sphere surface, or turn on the gridlines of the bbox etc
plotter = pv.Plotter()
plotter.add_mesh(c48_sst, show_edges=True)
plotter.add_mesh(bbox.boundary(), color="green", line_width=5)
plotter.add_axes()
plotter.view_xz()
plotter.show()
Let’s now use the bounding box to extract the mesh that it encloses:
region is defined as PolyData of PyVista.
help(region)
Help on PolyData in module pyvista.core.pointset object:
class PolyData(vtkmodules.vtkCommonDataModel.vtkPolyData, _PointSet, pyvista.core.filters.poly_data.PolyDataFilters)
| PolyData(var_inp=None, faces=None, n_faces=None, lines=None, n_lines=None, strips=None, n_strips=None, deep=False, force_ext=None, force_float=True) -> None
|
| Dataset consisting of surface geometry (e.g. vertices, lines, and polygons).
|
| Can be initialized in several ways:
|
| - Create an empty mesh
| - Initialize from a vtk.vtkPolyData
| - Using vertices
| - Using vertices and faces
| - From a file
|
| Parameters
| ----------
| var_inp : vtk.vtkPolyData, str, sequence, optional
| Flexible input type. Can be a ``vtk.vtkPolyData``, in which case
| this PolyData object will be copied if ``deep=True`` and will
| be a shallow copy if ``deep=False``.
|
| Also accepts a path, which may be local path as in
| ``'my_mesh.stl'`` or global path like ``'/tmp/my_mesh.ply'``
| or ``'C:/Users/user/my_mesh.ply'``.
|
| Otherwise, this must be a points array or list containing one
| or more points. Each point must have 3 dimensions.
|
| faces : sequence, optional
| Face connectivity array. Faces must contain padding
| indicating the number of points in the face. For example, the
| two faces ``[10, 11, 12]`` and ``[20, 21, 22, 23]`` will be
| represented as ``[3, 10, 11, 12, 4, 20, 21, 22, 23]``. This
| lets you have an arbitrary number of points per face.
|
| When not including the face connectivity array, each point
| will be assigned to a single vertex. This is used for point
| clouds that have no connectivity.
|
| n_faces : int, optional
| Number of faces in the ``faces`` connectivity array. While
| optional, setting this speeds up the creation of the
| ``PolyData``.
|
| lines : sequence, optional
| The line connectivity array. Like ``faces``, this array
| requires padding indicating the number of points in a line
| segment. For example, the two line segments ``[0, 1]`` and
| ``[1, 2, 3, 4]`` will be represented as
| ``[2, 0, 1, 4, 1, 2, 3, 4]``.
|
| n_lines : int, optional
| Number of lines in the ``lines`` connectivity array. While
| optional, setting this speeds up the creation of the
| ``PolyData``.
|
| strips : sequence, optional
| Triangle strips connectivity array. Triangle strips require an initial
| triangle, and the following points of the strip. Each
| triangle is built with the new point and the two previous
| points. Just as in ``lines`` and ``faces``, this array requires a
| padding indicating the number of points. For example,
| a single triangle strip of ``[0, 1, 2, 3, 6, 7, 4, 5, 0, 1]`` requires padding of
| ``10`` and should input as ``[10, 0, 1, 2, 3, 6, 7, 4, 5, 0, 1]``.
|
| n_strips : int, optional
| Number of strips in the ``strips`` connectivity array. While
| optional, setting this speeds up the creation of the
| ``PolyData``.
|
| deep : bool, optional
| Whether to copy the inputs, or to create a mesh from them
| without copying them. Setting ``deep=True`` ensures that the
| original arrays can be modified outside the mesh without
| affecting the mesh. Default is ``False``.
|
| force_ext : str, optional
| If initializing from a file, force the reader to treat the
| file as if it had this extension as opposed to the one in the
| file.
|
| force_float : bool, optional
| Casts the datatype to ``float32`` if points datatype is
| non-float. Default ``True``. Set this to ``False`` to allow
| non-float types, though this may lead to truncation of
| intermediate floats when transforming datasets.
|
|
| See Also
| --------
| pyvista.PolyData.from_regular_faces
|
| Examples
| --------
| >>> import vtk
| >>> import numpy as np
| >>> from pyvista import examples
| >>> import pyvista
|
| Create an empty mesh.
|
| >>> mesh = pyvista.PolyData()
|
| Initialize from a ``vtk.vtkPolyData`` object.
|
| >>> vtkobj = vtk.vtkPolyData()
| >>> mesh = pyvista.PolyData(vtkobj)
|
| Initialize from just vertices.
|
| >>> vertices = np.array(
| ... [[0, 0, 0], [1, 0, 0], [1, 0.5, 0], [0, 0.5, 0]]
| ... )
| >>> mesh = pyvista.PolyData(vertices)
|
| Initialize from vertices and faces.
|
| >>> faces = np.hstack([[3, 0, 1, 2], [3, 0, 3, 2]])
| >>> mesh = pyvista.PolyData(vertices, faces)
|
| Initialize from vertices and lines.
|
| >>> lines = np.hstack([[2, 0, 1], [2, 1, 2]])
| >>> mesh = pyvista.PolyData(vertices, lines=lines)
|
| Initialize from vertices and triangle strips.
|
| >>> strips = np.hstack([[4, 0, 1, 3, 2]])
| >>> mesh = pyvista.PolyData(vertices, strips=strips)
|
| Initialize from a filename.
|
| >>> mesh = pyvista.PolyData(examples.antfile)
|
| See :ref:`ref_create_poly` for more examples.
|
| Method resolution order:
| PolyData
| vtkmodules.vtkCommonDataModel.vtkPolyData
| vtkmodules.vtkCommonDataModel.vtkPointSet
| vtkmodules.vtkCommonDataModel.vtkDataSet
| vtkmodules.vtkCommonDataModel.vtkDataObject
| vtkmodules.vtkCommonCore.vtkObject
| vtkmodules.vtkCommonCore.vtkObjectBase
| _PointSet
| pyvista.core.dataset.DataSet
| pyvista.core.filters.poly_data.PolyDataFilters
| pyvista.core.filters.data_set.DataSetFilters
| pyvista.core.dataobject.DataObject
| builtins.object
|
| Methods defined here:
|
| __del__(self)
| Delete the object.
|
| __init__(self, var_inp=None, faces=None, n_faces=None, lines=None, n_lines=None, strips=None, n_strips=None, deep=False, force_ext=None, force_float=True) -> None
| Initialize the polydata.
|
| __repr__(self)
| Return the standard representation.
|
| __str__(self)
| Return the standard str representation.
|
| __sub__(self, cutting_mesh)
| Compute boolean difference of two meshes.
|
| save(self, filename, binary=True, texture=None, recompute_normals=True)
| Write a surface mesh to disk.
|
| Written file may be an ASCII or binary ply, stl, or vtk mesh
| file.
|
| Parameters
| ----------
| filename : str
| Filename of mesh to be written. File type is inferred from
| the extension of the filename unless overridden with
| ftype. Can be one of many of the supported the following
| types (``'.ply'``, ``'.stl'``, ``'.vtk``).
|
| binary : bool, default: True
| Writes the file as binary when ``True`` and ASCII when ``False``.
|
| texture : str, numpy.ndarray, optional
| Write a single texture array to file when using a PLY
| file. Texture array must be a 3 or 4 component array with
| the datatype ``np.uint8``. Array may be a cell array or a
| point array, and may also be a string if the array already
| exists in the PolyData.
|
| If a string is provided, the texture array will be saved
| to disk as that name. If an array is provided, the
| texture array will be saved as ``'RGBA'`` if the array
| contains an alpha channel (i.e. 4 component array), or
| as ``'RGB'`` if the array is just a 3 component array.
|
| .. note::
| This feature is only available when saving PLY files.
|
| recompute_normals : bool, default: True
| When ``True``, if ply or stl format is chosen, the face normals
| are computed in place to ensure the mesh is properly saved.
| Set this to ``False`` to save instead the already existing normal
| array in the PolyData.
|
| Notes
| -----
| Binary files write much faster than ASCII and have a smaller
| file size.
|
| Examples
| --------
| Save a mesh as a STL.
|
| >>> import pyvista
| >>> sphere = pyvista.Sphere()
| >>> sphere.save('my_mesh.stl') # doctest:+SKIP
|
| Save a mesh as a PLY.
|
| >>> sphere = pyvista.Sphere()
| >>> sphere.save('my_mesh.ply') # doctest:+SKIP
|
| Save a mesh as a PLY with a texture array. Here we also
| create a simple RGB array representing the texture.
|
| >>> import numpy as np
| >>> sphere = pyvista.Sphere()
| >>> texture = np.zeros((sphere.n_points, 3), np.uint8)
| >>> # Just the green channel is set as a repeatedly
| >>> # decreasing value
| >>> texture[:, 1] = np.arange(sphere.n_points)[::-1]
| >>> sphere.point_data['my_texture'] = texture
| >>> sphere.save(
| ... 'my_mesh.ply', texture='my_texture'
| ... ) # doctest:+SKIP
|
| Alternatively, provide just the texture array. This will be
| written to the file as ``'RGB'`` since it does not contain an
| alpha channel.
|
| >>> sphere.save('my_mesh.ply', texture=texture) # doctest:+SKIP
|
| Save a mesh as a VTK file.
|
| >>> sphere = pyvista.Sphere()
| >>> sphere.save('my_mesh.vtk') # doctest:+SKIP
|
| ----------------------------------------------------------------------
| Class methods defined here:
|
| from_regular_faces(points, faces: Union[numpy.ndarray, Sequence[Sequence[int]]], deep=False) from builtins.type
| Alternate `pyvista.PolyData` convenience constructor from point and regular face arrays.
|
| Parameters
| ----------
| points : numpy.ndarray, sequence[sequence[float]]
| A (n_points, 3) array of points.
|
| faces : numpy.ndarray or sequence[sequence[int]]
| A (n_faces, face_size) array of face indices. For a triangle mesh, face_size = 3.
|
| deep : bool, optional, default: False
| Whether to deep copy the faces array into vtkCellArray connectivity data.
|
| Returns
| -------
| pyvista.PolyData
| The newly constructed mesh.
|
| Examples
| --------
| Construct a tetrahedron from four triangles
|
| >>> import pyvista as pv
| >>> points = [[1.0, 1, 1], [-1, 1, -1], [1, -1, -1], [-1, -1, 1]]
| >>> faces = [[0, 1, 2], [1, 3, 2], [0, 2, 3], [0, 3, 1]]
| >>> tetra = pv.PolyData.from_regular_faces(points, faces)
|
| ----------------------------------------------------------------------
| Readonly properties defined here:
|
| cell_normals
| Return the cell normals.
|
| If the cell data already contains an array named ``'Normals'``, this
| array will be returned. Otherwise, the normals will be computed using
| the default options of :func:`compute_normals()
| <pyvista.PolyDataFilters.compute_normals>` and returned.
|
| Returns
| -------
| pyvista.pyvista_ndarray
| Array of cell normals.
|
| Examples
| --------
| >>> import pyvista
| >>> sphere = pyvista.Sphere()
| >>> sphere.cell_normals # doctest:+SKIP
| pyvista_ndarray([[-0.05413816, 0.00569015, -0.9985172 ],
| [-0.05177207, 0.01682176, -0.9985172 ],
| [-0.04714328, 0.02721819, -0.9985172 ],
| ...,
| [-0.26742265, -0.02810723, 0.96316934],
| [-0.1617585 , -0.01700151, 0.9866839 ],
| [-0.1617585 , -0.01700151, 0.9866839 ]], dtype=float32)
|
| face_normals
| Return the cell normals.
|
| Alias to :func:`PolyData.cell_normals`.
|
| Returns
| -------
| pyvista.pyvista_ndarray
| Array of face normals.
|
| Examples
| --------
| >>> import pyvista
| >>> sphere = pyvista.Sphere()
| >>> sphere.face_normals # doctest:+SKIP
| pyvista_ndarray([[-0.05413816, 0.00569015, -0.9985172 ],
| [-0.05177207, 0.01682176, -0.9985172 ],
| [-0.04714328, 0.02721819, -0.9985172 ],
| ...,
| [-0.26742265, -0.02810723, 0.96316934],
| [-0.1617585 , -0.01700151, 0.9866839 ],
| [-0.1617585 , -0.01700151, 0.9866839 ]], dtype=float32)
|
| is_all_triangles
| Return if all the faces of the :class:`pyvista.PolyData` are triangles.
|
| Returns
| -------
| bool
| ``True`` if all the faces of the :class:`pyvista.PolyData`
| are triangles and does not contain any vertices or lines.
|
| Examples
| --------
| Show a mesh from :func:`pyvista.Plane` is not composed of all
| triangles.
|
| >>> import pyvista
| >>> plane = pyvista.Plane()
| >>> plane.is_all_triangles
| False
|
| Show that the mesh from :func:`pyvista.Sphere` contains only
| triangles.
|
| >>> sphere = pyvista.Sphere()
| >>> sphere.is_all_triangles
| True
|
| is_manifold
| Return if the mesh is manifold (no open edges).
|
| Examples
| --------
| Show a sphere is manifold.
|
| >>> import pyvista
| >>> pyvista.Sphere().is_manifold
| True
|
| Show a plane is not manifold.
|
| >>> pyvista.Plane().is_manifold
| False
|
| n_faces
| Return the number of cells.
|
| Alias for ``n_cells``.
|
| Examples
| --------
| >>> import pyvista
| >>> plane = pyvista.Plane(i_resolution=2, j_resolution=2)
| >>> plane.n_faces
| 4
|
| n_lines
| Return the number of lines.
|
| Examples
| --------
| >>> import pyvista
| >>> mesh = pyvista.Line()
| >>> mesh.n_lines
| 1
|
| n_open_edges
| Return the number of open edges on this mesh.
|
| Examples
| --------
| Return the number of open edges on a sphere.
|
| >>> import pyvista
| >>> sphere = pyvista.Sphere()
| >>> sphere.n_open_edges
| 0
|
| Return the number of open edges on a plane.
|
| >>> plane = pyvista.Plane(i_resolution=1, j_resolution=1)
| >>> plane.n_open_edges
| 4
|
| n_strips
| Return the number of strips.
|
| Examples
| --------
| Create a simple mesh with one triangle strip and return the
| number of triangles.
|
| >>> import pyvista
| >>> import numpy as np
| >>> vertices = np.array(
| ... [[1.0, 0.0, 0.0], [1.0, 1.0, 1.0], [1.0, 1.0, 1.0]]
| ... )
| >>> strip = np.array([3, 0, 1, 2])
| >>> mesh = pyvista.PolyData(vertices, strips=strip)
| >>> mesh.n_strips
| 1
|
| n_verts
| Return the number of vertices.
|
| A vertex is a 0D cell, which is usually a cell that references one point,
| a vtkVertex. It can also be a vtkPolyVertex.
| See `pyvista.PolyData.n_points` for the more common measure.
|
| Examples
| --------
| Create a simple mesh containing just two points and return the
| number of vertices. By default, when constructing a PolyData with points but no cells,
| vertices are automatically created, one per point.
|
| >>> import pyvista
| >>> mesh = pyvista.PolyData([[1.0, 0.0, 0.0], [1.0, 1.0, 1.0]])
| >>> mesh.n_points, mesh.n_verts
| (2, 2)
|
| If any other cells are specified, these vertices are not created.
|
| >>> import pyvista
| >>> mesh = pyvista.PolyData(
| ... [[1.0, 0.0, 0.0], [1.0, 1.0, 1.0]], lines=[2, 0, 1]
| ... )
| >>> mesh.n_points, mesh.n_verts
| (2, 0)
|
| obbTree
| Return the obbTree of the polydata.
|
| An obbTree is an object to generate oriented bounding box (OBB)
| trees. An oriented bounding box is a bounding box that does not
| necessarily line up along coordinate axes. The OBB tree is a
| hierarchical tree structure of such boxes, where deeper levels of OBB
| confine smaller regions of space.
|
| point_normals
| Return the point normals.
|
| If the point data already contains an array named ``'Normals'``, this
| array will be returned. Otherwise, the normals will be computed using
| the default options of :func:`compute_normals()
| <pyvista.PolyDataFilters.compute_normals>` and returned.
|
| Returns
| -------
| pyvista.pyvista_ndarray
| Array of point normals.
|
| Examples
| --------
| >>> import pyvista
| >>> sphere = pyvista.Sphere()
| >>> sphere.point_normals # doctest:+SKIP
| pyvista_ndarray([[-2.48721432e-10, -1.08815623e-09, -1.00000000e+00],
| [-2.48721432e-10, -1.08815623e-09, 1.00000000e+00],
| [-1.18888125e-01, 3.40539310e-03, -9.92901802e-01],
| ...,
| [-3.11940581e-01, -6.81432486e-02, 9.47654784e-01],
| [-2.09880397e-01, -4.65070531e-02, 9.76620376e-01],
| [-1.15582108e-01, -2.80492082e-02, 9.92901802e-01]],
| dtype=float32)
|
| volume
| Return the approximate volume of the dataset.
|
| This will throw a VTK error/warning if not a closed surface.
|
| Returns
| -------
| float
| Total volume of the mesh.
|
| Examples
| --------
| >>> import pyvista
| >>> sphere = pyvista.Sphere()
| >>> sphere.volume
| 0.5183
|
| ----------------------------------------------------------------------
| Data descriptors defined here:
|
| faces
| Return the connectivity array of the faces of this PolyData.
|
| The faces array is organized as::
|
| [n0, p0_0, p0_1, ..., p0_n, n1, p1_0, p1_1, ..., p1_n, ...]
|
| where ``n0`` is the number of points in face 0, and ``pX_Y`` is the
| Y'th point in face X.
|
| For example, a triangle and a quadrilateral might be represented as::
|
| [3, 0, 1, 2, 4, 0, 1, 3, 4]
|
| Where the two individual faces would be ``[3, 0, 1, 2]`` and ``[4, 0, 1, 3, 4]``.
|
| Returns
| -------
| numpy.ndarray
| Array of face connectivity.
|
| See Also
| --------
| pyvista.PolyData.regular_faces
|
| Notes
| -----
| The array returned cannot be modified in place and will raise a
| ``ValueError`` if attempted.
|
| You can, however, set the faces directly. See the example.
|
| Examples
| --------
| >>> import pyvista as pv
| >>> plane = pv.Plane(i_resolution=2, j_resolution=2)
| >>> plane.faces
| array([4, 0, 1, 4, 3, 4, 1, 2, 5, 4, 4, 3, 4, 7, 6, 4, 4, 5, 8, 7])
|
| Note how the faces contain a "padding" indicating the number
| of points per face:
|
| >>> plane.faces.reshape(-1, 5)
| array([[4, 0, 1, 4, 3],
| [4, 1, 2, 5, 4],
| [4, 3, 4, 7, 6],
| [4, 4, 5, 8, 7]])
|
| Set the faces directly. The following example creates a simple plane
| with a single square faces and modifies it to have two triangles
| instead.
|
| >>> mesh = pv.Plane(i_resolution=1, j_resolution=1)
| >>> mesh.faces = [3, 0, 1, 2, 3, 3, 2, 1]
| >>> mesh.faces
| array([3, 0, 1, 2, 3, 3, 2, 1])
|
| lines
| Return a pointer to the lines as a numpy array.
|
| Examples
| --------
| Return the lines from a spline.
|
| >>> import pyvista
| >>> import numpy as np
| >>> points = np.random.random((3, 3))
| >>> spline = pyvista.Spline(points, 10)
| >>> spline.lines
| array([10, 0, 1, 2, 3, 4, 5, 6, 7, 8, 9])
|
| regular_faces
| Return a face array of point indices when all faces have the same size.
|
| Returns
| -------
| numpy.ndarray
| Array of face indices with shape (n_faces, face_size).
|
| See Also
| --------
| pyvista.PolyData.faces
|
| Notes
| -----
| This property does not validate that the mesh's faces are all
| actually the same size. If they're not, this property may either
| raise a `ValueError` or silently return an incorrect array.
|
| Examples
| --------
| Get the face array of a tetrahedron as a 4x3 array
|
| >>> import pyvista as pv
| >>> tetra = pv.Tetrahedron()
| >>> tetra.regular_faces
| array([[0, 1, 2],
| [1, 3, 2],
| [0, 2, 3],
| [0, 3, 1]])
|
| strips
| Return a pointer to the strips as a numpy array.
|
| Returns
| -------
| numpy.ndarray
| Array of strip indices.
|
| Examples
| --------
| >>> import pyvista as pv
| >>> polygon = pv.Rectangle()
| >>> extruded = polygon.extrude((0, 0, 1), capping=False)
| >>> extruded.strips
| array([4, 0, 1, 4, 5, 4, 1, 2, 5, 6, 4, 2, 3, 6, 7, 4, 3, 0, 7, 4])
|
| verts
| Get the vertex cells.
|
| Returns
| -------
| numpy.ndarray
| Array of vertex cell indices.
|
| Examples
| --------
| Create a point cloud polydata and return the vertex cells.
|
| >>> import pyvista
| >>> import numpy as np
| >>> points = np.random.random((5, 3))
| >>> pdata = pyvista.PolyData(points)
| >>> pdata.verts
| array([1, 0, 1, 1, 1, 2, 1, 3, 1, 4])
|
| Set vertex cells. Note how the mesh plots both the surface
| mesh and the additional vertices in a single plot.
|
| >>> mesh = pyvista.Plane(i_resolution=3, j_resolution=3)
| >>> mesh.verts = np.vstack(
| ... (
| ... np.ones(mesh.n_points, dtype=np.int64),
| ... np.arange(mesh.n_points),
| ... )
| ... ).T
| >>> mesh.plot(
| ... color='lightblue',
| ... render_points_as_spheres=True,
| ... point_size=60,
| ... )
|
| ----------------------------------------------------------------------
| Data and other attributes defined here:
|
| __annotations__ = {}
|
| ----------------------------------------------------------------------
| Methods inherited from vtkmodules.vtkCommonDataModel.vtkPolyData:
|
| AddCellReference(...)
| AddCellReference(self, cellId:int) -> None
| C++: void AddCellReference(vtkIdType cellId)
|
| Add references to cell in cell structure. This means the links
| from the cell's points to the cell are modified. Memory is not
| extended. Use the method ResizeCellList() to resize the link list
| from a point to its using cells. (This operator assumes
| BuildLinks() has been called.) Use this method only when the
| dataset is set as Editable.
|
| AddReferenceToCell(...)
| AddReferenceToCell(self, ptId:int, cellId:int) -> None
| C++: void AddReferenceToCell(vtkIdType ptId, vtkIdType cellId)
|
| Add a reference to a cell in a particular point's link list. (You
| may also consider using AddCellReference() to add the references
| from all the cell's points to the cell.) This operator does not
| realloc memory; use the operator ResizeCellList() to do this if
| necessary. Use this method only when the dataset is set as
| Editable.
|
| Allocate(...)
| Allocate(self, numCells:int=1000, extSize:int=1000) -> None
| C++: void Allocate(vtkIdType numCells=1000, int extSize=1000)
| Allocate(self, inPolyData:vtkPolyData, numCells:int=1000,
| extSize:int=1000) -> None
| C++: void Allocate(vtkPolyData *inPolyData,
| vtkIdType numCells=1000, int extSize=1000)
|
| Method allocates initial storage for vertex, line, polygon, and
| triangle strip arrays. Use this method before the method
| PolyData::InsertNextCell(). (Or, provide vertex, line, polygon,
| and triangle strip cell arrays). extSize is no longer used.
|
| AllocateCopy(...)
| AllocateCopy(self, pd:vtkPolyData) -> bool
| C++: bool AllocateCopy(vtkPolyData *pd)
|
| Preallocate memory for the internal cell arrays such that they
| are the same size as those in pd.
|
| Existing data is not preserved and the number of cells is set to
| zero.
|
| @return True if allocation succeeds.
|
| AllocateEstimate(...)
| AllocateEstimate(self, numCells:int, maxCellSize:int) -> bool
| C++: bool AllocateEstimate(vtkIdType numCells,
| vtkIdType maxCellSize)
| AllocateEstimate(self, numVerts:int, maxVertSize:int,
| numLines:int, maxLineSize:int, numPolys:int, maxPolySize:int,
| numStrips:int, maxStripSize:int) -> bool
| C++: bool AllocateEstimate(vtkIdType numVerts,
| vtkIdType maxVertSize, vtkIdType numLines,
| vtkIdType maxLineSize, vtkIdType numPolys,
| vtkIdType maxPolySize, vtkIdType numStrips,
| vtkIdType maxStripSize)
|
| Preallocate memory for the internal cell arrays. Each of the
| internal cell arrays (verts, lines, polys, and strips) will be
| resized to holdnumCells cells of size maxCellSize.
|
| Existing data is not preserved and the number of cells is set to
| zero.
|
| @return True if allocation succeeds.
|
| AllocateExact(...)
| AllocateExact(self, numCells:int, connectivitySize:int) -> bool
| C++: bool AllocateExact(vtkIdType numCells,
| vtkIdType connectivitySize)
| AllocateExact(self, numVerts:int, vertConnSize:int, numLines:int,
| lineConnSize:int, numPolys:int, polyConnSize:int,
| numStrips:int, stripConnSize:int) -> bool
| C++: bool AllocateExact(vtkIdType numVerts,
| vtkIdType vertConnSize, vtkIdType numLines,
| vtkIdType lineConnSize, vtkIdType numPolys,
| vtkIdType polyConnSize, vtkIdType numStrips,
| vtkIdType stripConnSize)
|
| Preallocate memory for the internal cell arrays. Each of the
| internal cell arrays (verts, lines, polys, and strips) will be
| resized to holdnumCells cells and connectivitySize pointIds.
|
| Existing data is not preserved and the number of cells is set to
| zero.
|
| @return True if allocation succeeds.
|
| AllocateProportional(...)
| AllocateProportional(self, pd:vtkPolyData, ratio:float) -> bool
| C++: bool AllocateProportional(vtkPolyData *pd, double ratio)
|
| Preallocate memory for the internal cell arrays such that they
| are proportional to those in pd by a factor of ratio (for
| instance,ratio = 2 allocates twice as many cells).
|
| Existing data is not preserved and the number of cells is set to
| zero.
|
| @return True if allocation succeeds.
|
| BuildCells(...)
| BuildCells(self) -> None
| C++: void BuildCells()
|
| Create data structure that allows random access of cells.
| BuildCells is expensive but necessary to make use of the faster
| non-virtual implementations of GetCell/GetCellPoints. One may
| check if cells need to be built via NeedToBuilds before invoking.
| Cells always need to be built/re-built after low level direct
| modifications to verts, lines, polys or strips cell arrays.
|
| BuildLinks(...)
| BuildLinks(self, initialSize:int=0) -> None
| C++: void BuildLinks(int initialSize=0)
|
| Create upward links from points to cells that use each point.
| Enables topologically complex queries. Normally the links array
| is allocated based on the number of points in the vtkPolyData.
| The optional initialSize parameter can be used to allocate a
| larger size initially.
|
| ComputeCellsBounds(...)
| ComputeCellsBounds(self) -> None
| C++: void ComputeCellsBounds()
|
| Compute the (X, Y, Z) bounds of the data. Note that the method
| only considers points that are used by cells. This is done for
| usability and historical reasons.
|
| IMPORTANT
|
| Until vtk 9.0.1, vtkPolyData::ComputeBounds() used to ignore
| points that do not belong to any cell. That was not consistent
| with other vtkPointSet subclasses and thus was error prone. See
| this ParaView issue
| https://gitlab.kitware.com/paraview/paraview/-/issues/20354 Now
| it defers to vtkPointSet::ComputeBounds() so
| vtkPolyData::GetBounds() may not return the same bounds as
| before. This behavior is probably the one you want when using
| bounds.
|
| The previous behavior is still available through
| vtkPolyData::ComputeCellsBounds() and
| vtkPolyData::GetCellsBounds(). This is mainly used for rendering
| purpose.
|
| CopyCells(...)
| CopyCells(self, pd:vtkPolyData, idList:vtkIdList,
| locator:vtkIncrementalPointLocator=...) -> None
| C++: void CopyCells(vtkPolyData *pd, vtkIdList *idList,
| vtkIncrementalPointLocator *locator=nullptr)
|
| Copy cells listed in idList from pd, including points, point
| data, and cell data. This method assumes that point and cell
| data have been allocated. If you pass in a point locator, then
| the points won't be duplicated in the output. This requires the
| use of an incremental point locator.
|
| CopyStructure(...)
| CopyStructure(self, ds:vtkDataSet) -> None
| C++: void CopyStructure(vtkDataSet *ds) override;
|
| Copy the geometric and topological structure of an input poly
| data object.
|
| DeepCopy(...)
| DeepCopy(self, src:vtkDataObject) -> None
| C++: void DeepCopy(vtkDataObject *src) override;
|
| DeleteCell(...)
| DeleteCell(self, cellId:int) -> None
| C++: void DeleteCell(vtkIdType cellId)
|
| DeleteCells(...)
| DeleteCells(self) -> None
| C++: void DeleteCells()
|
| Release data structure that allows random access of the cells.
| This must be done before a 2nd call to BuildLinks(). DeleteCells
| implicitly deletes the links as well since they are no longer
| valid.
|
| DeleteLinks(...)
| DeleteLinks(self) -> None
| C++: void DeleteLinks()
|
| Release the upward links from point to cells that use each point.
|
| DeletePoint(...)
| DeletePoint(self, ptId:int) -> None
| C++: void DeletePoint(vtkIdType ptId)
|
| Mark a point/cell as deleted from this vtkPolyData. Use this
| method only when the dataset is set as Editable.
|
| ExtendedNew(...)
| ExtendedNew() -> vtkPolyData
| C++: static vtkPolyData *ExtendedNew()
|
| GetActualMemorySize(...)
| GetActualMemorySize(self) -> int
| C++: unsigned long GetActualMemorySize() override;
|
| Return the actual size of the data in kibibytes (1024 bytes).
| This number is valid only after the pipeline has updated. The
| memory size returned is guaranteed to be greater than or equal to
| the memory required to represent the data (e.g., extra space in
| arrays, etc. are not included in the return value). THIS METHOD
| IS THREAD SAFE.
|
| GetCell(...)
| GetCell(self, cellId:int) -> vtkCell
| C++: vtkCell *GetCell(vtkIdType cellId) override;
| GetCell(self, cellId:int, cell:vtkGenericCell) -> None
| C++: void GetCell(vtkIdType cellId, vtkGenericCell *cell)
| override;
| GetCell(self, cellId:int, pts:(int, ...)) -> int
| C++: unsigned char GetCell(vtkIdType cellId,
| const vtkIdType *&pts)
| GetCell(self, i:int, j:int, k:int) -> vtkCell
| C++: virtual vtkCell *GetCell(int i, int j, int k)
|
| This method always return a `vtkEmptyCell`, as there is no cell
| in a `vtkPointSet`.
|
| GetCellBounds(...)
| GetCellBounds(self, cellId:int, bounds:[float, float, float,
| float, float, float]) -> None
| C++: void GetCellBounds(vtkIdType cellId, double bounds[6])
| override;
|
| Get the bounds of the cell with cellId such that: 0 <= cellId <
| NumberOfCells. A subclass may be able to determine the bounds of
| cell without using an expensive GetCell() method. A default
| implementation is provided that actually uses a GetCell() call.
| This is to ensure the method is available to all datasets.
| Subclasses should override this method to provide an efficient
| implementation. THIS METHOD IS THREAD SAFE IF FIRST CALLED FROM A
| SINGLE THREAD AND THE DATASET IS NOT MODIFIED
|
| GetCellEdgeNeighbors(...)
| GetCellEdgeNeighbors(self, cellId:int, p1:int, p2:int,
| cellIds:vtkIdList) -> None
| C++: void GetCellEdgeNeighbors(vtkIdType cellId, vtkIdType p1,
| vtkIdType p2, vtkIdList *cellIds)
|
| Get the neighbors at an edge. More efficient than the general
| GetCellNeighbors(). Assumes links have been built (with
| BuildLinks()), and looks specifically for edge neighbors.
|
| GetCellIdRelativeToCellArray(...)
| GetCellIdRelativeToCellArray(self, cellId:int) -> int
| C++: vtkIdType GetCellIdRelativeToCellArray(vtkIdType cellId)
|
| Maps the cell at position `cellId` inside the `vtkPolyData` to
| its location in the corresponding cell array. For instance, if
| cell `cellId` is a line, then this method returns the position of
| this cell in the `Lines` cell array.
|
| GetCellNeighbors(...)
| GetCellNeighbors(self, cellId:int, ptIds:vtkIdList,
| cellIds:vtkIdList) -> None
| C++: void GetCellNeighbors(vtkIdType cellId, vtkIdList *ptIds,
| vtkIdList *cellIds) override;
|
| Topological inquiry to get all cells using list of points
| exclusive of cell specified (e.g., cellId). Note that the list
| consists of only cells that use ALL the points provided. THIS
| METHOD IS THREAD SAFE IF FIRST CALLED FROM A SINGLE THREAD AND
| THE DATASET IS NOT MODIFIED
|
| GetCellPoints(...)
| GetCellPoints(self, cellId:int, ptIds:vtkIdList) -> None
| C++: void GetCellPoints(vtkIdType cellId, vtkIdList *ptIds)
| override;
| GetCellPoints(self, cellId:int, npts:int, pts:(int, ...)) -> int
| C++: unsigned char GetCellPoints(vtkIdType cellId,
| vtkIdType &npts, vtkIdType const *&pts)
| GetCellPoints(self, cellId:int, npts:int, pts:(int, ...),
| ptIds:vtkIdList) -> None
| C++: void GetCellPoints(vtkIdType cellId, vtkIdType &npts,
| vtkIdType const *&pts, vtkIdList *ptIds) override;
|
| Copy a cells point ids into list provided. (Less efficient.)
|
| GetCellSize(...)
| GetCellSize(self, cellId:int) -> int
| C++: vtkIdType GetCellSize(vtkIdType cellId) override;
|
| This method always returns 1, as all cells are point in a pure
| `vtkPointSet`.
|
| GetCellType(...)
| GetCellType(self, cellId:int) -> int
| C++: int GetCellType(vtkIdType cellId) override;
|
| This method always returns `VTK_EMPTY_CELL`, as there is no cell
| in a `vtkPointSet`.
|
| GetCellsBounds(...)
| GetCellsBounds(self, bounds:[float, float, float, float, float,
| float]) -> None
| C++: void GetCellsBounds(double bounds[6])
|
| Get the cells bounds. Internally calls ComputeCellsBounds().
| @sa ComputeCellsBounds()
|
| GetData(...)
| GetData(info:vtkInformation) -> vtkPolyData
| C++: static vtkPolyData *GetData(vtkInformation *info)
| GetData(v:vtkInformationVector, i:int=0) -> vtkPolyData
| C++: static vtkPolyData *GetData(vtkInformationVector *v, int i=0)
|
| Retrieve an instance of this class from an information object.
|
| GetDataObjectType(...)
| GetDataObjectType(self) -> int
| C++: int GetDataObjectType() override;
|
| Return what type of dataset this is.
|
| GetGhostLevel(...)
| GetGhostLevel(self) -> int
| C++: virtual int GetGhostLevel()
|
| Get the ghost level.
|
| GetLines(...)
| GetLines(self) -> vtkCellArray
| C++: vtkCellArray *GetLines()
|
| Get the cell array defining lines. If there are no lines, an
| empty array will be returned (convenience to simplify traversal).
|
| GetLinks(...)
| GetLinks(self) -> vtkAbstractCellLinks
| C++: virtual vtkAbstractCellLinks *GetLinks()
|
| GetMTime(...)
| GetMTime(self) -> int
| C++: vtkMTimeType GetMTime() override;
|
| Get MTime which also considers its cell array MTime.
|
| GetMaxCellSize(...)
| GetMaxCellSize(self) -> int
| C++: int GetMaxCellSize() override;
|
| Return the maximum cell size in this poly data.
|
| GetMeshMTime(...)
| GetMeshMTime(self) -> int
| C++: virtual vtkMTimeType GetMeshMTime()
|
| Return the mesh (geometry/topology) modification time. This time
| is different from the usual MTime which also takes into account
| the modification of data arrays. This function can be used to
| track the changes on the mesh separately from the data arrays
| (eg. static mesh over time with transient data).
|
| GetNumberOfCells(...)
| GetNumberOfCells(self) -> int
| C++: vtkIdType GetNumberOfCells() override;
|
| Standard vtkDataSet interface.
|
| GetNumberOfGenerationsFromBase(...)
| GetNumberOfGenerationsFromBase(self, type:str) -> int
| C++: vtkIdType GetNumberOfGenerationsFromBase(const char *type)
| override;
|
| Given the name of a base class of this class type, return the
| distance of inheritance between this class type and the named
| class (how many generations of inheritance are there between this
| class and the named class). If the named class is not in this
| class's inheritance tree, return a negative value. Valid
| responses will always be nonnegative. This method works in
| combination with vtkTypeMacro found in vtkSetGet.h.
|
| GetNumberOfGenerationsFromBaseType(...)
| GetNumberOfGenerationsFromBaseType(type:str) -> int
| C++: static vtkIdType GetNumberOfGenerationsFromBaseType(
| const char *type)
|
| Given a the name of a base class of this class type, return the
| distance of inheritance between this class type and the named
| class (how many generations of inheritance are there between this
| class and the named class). If the named class is not in this
| class's inheritance tree, return a negative value. Valid
| responses will always be nonnegative. This method works in
| combination with vtkTypeMacro found in vtkSetGet.h.
|
| GetNumberOfLines(...)
| GetNumberOfLines(self) -> int
| C++: vtkIdType GetNumberOfLines()
|
| GetNumberOfPieces(...)
| GetNumberOfPieces(self) -> int
| C++: virtual int GetNumberOfPieces()
|
| GetNumberOfPolys(...)
| GetNumberOfPolys(self) -> int
| C++: vtkIdType GetNumberOfPolys()
|
| GetNumberOfStrips(...)
| GetNumberOfStrips(self) -> int
| C++: vtkIdType GetNumberOfStrips()
|
| GetNumberOfVerts(...)
| GetNumberOfVerts(self) -> int
| C++: vtkIdType GetNumberOfVerts()
|
| Return the number of primitives of a particular type held.
|
| GetPiece(...)
| GetPiece(self) -> int
| C++: virtual int GetPiece()
|
| Get the piece and the number of pieces. Similar to extent in 3D.
|
| GetPointCells(...)
| GetPointCells(self, ptId:int, cellIds:vtkIdList) -> None
| C++: void GetPointCells(vtkIdType ptId, vtkIdList *cellIds)
| override;
| GetPointCells(self, ptId:int, ncells:int, cells:[int, ...])
| -> None
| C++: void GetPointCells(vtkIdType ptId, vtkIdType &ncells,
| vtkIdType *&cells)
|
| Efficient method to obtain cells using a particular point. Make
| sure that routine BuildLinks() has been called.
|
| GetPolys(...)
| GetPolys(self) -> vtkCellArray
| C++: vtkCellArray *GetPolys()
|
| Get the cell array defining polygons. If there are no polygons,
| an empty array will be returned (convenience to simplify
| traversal).
|
| GetScalarFieldCriticalIndex(...)
| GetScalarFieldCriticalIndex(self, pointId:int,
| scalarField:vtkDataArray) -> int
| C++: int GetScalarFieldCriticalIndex(vtkIdType pointId,
| vtkDataArray *scalarField)
| GetScalarFieldCriticalIndex(self, pointId:int, fieldId:int) -> int
| C++: int GetScalarFieldCriticalIndex(vtkIdType pointId,
| int fieldId)
| GetScalarFieldCriticalIndex(self, pointId:int, fieldName:str)
| -> int
| C++: int GetScalarFieldCriticalIndex(vtkIdType pointId,
| const char *fieldName)
|
| GetStrips(...)
| GetStrips(self) -> vtkCellArray
| C++: vtkCellArray *GetStrips()
|
| Get the cell array defining triangle strips. If there are no
| triangle strips, an empty array will be returned (convenience to
| simplify traversal).
|
| GetVerts(...)
| GetVerts(self) -> vtkCellArray
| C++: vtkCellArray *GetVerts()
|
| Get the cell array defining vertices. If there are no vertices,
| an empty array will be returned (convenience to simplify
| traversal).
|
| Initialize(...)
| Initialize(self) -> None
| C++: void Initialize() override;
|
| Restore object to initial state. Release memory back to system.
|
| InsertNextCell(...)
| InsertNextCell(self, type:int, npts:int, pts:(int, ...)) -> int
| C++: vtkIdType InsertNextCell(int type, int npts,
| const vtkIdType pts[])
| InsertNextCell(self, type:int, pts:vtkIdList) -> int
| C++: vtkIdType InsertNextCell(int type, vtkIdList *pts)
|
| Insert a cell of type VTK_VERTEX, VTK_POLY_VERTEX, VTK_LINE,
| VTK_POLY_LINE, VTK_TRIANGLE, VTK_QUAD, VTK_POLYGON, or
| VTK_TRIANGLE_STRIP. Make sure that the PolyData::Allocate()
| function has been called first or that vertex, line, polygon, and
| triangle strip arrays have been supplied. Note: will also insert
| VTK_PIXEL, but converts it to VTK_QUAD.
|
| InsertNextLinkedCell(...)
| InsertNextLinkedCell(self, type:int, npts:int, pts:(int, ...))
| -> int
| C++: vtkIdType InsertNextLinkedCell(int type, int npts,
| const vtkIdType pts[])
|
| Add a new cell to the cell data structure (after cell pointers
| have been built). This method adds the cell and then updates the
| links from the points to the cells. (Memory is allocated as
| necessary.) Use this method only when the dataset is set as
| Editable.
|
| InsertNextLinkedPoint(...)
| InsertNextLinkedPoint(self, numLinks:int) -> int
| C++: vtkIdType InsertNextLinkedPoint(int numLinks)
| InsertNextLinkedPoint(self, x:[float, float, float], numLinks:int)
| -> int
| C++: vtkIdType InsertNextLinkedPoint(double x[3], int numLinks)
|
| Add a point to the cell data structure (after cell pointers have
| been built). This method adds the point and then allocates memory
| for the links to the cells. (To use this method, make sure
| points are available and BuildLinks() has been invoked.) Of the
| two methods below, one inserts a point coordinate and the other
| just makes room for cell links. Use this method only when the
| dataset is set as Editable.
|
| IsA(...)
| IsA(self, type:str) -> int
| C++: vtkTypeBool IsA(const char *type) override;
|
| Return 1 if this class is the same type of (or a subclass of) the
| named class. Returns 0 otherwise. This method works in
| combination with vtkTypeMacro found in vtkSetGet.h.
|
| IsEdge(...)
| IsEdge(self, p1:int, p2:int) -> int
| C++: int IsEdge(vtkIdType p1, vtkIdType p2)
|
| Determine whether two points form an edge. If they do, return
| non-zero. By definition PolyVertex and PolyLine have no edges
| since 1-dimensional edges are only found on cells 2D and higher.
| Edges are defined as 1-D boundary entities to cells. Make sure
| BuildLinks() has been called first.
|
| IsPointUsedByCell(...)
| IsPointUsedByCell(self, ptId:int, cellId:int) -> int
| C++: int IsPointUsedByCell(vtkIdType ptId, vtkIdType cellId)
|
| Determine whether a point is used by a particular cell. If it is,
| return non-zero. Make sure BuildCells() has been called first.
|
| IsTriangle(...)
| IsTriangle(self, v1:int, v2:int, v3:int) -> int
| C++: int IsTriangle(int v1, int v2, int v3)
|
| Given three vertices, determine whether it's a triangle. Make
| sure BuildLinks() has been called first.
|
| IsTypeOf(...)
| IsTypeOf(type:str) -> int
| C++: static vtkTypeBool IsTypeOf(const char *type)
|
| Return 1 if this class type is the same type of (or a subclass
| of) the named class. Returns 0 otherwise. This method works in
| combination with vtkTypeMacro found in vtkSetGet.h.
|
| NeedToBuildCells(...)
| NeedToBuildCells(self) -> bool
| C++: bool NeedToBuildCells()
|
| Check if BuildCells is needed.
|
| NewInstance(...)
| NewInstance(self) -> vtkPolyData
| C++: vtkPolyData *NewInstance()
|
| RemoveCellReference(...)
| RemoveCellReference(self, cellId:int) -> None
| C++: void RemoveCellReference(vtkIdType cellId)
|
| Remove all references to cell in cell structure. This means the
| links from the cell's points to the cell are deleted. Memory is
| not reclaimed. Use the method ResizeCellList() to resize the link
| list from a point to its using cells. (This operator assumes
| BuildLinks() has been called.) Use this method only when the
| dataset is set as Editable.
|
| RemoveDeletedCells(...)
| RemoveDeletedCells(self) -> None
| C++: void RemoveDeletedCells()
|
| The cells marked by calls to DeleteCell are stored in the Cell
| Array VTK_EMPTY_CELL, but they still exist in the cell arrays.
| Calling RemoveDeletedCells will traverse the cell arrays and
| remove/compact the cell arrays as well as any cell data thus
| truly removing the cells from the polydata object. Use this
| method only when the dataset is set as Editable.
|
| RemoveGhostCells(...)
| RemoveGhostCells(self) -> None
| C++: void RemoveGhostCells()
|
| This method will remove any cell that is marked as ghost (has the
| vtkDataSetAttributes::DUPLICATECELL or the
| vtkDataSetAttributes::HIDDENCELL bit set). It does not remove
| unused points.
|
| RemoveReferenceToCell(...)
| RemoveReferenceToCell(self, ptId:int, cellId:int) -> None
| C++: void RemoveReferenceToCell(vtkIdType ptId, vtkIdType cellId)
|
| Remove a reference to a cell in a particular point's link list.
| You may also consider using RemoveCellReference() to remove the
| references from all the cell's points to the cell. This operator
| does not reallocate memory; use the operator ResizeCellList() to
| do this if necessary. Use this method only when the dataset is
| set as Editable.
|
| ReplaceCell(...)
| ReplaceCell(self, cellId:int, ids:vtkIdList) -> None
| C++: void ReplaceCell(vtkIdType cellId, vtkIdList *ids)
| ReplaceCell(self, cellId:int, npts:int, pts:(int, ...)) -> None
| C++: void ReplaceCell(vtkIdType cellId, int npts,
| const vtkIdType pts[])
|
| ReplaceCellPoint(...)
| ReplaceCellPoint(self, cellId:int, oldPtId:int, newPtId:int)
| -> None
| C++: void ReplaceCellPoint(vtkIdType cellId, vtkIdType oldPtId,
| vtkIdType newPtId)
|
| Replace a point in the cell connectivity list with a different
| point. Use this method only when the dataset is set as Editable.
|
| ReplaceLinkedCell(...)
| ReplaceLinkedCell(self, cellId:int, npts:int, pts:(int, ...))
| -> None
| C++: void ReplaceLinkedCell(vtkIdType cellId, int npts,
| const vtkIdType pts[])
|
| Replace one cell with another in cell structure. This operator
| updates the connectivity list and the point's link list. It does
| not delete references to the old cell in the point's link list.
| Use the operator RemoveCellReference() to delete all references
| from points to (old) cell. You may also want to consider using
| the operator ResizeCellList() if the link list is changing size.
| Use this method only when the dataset is set as Editable.
|
| Reset(...)
| Reset(self) -> None
| C++: void Reset()
|
| Begin inserting data all over again. Memory is not freed but
| otherwise objects are returned to their initial state.
|
| ResizeCellList(...)
| ResizeCellList(self, ptId:int, size:int) -> None
| C++: void ResizeCellList(vtkIdType ptId, int size)
|
| Resize the list of cells using a particular point. (This operator
| assumes that BuildLinks() has been called.) Use this method only
| when the dataset is set as Editable.
|
| ReverseCell(...)
| ReverseCell(self, cellId:int) -> None
| C++: void ReverseCell(vtkIdType cellId)
|
| Reverse the order of point ids defining the cell. Use this method
| only when the dataset is set as Editable.
|
| SafeDownCast(...)
| SafeDownCast(o:vtkObjectBase) -> vtkPolyData
| C++: static vtkPolyData *SafeDownCast(vtkObjectBase *o)
|
| SetLines(...)
| SetLines(self, l:vtkCellArray) -> None
| C++: void SetLines(vtkCellArray *l)
|
| Set the cell array defining lines.
|
| SetLinks(...)
| SetLinks(self, links:vtkAbstractCellLinks) -> None
| C++: virtual void SetLinks(vtkAbstractCellLinks *links)
|
| Set/Get the links that you created possibly without using
| BuildLinks.
|
| Note: Only vtkCellLinks are currently supported.
|
| SetPolys(...)
| SetPolys(self, p:vtkCellArray) -> None
| C++: void SetPolys(vtkCellArray *p)
|
| Set the cell array defining polygons.
|
| SetStrips(...)
| SetStrips(self, s:vtkCellArray) -> None
| C++: void SetStrips(vtkCellArray *s)
|
| Set the cell array defining triangle strips.
|
| SetVerts(...)
| SetVerts(self, v:vtkCellArray) -> None
| C++: void SetVerts(vtkCellArray *v)
|
| Set the cell array defining vertices.
|
| ShallowCopy(...)
| ShallowCopy(self, src:vtkDataObject) -> None
| C++: void ShallowCopy(vtkDataObject *src) override;
|
| Shallow and Deep copy.
|
| Squeeze(...)
| Squeeze(self) -> None
| C++: void Squeeze() override;
|
| Recover extra allocated memory when creating data whose initial
| size is unknown. Examples include using the InsertNextCell()
| method, or when using the CellArray::EstimateSize() method to
| create vertices, lines, polygons, or triangle strips.
|
| __delattr__(self, name, /)
| Implement delattr(self, name).
|
| __getattribute__(self, name, /)
| Return getattr(self, name).
|
| __setattr__(self, name, value, /)
| Implement setattr(self, name, value).
|
| ----------------------------------------------------------------------
| Static methods inherited from vtkmodules.vtkCommonDataModel.vtkPolyData:
|
| __new__(*args, **kwargs) from builtins.type
| Create and return a new object. See help(type) for accurate signature.
|
| ----------------------------------------------------------------------
| Data descriptors inherited from vtkmodules.vtkCommonDataModel.vtkPolyData:
|
| __dict__
| Dictionary of attributes set by user.
|
| __this__
| Pointer to the C++ object.
|
| ----------------------------------------------------------------------
| Data and other attributes inherited from vtkmodules.vtkCommonDataModel.vtkPolyData:
|
| ERR_INCORRECT_FIELD = -3
|
| ERR_NON_MANIFOLD_STAR = -2
|
| ERR_NO_SUCH_FIELD = -4
|
| MAXIMUM = 2
|
| MINIMUM = 0
|
| REGULAR_POINT = -1
|
| SADDLE = 1
|
| __vtkname__ = 'vtkPolyData'
|
| ----------------------------------------------------------------------
| Methods inherited from vtkmodules.vtkCommonDataModel.vtkPointSet:
|
| BuildCellLocator(...)
| BuildCellLocator(self) -> None
| C++: void BuildCellLocator()
|
| Build the cell locator. In a multi-threaded environment, call
| this method in a single thread before using FindCell().
|
| BuildLocator(...)
| BuildLocator(self) -> None
| C++: void BuildLocator()
|
| BuildPointLocator(...)
| BuildPointLocator(self) -> None
| C++: void BuildPointLocator()
|
| Build the internal point locator . In a multi-threaded
| environment, call this method in a single thread before using
| FindCell() or FindPoint().
|
| ComputeBounds(...)
| ComputeBounds(self) -> None
| C++: void ComputeBounds() override;
|
| Compute the (X, Y, Z) bounds of the data.
|
| EditableOff(...)
| EditableOff(self) -> None
| C++: virtual void EditableOff()
|
| EditableOn(...)
| EditableOn(self) -> None
| C++: virtual void EditableOn()
|
| FindCell(...)
| FindCell(self, x:[float, float, float], cell:vtkCell, cellId:int,
| tol2:float, subId:int, pcoords:[float, float, float],
| weights:[float, ...]) -> int
| C++: vtkIdType FindCell(double x[3], vtkCell *cell,
| vtkIdType cellId, double tol2, int &subId, double pcoords[3],
| double *weights) override;
| FindCell(self, x:[float, float, float], cell:vtkCell,
| gencell:vtkGenericCell, cellId:int, tol2:float, subId:int,
| pcoords:[float, float, float], weights:[float, ...]) -> int
| C++: vtkIdType FindCell(double x[3], vtkCell *cell,
| vtkGenericCell *gencell, vtkIdType cellId, double tol2,
| int &subId, double pcoords[3], double *weights) override;
|
| Locate cell based on global coordinate x and tolerance squared.
| If cell and cellId is non-nullptr, then search starts from this
| cell and looks at immediate neighbors. Returns cellId >= 0 if
| inside, < 0 otherwise. The parametric coordinates are provided
| in pcoords[3]. The interpolation weights are returned in
| weights[]. (The number of weights is equal to the number of
| points in the found cell). Tolerance is used to control how close
| the point is to be considered "in" the cell. THIS METHOD IS NOT
| THREAD SAFE.
|
| FindPoint(...)
| FindPoint(self, x:[float, float, float]) -> int
| C++: vtkIdType FindPoint(double x[3]) override;
| FindPoint(self, x:float, y:float, z:float) -> int
| C++: vtkIdType FindPoint(double x, double y, double z)
|
| GetCellLocator(...)
| GetCellLocator(self) -> vtkAbstractCellLocator
| C++: virtual vtkAbstractCellLocator *GetCellLocator()
|
| GetEditable(...)
| GetEditable(self) -> bool
| C++: virtual bool GetEditable()
|
| GetNumberOfPoints(...)
| GetNumberOfPoints(self) -> int
| C++: vtkIdType GetNumberOfPoints() override;
|
| See vtkDataSet for additional information.
|
| GetPoint(...)
| GetPoint(self, ptId:int, x:[float, float, float]) -> None
| C++: void GetPoint(vtkIdType ptId, double x[3]) override;
| GetPoint(self, ptId:int) -> (float, float, float)
| C++: double *GetPoint(vtkIdType ptId) override;
|
| Copy point coordinates into user provided array x[3] for
| specified point id. THIS METHOD IS THREAD SAFE IF FIRST CALLED
| FROM A SINGLE THREAD AND THE DATASET IS NOT MODIFIED
|
| GetPointLocator(...)
| GetPointLocator(self) -> vtkAbstractPointLocator
| C++: virtual vtkAbstractPointLocator *GetPointLocator()
|
| GetPoints(...)
| GetPoints(self) -> vtkPoints
| C++: virtual vtkPoints *GetPoints()
|
| NewCellIterator(...)
| NewCellIterator(self) -> vtkCellIterator
| C++: vtkCellIterator *NewCellIterator() override;
|
| Return an iterator that traverses the cells in this data set.
|
| SetCellLocator(...)
| SetCellLocator(self, __a:vtkAbstractCellLocator) -> None
| C++: virtual void SetCellLocator(vtkAbstractCellLocator *)
|
| Set / get an instance of vtkAbstractCellLocator which may be used
| when a vtkCellLocatorStrategy is used during a FindCell()
| operation.
|
| SetEditable(...)
| SetEditable(self, _arg:bool) -> None
| C++: virtual void SetEditable(bool _arg)
|
| Specify whether this dataset is editable after creation. Meaning,
| once the points and cells are defined, can the dataset be
| incrementally modified. By default, this dataset is non-editable
| (i.e., "static") after construction. The reason for this is
| performance: cell links and locators can be built (and destroyed)
| much faster is it is known that the data is static (see
| vtkStaticCellLinks, vtkStaticPointLocator, vtkStaticCellLocator).
|
| SetPointLocator(...)
| SetPointLocator(self, __a:vtkAbstractPointLocator) -> None
| C++: virtual void SetPointLocator(vtkAbstractPointLocator *)
|
| Set / get an instance of vtkAbstractPointLocator which is used to
| support the FindPoint() and FindCell() methods. By default a
| vtkStaticPointLocator is used, unless the class is set as
| Editable, in which case a vtkPointLocator is used.
|
| SetPoints(...)
| SetPoints(self, __a:vtkPoints) -> None
| C++: virtual void SetPoints(vtkPoints *)
|
| Specify point array to define point coordinates.
|
| UsesGarbageCollector(...)
| UsesGarbageCollector(self) -> bool
| C++: bool UsesGarbageCollector() override;
|
| Overwritten to handle the data/locator loop
|
| ----------------------------------------------------------------------
| Methods inherited from vtkmodules.vtkCommonDataModel.vtkDataSet:
|
| AllocateCellGhostArray(...)
| AllocateCellGhostArray(self) -> vtkUnsignedCharArray
| C++: vtkUnsignedCharArray *AllocateCellGhostArray()
|
| Allocate ghost array for cells.
|
| AllocatePointGhostArray(...)
| AllocatePointGhostArray(self) -> vtkUnsignedCharArray
| C++: vtkUnsignedCharArray *AllocatePointGhostArray()
|
| Allocate ghost array for points.
|
| CheckAttributes(...)
| CheckAttributes(self) -> int
| C++: int CheckAttributes()
|
| This method checks to see if the cell and point attributes match
| the geometry. Many filters will crash if the number of tuples in
| an array is less than the number of points/cells. This method
| returns 1 if there is a mismatch, and 0 if everything is ok. It
| prints an error if an array is too short, and a warning if an
| array is too long.
|
| CopyAttributes(...)
| CopyAttributes(self, ds:vtkDataSet) -> None
| C++: virtual void CopyAttributes(vtkDataSet *ds)
|
| Copy the attributes associated with the specified dataset to this
| instance of vtkDataSet. THIS METHOD IS NOT THREAD SAFE.
|
| FindAndGetCell(...)
| FindAndGetCell(self, x:[float, float, float], cell:vtkCell,
| cellId:int, tol2:float, subId:int, pcoords:[float, float,
| float], weights:[float, ...]) -> vtkCell
| C++: virtual vtkCell *FindAndGetCell(double x[3], vtkCell *cell,
| vtkIdType cellId, double tol2, int &subId, double pcoords[3],
| double *weights)
|
| Locate the cell that contains a point and return the cell. Also
| returns the subcell id, parametric coordinates and weights for
| subsequent interpolation. This method combines the derived class
| methods int FindCell and vtkCell *GetCell. Derived classes may
| provide a more efficient implementation. See for example
| vtkStructuredPoints. THIS METHOD IS NOT THREAD SAFE.
|
| GenerateGhostArray(...)
| GenerateGhostArray(self, zeroExt:[int, int, int, int, int, int])
| -> None
| C++: virtual void GenerateGhostArray(int zeroExt[6])
| GenerateGhostArray(self, zeroExt:[int, int, int, int, int, int],
| cellOnly:bool) -> None
| C++: virtual void GenerateGhostArray(int zeroExt[6],
| bool cellOnly)
|
| Normally called by pipeline executives or algorithms only. This
| method computes the ghost arrays for a given dataset. The zeroExt
| argument specifies the extent of the region which ghost type = 0.
|
| GetAttributesAsFieldData(...)
| GetAttributesAsFieldData(self, type:int) -> vtkFieldData
| C++: vtkFieldData *GetAttributesAsFieldData(int type) override;
|
| Returns the attributes of the data object as a vtkFieldData. This
| returns non-null values in all the same cases as GetAttributes,
| in addition to the case of FIELD, which will return the field
| data for any vtkDataObject subclass.
|
| GetBounds(...)
| GetBounds(self) -> (float, float, float, float, float, float)
| C++: double *GetBounds()
| GetBounds(self, bounds:[float, float, float, float, float, float])
| -> None
| C++: void GetBounds(double bounds[6])
|
| Return a pointer to the geometry bounding box in the form
| (xmin,xmax, ymin,ymax, zmin,zmax). THIS METHOD IS NOT THREAD
| SAFE.
|
| GetCellData(...)
| GetCellData(self) -> vtkCellData
| C++: vtkCellData *GetCellData()
|
| Return a pointer to this dataset's cell data. THIS METHOD IS
| THREAD SAFE
|
| GetCellGhostArray(...)
| GetCellGhostArray(self) -> vtkUnsignedCharArray
| C++: vtkUnsignedCharArray *GetCellGhostArray()
|
| Get the array that defines the ghost type of each cell. We cache
| the pointer to the array to save a lookup involving string
| comparisons
|
| GetCellTypes(...)
| GetCellTypes(self, types:vtkCellTypes) -> None
| C++: virtual void GetCellTypes(vtkCellTypes *types)
|
| Get a list of types of cells in a dataset. The list consists of
| an array of types (not necessarily in any order), with a single
| entry per type. For example a dataset 5 triangles, 3 lines, and
| 100 hexahedra would result a list of three entries, corresponding
| to the types VTK_TRIANGLE, VTK_LINE, and VTK_HEXAHEDRON. THIS
| METHOD IS THREAD SAFE IF FIRST CALLED FROM A SINGLE THREAD AND
| THE DATASET IS NOT MODIFIED
|
| GetCenter(...)
| GetCenter(self) -> (float, float, float)
| C++: double *GetCenter()
| GetCenter(self, center:[float, float, float]) -> None
| C++: void GetCenter(double center[3])
|
| Get the center of the bounding box. THIS METHOD IS NOT THREAD
| SAFE.
|
| GetGhostArray(...)
| GetGhostArray(self, type:int) -> vtkUnsignedCharArray
| C++: vtkUnsignedCharArray *GetGhostArray(int type) override;
|
| Returns the ghost array for the given type (point or cell). Takes
| advantage of the cache with the pointer to the array to save a
| string comparison.
|
| GetLength(...)
| GetLength(self) -> float
| C++: double GetLength()
|
| Return the length of the diagonal of the bounding box. THIS
| METHOD IS THREAD SAFE IF FIRST CALLED FROM A SINGLE THREAD AND
| THE DATASET IS NOT MODIFIED
|
| GetLength2(...)
| GetLength2(self) -> float
| C++: double GetLength2()
|
| Return the squared length of the diagonal of the bounding box.
| THIS METHOD IS THREAD SAFE IF FIRST CALLED FROM A SINGLE THREAD
| AND THE DATASET IS NOT MODIFIED
|
| GetNumberOfElements(...)
| GetNumberOfElements(self, type:int) -> int
| C++: vtkIdType GetNumberOfElements(int type) override;
|
| Get the number of elements for a specific attribute type (POINT,
| CELL, etc.).
|
| GetPointData(...)
| GetPointData(self) -> vtkPointData
| C++: vtkPointData *GetPointData()
|
| Return a pointer to this dataset's point data. THIS METHOD IS
| THREAD SAFE
|
| GetPointGhostArray(...)
| GetPointGhostArray(self) -> vtkUnsignedCharArray
| C++: vtkUnsignedCharArray *GetPointGhostArray()
|
| Gets the array that defines the ghost type of each point. We
| cache the pointer to the array to save a lookup involving string
| comparisons
|
| GetScalarRange(...)
| GetScalarRange(self, range:[float, float]) -> None
| C++: virtual void GetScalarRange(double range[2])
| GetScalarRange(self) -> (float, float)
| C++: double *GetScalarRange()
|
| Convenience method to get the range of the first component (and
| only the first component) of any scalars in the data set. If the
| data has both point data and cell data, it returns the (min/max)
| range of combined point and cell data. If there are no point or
| cell scalars the method will return (0,1). Note: It might be
| necessary to call Update to create or refresh the scalars before
| calling this method. THIS METHOD IS THREAD SAFE IF FIRST CALLED
| FROM A SINGLE THREAD AND THE DATASET IS NOT MODIFIED
|
| HasAnyBlankCells(...)
| HasAnyBlankCells(self) -> bool
| C++: virtual bool HasAnyBlankCells()
|
| Returns 1 if there are any blanking cells 0 otherwise. Blanking
| is supported only for vtkStructuredGrid and vtkUniformGrid
|
| HasAnyBlankPoints(...)
| HasAnyBlankPoints(self) -> bool
| C++: virtual bool HasAnyBlankPoints()
|
| Returns 1 if there are any blanking points 0 otherwise. Blanking
| is supported only for vtkStructuredGrid and vtkUniformGrid
|
| HasAnyGhostCells(...)
| HasAnyGhostCells(self) -> bool
| C++: bool HasAnyGhostCells()
|
| Returns 1 if there are any ghost cells 0 otherwise.
|
| HasAnyGhostPoints(...)
| HasAnyGhostPoints(self) -> bool
| C++: bool HasAnyGhostPoints()
|
| Returns 1 if there are any ghost points 0 otherwise.
|
| SetCellOrderAndRationalWeights(...)
| SetCellOrderAndRationalWeights(self, cellId:int,
| cell:vtkGenericCell) -> None
| C++: void SetCellOrderAndRationalWeights(vtkIdType cellId,
| vtkGenericCell *cell)
|
| UpdateCellGhostArrayCache(...)
| UpdateCellGhostArrayCache(self) -> None
| C++: void UpdateCellGhostArrayCache()
|
| Updates the pointer to the cell ghost array.
|
| UpdatePointGhostArrayCache(...)
| UpdatePointGhostArrayCache(self) -> None
| C++: void UpdatePointGhostArrayCache()
|
| Updates the pointer to the point ghost array.
|
| ----------------------------------------------------------------------
| Data and other attributes inherited from vtkmodules.vtkCommonDataModel.vtkDataSet:
|
| CELL_DATA_FIELD = 2
|
| DATA_OBJECT_FIELD = 0
|
| FieldDataType = <class 'vtkmodules.vtkCommonDataModel.vtkDataSet.Field...
|
| POINT_DATA_FIELD = 1
|
| ----------------------------------------------------------------------
| Methods inherited from vtkmodules.vtkCommonDataModel.vtkDataObject:
|
| ALL_PIECES_EXTENT(...)
| ALL_PIECES_EXTENT() -> vtkInformationIntegerVectorKey
| C++: static vtkInformationIntegerVectorKey *ALL_PIECES_EXTENT()
|
| BOUNDING_BOX(...)
| BOUNDING_BOX() -> vtkInformationDoubleVectorKey
| C++: static vtkInformationDoubleVectorKey *BOUNDING_BOX()
|
| CELL_DATA_VECTOR(...)
| CELL_DATA_VECTOR() -> vtkInformationInformationVectorKey
| C++: static vtkInformationInformationVectorKey *CELL_DATA_VECTOR()
|
| CopyInformationFromPipeline(...)
| CopyInformationFromPipeline(self, info:vtkInformation) -> None
| C++: virtual void CopyInformationFromPipeline(
| vtkInformation *info)
|
| Copy from the pipeline information to the data object's own
| information. Called right before the main execution pass.
|
| CopyInformationToPipeline(...)
| CopyInformationToPipeline(self, info:vtkInformation) -> None
| C++: virtual void CopyInformationToPipeline(vtkInformation *info)
|
| Copy information from this data object to the pipeline
| information. This is used by the vtkTrivialProducer that is
| created when someone calls SetInputData() to connect a data
| object to a pipeline.
|
| Crop(...)
| Crop(self, updateExtent:(int, ...)) -> None
| C++: virtual void Crop(const int *updateExtent)
|
| This method crops the data object (if necessary) so that the
| extent matches the update extent.
|
| DATA_EXTENT(...)
| DATA_EXTENT() -> vtkInformationIntegerPointerKey
| C++: static vtkInformationIntegerPointerKey *DATA_EXTENT()
|
| DATA_EXTENT_TYPE(...)
| DATA_EXTENT_TYPE() -> vtkInformationIntegerKey
| C++: static vtkInformationIntegerKey *DATA_EXTENT_TYPE()
|
| DATA_NUMBER_OF_GHOST_LEVELS(...)
| DATA_NUMBER_OF_GHOST_LEVELS() -> vtkInformationIntegerKey
| C++: static vtkInformationIntegerKey *DATA_NUMBER_OF_GHOST_LEVELS(
| )
|
| DATA_NUMBER_OF_PIECES(...)
| DATA_NUMBER_OF_PIECES() -> vtkInformationIntegerKey
| C++: static vtkInformationIntegerKey *DATA_NUMBER_OF_PIECES()
|
| DATA_OBJECT(...)
| DATA_OBJECT() -> vtkInformationDataObjectKey
| C++: static vtkInformationDataObjectKey *DATA_OBJECT()
|
| DATA_PIECE_NUMBER(...)
| DATA_PIECE_NUMBER() -> vtkInformationIntegerKey
| C++: static vtkInformationIntegerKey *DATA_PIECE_NUMBER()
|
| DATA_TIME_STEP(...)
| DATA_TIME_STEP() -> vtkInformationDoubleKey
| C++: static vtkInformationDoubleKey *DATA_TIME_STEP()
|
| DATA_TYPE_NAME(...)
| DATA_TYPE_NAME() -> vtkInformationStringKey
| C++: static vtkInformationStringKey *DATA_TYPE_NAME()
|
| DIRECTION(...)
| DIRECTION() -> vtkInformationDoubleVectorKey
| C++: static vtkInformationDoubleVectorKey *DIRECTION()
|
| DataHasBeenGenerated(...)
| DataHasBeenGenerated(self) -> None
| C++: void DataHasBeenGenerated()
|
| This method is called by the source when it executes to generate
| data. It is sort of the opposite of ReleaseData. It sets the
| DataReleased flag to 0, and sets a new UpdateTime.
|
| EDGE_DATA_VECTOR(...)
| EDGE_DATA_VECTOR() -> vtkInformationInformationVectorKey
| C++: static vtkInformationInformationVectorKey *EDGE_DATA_VECTOR()
|
| FIELD_ACTIVE_ATTRIBUTE(...)
| FIELD_ACTIVE_ATTRIBUTE() -> vtkInformationIntegerKey
| C++: static vtkInformationIntegerKey *FIELD_ACTIVE_ATTRIBUTE()
|
| FIELD_ARRAY_TYPE(...)
| FIELD_ARRAY_TYPE() -> vtkInformationIntegerKey
| C++: static vtkInformationIntegerKey *FIELD_ARRAY_TYPE()
|
| FIELD_ASSOCIATION(...)
| FIELD_ASSOCIATION() -> vtkInformationIntegerKey
| C++: static vtkInformationIntegerKey *FIELD_ASSOCIATION()
|
| FIELD_ATTRIBUTE_TYPE(...)
| FIELD_ATTRIBUTE_TYPE() -> vtkInformationIntegerKey
| C++: static vtkInformationIntegerKey *FIELD_ATTRIBUTE_TYPE()
|
| FIELD_NAME(...)
| FIELD_NAME() -> vtkInformationStringKey
| C++: static vtkInformationStringKey *FIELD_NAME()
|
| FIELD_NUMBER_OF_COMPONENTS(...)
| FIELD_NUMBER_OF_COMPONENTS() -> vtkInformationIntegerKey
| C++: static vtkInformationIntegerKey *FIELD_NUMBER_OF_COMPONENTS()
|
| FIELD_NUMBER_OF_TUPLES(...)
| FIELD_NUMBER_OF_TUPLES() -> vtkInformationIntegerKey
| C++: static vtkInformationIntegerKey *FIELD_NUMBER_OF_TUPLES()
|
| FIELD_OPERATION(...)
| FIELD_OPERATION() -> vtkInformationIntegerKey
| C++: static vtkInformationIntegerKey *FIELD_OPERATION()
|
| FIELD_RANGE(...)
| FIELD_RANGE() -> vtkInformationDoubleVectorKey
| C++: static vtkInformationDoubleVectorKey *FIELD_RANGE()
|
| GetActiveFieldInformation(...)
| GetActiveFieldInformation(info:vtkInformation,
| fieldAssociation:int, attributeType:int) -> vtkInformation
| C++: static vtkInformation *GetActiveFieldInformation(
| vtkInformation *info, int fieldAssociation, int attributeType)
|
| Return the information object within the input information
| object's field data corresponding to the specified association
| (FIELD_ASSOCIATION_POINTS or FIELD_ASSOCIATION_CELLS) and
| attribute (SCALARS, VECTORS, NORMALS, TCOORDS, or TENSORS)
|
| GetAssociationTypeAsString(...)
| GetAssociationTypeAsString(associationType:int) -> str
| C++: static const char *GetAssociationTypeAsString(
| int associationType)
|
| Given an integer association type, this static method returns a
| string type for the attribute (i.e. associationType = 0: returns
| "Points").
|
| GetAssociationTypeFromString(...)
| GetAssociationTypeFromString(associationName:str) -> int
| C++: static int GetAssociationTypeFromString(
| const char *associationName)
|
| Given a string association name, this static method returns an
| integer association type for the attribute (i.e. associationName
| = "Points": returns 0).
|
| GetAttributeTypeForArray(...)
| GetAttributeTypeForArray(self, arr:vtkAbstractArray) -> int
| C++: virtual int GetAttributeTypeForArray(vtkAbstractArray *arr)
|
| Retrieves the attribute type that an array came from. This is
| useful for obtaining which attribute type a input array to an
| algorithm came from (retrieved from
| GetInputAbstractArrayToProcesss).
|
| GetAttributes(...)
| GetAttributes(self, type:int) -> vtkDataSetAttributes
| C++: virtual vtkDataSetAttributes *GetAttributes(int type)
|
| Returns the attributes of the data object of the specified
| attribute type. The type may be: POINT - Defined in vtkDataSet
| subclasses. CELL - Defined in vtkDataSet subclasses. VERTEX -
| Defined in vtkGraph subclasses. EDGE - Defined in vtkGraph
| subclasses. ROW - Defined in vtkTable. The other attribute
| type, FIELD, will return nullptr since field data is stored as a
| vtkFieldData instance, not a vtkDataSetAttributes instance. To
| retrieve field data, use GetAttributesAsFieldData.
|
| @warning This method NEEDS to be
| overridden in subclasses to work as documented. If not, it
| returns nullptr for any type but FIELD.
|
| GetDataReleased(...)
| GetDataReleased(self) -> int
| C++: virtual int GetDataReleased()
|
| Get the flag indicating the data has been released.
|
| GetExtentType(...)
| GetExtentType(self) -> int
| C++: virtual int GetExtentType()
|
| The ExtentType will be left as VTK_PIECES_EXTENT for data objects
| such as vtkPolyData and vtkUnstructuredGrid. The ExtentType will
| be changed to VTK_3D_EXTENT for data objects with 3D structure
| such as vtkImageData (and its subclass vtkStructuredPoints),
| vtkRectilinearGrid, and vtkStructuredGrid. The default is the
| have an extent in pieces, with only one piece (no streaming
| possible).
|
| GetFieldData(...)
| GetFieldData(self) -> vtkFieldData
| C++: virtual vtkFieldData *GetFieldData()
|
| GetGlobalReleaseDataFlag(...)
| GetGlobalReleaseDataFlag() -> int
| C++: static int GetGlobalReleaseDataFlag()
|
| GetInformation(...)
| GetInformation(self) -> vtkInformation
| C++: virtual vtkInformation *GetInformation()
|
| Set/Get the information object associated with this data object.
|
| GetNamedFieldInformation(...)
| GetNamedFieldInformation(info:vtkInformation,
| fieldAssociation:int, name:str) -> vtkInformation
| C++: static vtkInformation *GetNamedFieldInformation(
| vtkInformation *info, int fieldAssociation, const char *name)
|
| Return the information object within the input information
| object's field data corresponding to the specified association
| (FIELD_ASSOCIATION_POINTS or FIELD_ASSOCIATION_CELLS) and name.
|
| GetUpdateTime(...)
| GetUpdateTime(self) -> int
| C++: vtkMTimeType GetUpdateTime()
|
| Used by Threaded ports to determine if they should initiate an
| asynchronous update (still in development).
|
| GlobalReleaseDataFlagOff(...)
| GlobalReleaseDataFlagOff(self) -> None
| C++: void GlobalReleaseDataFlagOff()
|
| GlobalReleaseDataFlagOn(...)
| GlobalReleaseDataFlagOn(self) -> None
| C++: void GlobalReleaseDataFlagOn()
|
| ORIGIN(...)
| ORIGIN() -> vtkInformationDoubleVectorKey
| C++: static vtkInformationDoubleVectorKey *ORIGIN()
|
| PIECE_EXTENT(...)
| PIECE_EXTENT() -> vtkInformationIntegerVectorKey
| C++: static vtkInformationIntegerVectorKey *PIECE_EXTENT()
|
| POINT_DATA_VECTOR(...)
| POINT_DATA_VECTOR() -> vtkInformationInformationVectorKey
| C++: static vtkInformationInformationVectorKey *POINT_DATA_VECTOR(
| )
|
| PrepareForNewData(...)
| PrepareForNewData(self) -> None
| C++: virtual void PrepareForNewData()
|
| make the output data ready for new data to be inserted. For most
| objects we just call Initialize. But for vtkImageData we leave
| the old data in case the memory can be reused.
|
| ReleaseData(...)
| ReleaseData(self) -> None
| C++: void ReleaseData()
|
| Release data back to system to conserve memory resource. Used
| during visualization network execution. Releasing this data does
| not make down-stream data invalid.
|
| RemoveNamedFieldInformation(...)
| RemoveNamedFieldInformation(info:vtkInformation,
| fieldAssociation:int, name:str) -> None
| C++: static void RemoveNamedFieldInformation(vtkInformation *info,
| int fieldAssociation, const char *name)
|
| Remove the info associated with an array
|
| SIL(...)
| SIL() -> vtkInformationDataObjectKey
| C++: static vtkInformationDataObjectKey *SIL()
|
| SPACING(...)
| SPACING() -> vtkInformationDoubleVectorKey
| C++: static vtkInformationDoubleVectorKey *SPACING()
|
| SetActiveAttribute(...)
| SetActiveAttribute(info:vtkInformation, fieldAssociation:int,
| attributeName:str, attributeType:int) -> vtkInformation
| C++: static vtkInformation *SetActiveAttribute(
| vtkInformation *info, int fieldAssociation,
| const char *attributeName, int attributeType)
|
| Set the named array to be the active field for the specified type
| (SCALARS, VECTORS, NORMALS, TCOORDS, or TENSORS) and association
| (FIELD_ASSOCIATION_POINTS or FIELD_ASSOCIATION_CELLS). Returns
| the active field information object and creates on entry if one
| not found.
|
| SetActiveAttributeInfo(...)
| SetActiveAttributeInfo(info:vtkInformation, fieldAssociation:int,
| attributeType:int, name:str, arrayType:int, numComponents:int,
| numTuples:int) -> None
| C++: static void SetActiveAttributeInfo(vtkInformation *info,
| int fieldAssociation, int attributeType, const char *name,
| int arrayType, int numComponents, int numTuples)
|
| Set the name, array type, number of components, and number of
| tuples within the passed information object for the active
| attribute of type attributeType (in specified association,
| FIELD_ASSOCIATION_POINTS or FIELD_ASSOCIATION_CELLS). If there
| is not an active attribute of the specified type, an entry in the
| information object is created. If arrayType, numComponents, or
| numTuples equal to -1, or name=nullptr the value is not changed.
|
| SetFieldData(...)
| SetFieldData(self, __a:vtkFieldData) -> None
| C++: virtual void SetFieldData(vtkFieldData *)
|
| Assign or retrieve a general field data to this data object.
|
| SetGlobalReleaseDataFlag(...)
| SetGlobalReleaseDataFlag(val:int) -> None
| C++: static void SetGlobalReleaseDataFlag(int val)
|
| Turn on/off flag to control whether every object releases its
| data after being used by a filter.
|
| SetInformation(...)
| SetInformation(self, __a:vtkInformation) -> None
| C++: virtual void SetInformation(vtkInformation *)
|
| SetPointDataActiveScalarInfo(...)
| SetPointDataActiveScalarInfo(info:vtkInformation, arrayType:int,
| numComponents:int) -> None
| C++: static void SetPointDataActiveScalarInfo(
| vtkInformation *info, int arrayType, int numComponents)
|
| Convenience version of previous method for use (primarily) by the
| Imaging filters. If arrayType or numComponents == -1, the value
| is not changed.
|
| VERTEX_DATA_VECTOR(...)
| VERTEX_DATA_VECTOR() -> vtkInformationInformationVectorKey
| C++: static vtkInformationInformationVectorKey *VERTEX_DATA_VECTOR(
| )
|
| ----------------------------------------------------------------------
| Data and other attributes inherited from vtkmodules.vtkCommonDataModel.vtkDataObject:
|
| AttributeTypes = <class 'vtkmodules.vtkCommonDataModel.vtkDataObject.A...
|
| CELL = 1
|
| EDGE = 5
|
| FIELD = 2
|
| FIELD_ASSOCIATION_CELLS = 1
|
| FIELD_ASSOCIATION_EDGES = 5
|
| FIELD_ASSOCIATION_NONE = 2
|
| FIELD_ASSOCIATION_POINTS = 0
|
| FIELD_ASSOCIATION_POINTS_THEN_CELLS = 3
|
| FIELD_ASSOCIATION_ROWS = 6
|
| FIELD_ASSOCIATION_VERTICES = 4
|
| FIELD_OPERATION_MODIFIED = 2
|
| FIELD_OPERATION_PRESERVED = 0
|
| FIELD_OPERATION_REINTERPOLATED = 1
|
| FIELD_OPERATION_REMOVED = 3
|
| FieldAssociations = <class 'vtkmodules.vtkCommonDataModel.vtkDataObjec...
|
| FieldOperations = <class 'vtkmodules.vtkCommonDataModel.vtkDataObject....
|
| NUMBER_OF_ASSOCIATIONS = 7
|
| NUMBER_OF_ATTRIBUTE_TYPES = 7
|
| POINT = 0
|
| POINT_THEN_CELL = 3
|
| ROW = 6
|
| VERTEX = 4
|
| ----------------------------------------------------------------------
| Methods inherited from vtkmodules.vtkCommonCore.vtkObject:
|
| AddObserver(...)
| AddObserver(self, event:int, command:Callback, priority:float=0.0) -> int
| C++: unsigned long AddObserver(const char* event,
| vtkCommand* command, float priority=0.0f)
|
| Add an event callback command(o:vtkObject, event:int) for an event type.
| Returns a handle that can be used with RemoveEvent(event:int).
|
| BreakOnError(...)
| BreakOnError() -> None
| C++: static void BreakOnError()
|
| This method is called when vtkErrorMacro executes. It allows the
| debugger to break on error.
|
| DebugOff(...)
| DebugOff(self) -> None
| C++: virtual void DebugOff()
|
| Turn debugging output off.
|
| DebugOn(...)
| DebugOn(self) -> None
| C++: virtual void DebugOn()
|
| Turn debugging output on.
|
| GetCommand(...)
| GetCommand(self, tag:int) -> vtkCommand
| C++: vtkCommand *GetCommand(unsigned long tag)
|
| GetDebug(...)
| GetDebug(self) -> bool
| C++: bool GetDebug()
|
| Get the value of the debug flag.
|
| GetGlobalWarningDisplay(...)
| GetGlobalWarningDisplay() -> int
| C++: static int GetGlobalWarningDisplay()
|
| GetObjectDescription(...)
| GetObjectDescription(self) -> str
| C++: std::string GetObjectDescription() override;
|
| The object description printed in messages and PrintSelf output.
| To be used only for reporting purposes.
|
| GetObjectName(...)
| GetObjectName(self) -> str
| C++: virtual std::string GetObjectName()
|
| GlobalWarningDisplayOff(...)
| GlobalWarningDisplayOff() -> None
| C++: static void GlobalWarningDisplayOff()
|
| GlobalWarningDisplayOn(...)
| GlobalWarningDisplayOn() -> None
| C++: static void GlobalWarningDisplayOn()
|
| HasObserver(...)
| HasObserver(self, event:int, __b:vtkCommand) -> int
| C++: vtkTypeBool HasObserver(unsigned long event, vtkCommand *)
| HasObserver(self, event:str, __b:vtkCommand) -> int
| C++: vtkTypeBool HasObserver(const char *event, vtkCommand *)
| HasObserver(self, event:int) -> int
| C++: vtkTypeBool HasObserver(unsigned long event)
| HasObserver(self, event:str) -> int
| C++: vtkTypeBool HasObserver(const char *event)
|
| InvokeEvent(...)
| InvokeEvent(self, event:int, callData:Any) -> int
| C++: int InvokeEvent(unsigned long event, void* callData)
| InvokeEvent(self, event:str, callData:Any) -> int
| C++: int InvokeEvent(const char* event, void* callData)
| InvokeEvent(self, event:int) -> int
| C++: int InvokeEvent(unsigned long event)
| InvokeEvent(self, event:str) -> int
| C++: int InvokeEvent(const char* event)
|
| This method invokes an event and returns whether the event was
| aborted or not. If the event was aborted, the return value is 1,
| otherwise it is 0.
|
| Modified(...)
| Modified(self) -> None
| C++: virtual void Modified()
|
| Update the modification time for this object. Many filters rely
| on the modification time to determine if they need to recompute
| their data. The modification time is a unique monotonically
| increasing unsigned long integer.
|
| RemoveAllObservers(...)
| RemoveAllObservers(self) -> None
| C++: void RemoveAllObservers()
|
| RemoveObserver(...)
| RemoveObserver(self, __a:vtkCommand) -> None
| C++: void RemoveObserver(vtkCommand *)
| RemoveObserver(self, tag:int) -> None
| C++: void RemoveObserver(unsigned long tag)
|
| RemoveObservers(...)
| RemoveObservers(self, event:int, __b:vtkCommand) -> None
| C++: void RemoveObservers(unsigned long event, vtkCommand *)
| RemoveObservers(self, event:str, __b:vtkCommand) -> None
| C++: void RemoveObservers(const char *event, vtkCommand *)
| RemoveObservers(self, event:int) -> None
| C++: void RemoveObservers(unsigned long event)
| RemoveObservers(self, event:str) -> None
| C++: void RemoveObservers(const char *event)
|
| SetDebug(...)
| SetDebug(self, debugFlag:bool) -> None
| C++: void SetDebug(bool debugFlag)
|
| Set the value of the debug flag. A true value turns debugging on.
|
| SetGlobalWarningDisplay(...)
| SetGlobalWarningDisplay(val:int) -> None
| C++: static void SetGlobalWarningDisplay(int val)
|
| This is a global flag that controls whether any debug, warning or
| error messages are displayed.
|
| SetObjectName(...)
| SetObjectName(self, objectName:str) -> None
| C++: virtual void SetObjectName(const std::string &objectName)
|
| Set/get the name of this object for reporting purposes. The name
| appears in warning and debug messages and in the Print output.
| Setting the object name does not change the MTime and does not
| invoke a ModifiedEvent. Derived classes implementing copying
| methods are expected not to copy the ObjectName.
|
| ----------------------------------------------------------------------
| Methods inherited from vtkmodules.vtkCommonCore.vtkObjectBase:
|
| FastDelete(...)
| FastDelete(self) -> None
| C++: virtual void FastDelete()
|
| Delete a reference to this object. This version will not invoke
| garbage collection and can potentially leak the object if it is
| part of a reference loop. Use this method only when it is known
| that the object has another reference and would not be collected
| if a full garbage collection check were done.
|
| GetAddressAsString(...)
| GetAddressAsString(self, classname:str) -> str
|
| Get address of C++ object in format 'Addr=%p' after casting to
| the specified type. This method is obsolete, you can get the
| same information from o.__this__.
|
| GetClassName(...)
| GetClassName(self) -> str
| C++: const char *GetClassName()
|
| Return the class name as a string.
|
| GetIsInMemkind(...)
| GetIsInMemkind(self) -> bool
| C++: bool GetIsInMemkind()
|
| A local state flag that remembers whether this object lives in
| the normal or extended memory space.
|
| GetReferenceCount(...)
| GetReferenceCount(self) -> int
| C++: int GetReferenceCount()
|
| Return the current reference count of this object.
|
| GetUsingMemkind(...)
| GetUsingMemkind() -> bool
| C++: static bool GetUsingMemkind()
|
| A global state flag that controls whether vtkObjects are
| constructed in the usual way (the default) or within the extended
| memory space.
|
| InitializeObjectBase(...)
| InitializeObjectBase(self) -> None
| C++: void InitializeObjectBase()
|
| Register(...)
| Register(self, o:vtkObjectBase)
| C++: virtual void Register(vtkObjectBase *o)
|
| Increase the reference count by 1.
|
| SetMemkindDirectory(...)
| SetMemkindDirectory(directoryname:str) -> None
| C++: static void SetMemkindDirectory(const char *directoryname)
|
| The name of a directory, ideally mounted -o dax, to memory map an
| extended memory space within. This must be called before any
| objects are constructed in the extended space. It can not be
| changed once setup.
|
| SetReferenceCount(...)
| SetReferenceCount(self, __a:int) -> None
| C++: void SetReferenceCount(int)
|
| Sets the reference count. (This is very dangerous, use with
| care.)
|
| UnRegister(...)
| UnRegister(self, o:vtkObjectBase)
| C++: virtual void UnRegister(vtkObjectBase* o)
|
| Decrease the reference count (release by another object). This
| has the same effect as invoking Delete() (i.e., it reduces the
| reference count by 1).
|
| ----------------------------------------------------------------------
| Class methods inherited from vtkmodules.vtkCommonCore.vtkObjectBase:
|
| override(...) from builtins.type
| This method can be used to override a VTK class with a Python subclass.
| The class type passed to override will afterwards be instantiated
| instead of the type override is called on.
| For example,
|
| class foo(vtk.vtkPoints):
| pass
| vtk.vtkPoints.override(foo)
|
| will lead to foo being instantied everytime vtkPoints() is called.
| The main objective of this functionality is to enable developers to
| extend VTK classes with more pythonic subclasses that contain
| convenience functionality.
|
| ----------------------------------------------------------------------
| Methods inherited from _PointSet:
|
| center_of_mass(self, scalars_weight=False)
| Return the coordinates for the center of mass of the mesh.
|
| Parameters
| ----------
| scalars_weight : bool, default: False
| Flag for using the mesh scalars as weights.
|
| Returns
| -------
| numpy.ndarray
| Coordinates for the center of mass.
|
| Examples
| --------
| >>> import pyvista
| >>> mesh = pyvista.Sphere(center=(1, 1, 1))
| >>> mesh.center_of_mass()
| array([1., 1., 1.])
|
| points_to_double(self)
| Convert the points datatype to double precision.
|
| Returns
| -------
| pyvista.PointSet
| Pointset with points in double precision.
|
| Notes
| -----
| This operates in place.
|
| Examples
| --------
| Create a mesh that has points of the type ``float32`` and
| convert the points to ``float64``.
|
| >>> import pyvista
| >>> mesh = pyvista.Sphere()
| >>> mesh.points.dtype
| dtype('float32')
| >>> _ = mesh.points_to_double()
| >>> mesh.points.dtype
| dtype('float64')
|
| remove_cells(self, ind, inplace=False)
| Remove cells.
|
| Parameters
| ----------
| ind : sequence
| Cell indices to be removed. The array can also be a
| boolean array of the same size as the number of cells.
|
| inplace : bool, default: False
| Whether to update the mesh in-place.
|
| Returns
| -------
| pyvista.DataSet
| Same type as the input, but with the specified cells
| removed.
|
| Examples
| --------
| Remove 20 cells from an unstructured grid.
|
| >>> from pyvista import examples
| >>> import pyvista
| >>> hex_mesh = pyvista.read(examples.hexbeamfile)
| >>> removed = hex_mesh.remove_cells(range(10, 20))
| >>> removed.plot(color='lightblue', show_edges=True, line_width=3)
|
| shallow_copy(self, to_copy)
| Create a shallow copy from a different dataset into this one.
|
| This method mutates this dataset and returns ``None``.
|
| Parameters
| ----------
| to_copy : pyvista.DataSet
| Data object to perform the shallow copy from.
|
| translate(self, xyz: Union[list, tuple, numpy.ndarray], transform_all_input_vectors=False, inplace=None)
| Translate the mesh.
|
| Parameters
| ----------
| xyz : array_like[float]
| Cartesian values to displace with. Length 3 array-like.
|
| transform_all_input_vectors : bool, default: False
| When ``True``, all input vectors are transformed. Otherwise, only
| the points, normals and active vectors are transformed. This is
| only valid when not updating in place.
|
| inplace : bool, optional
| Updates mesh in-place.
|
| Returns
| -------
| pyvista.PointSet
| Translated pointset.
|
| Examples
| --------
| Create a sphere and translate it by ``(2, 1, 2)``.
|
| >>> import pyvista
| >>> mesh = pyvista.Sphere()
| >>> mesh.center
| [0.0, 0.0, 0.0]
| >>> trans = mesh.translate((2, 1, 2), inplace=True)
| >>> trans.center
| [2.0, 1.0, 2.0]
|
| ----------------------------------------------------------------------
| Methods inherited from pyvista.core.dataset.DataSet:
|
| __getattr__(self, item) -> 'Any'
| Get attribute from base class if not found.
|
| __getitem__(self, index: 'Union[Iterable, str]') -> 'np.ndarray'
| Search both point, cell, and field data for an array.
|
| __setitem__(self, name: 'str', scalars: 'Union[np.ndarray, collections.abc.Sequence, float]')
| Add/set an array in the point_data, or cell_data accordingly.
|
| It depends on the array's length, or specified mode.
|
| cast_to_pointset(self, pass_cell_data: 'bool' = False) -> 'pyvista.PointSet'
| Extract the points of this dataset and return a :class:`pyvista.PointSet`.
|
| Parameters
| ----------
| pass_cell_data : bool, default: False
| Run the :func:`cell_data_to_point_data()
| <pyvista.DataSetFilters.cell_data_to_point_data>` filter and pass
| cell data fields to the new pointset.
|
| Returns
| -------
| pyvista.PointSet
| Dataset cast into a :class:`pyvista.PointSet`.
|
| Notes
| -----
| This will produce a deep copy of the points and point/cell data of
| the original mesh.
|
| Examples
| --------
| >>> import pyvista
| >>> mesh = pyvista.Wavelet()
| >>> pointset = mesh.cast_to_pointset()
| >>> type(pointset)
| <class 'pyvista.core.pointset.PointSet'>
|
| cast_to_poly_points(self, pass_cell_data: 'bool' = False) -> 'pyvista.PolyData'
| Extract the points of this dataset and return a :class:`pyvista.PolyData`.
|
| Parameters
| ----------
| pass_cell_data : bool, default: False
| Run the :func:`cell_data_to_point_data()
| <pyvista.DataSetFilters.cell_data_to_point_data>` filter and pass
| cell data fields to the new pointset.
|
| Returns
| -------
| pyvista.PolyData
| Dataset cast into a :class:`pyvista.PolyData`.
|
| Notes
| -----
| This will produce a deep copy of the points and point/cell data of
| the original mesh.
|
| Examples
| --------
| >>> from pyvista import examples
| >>> mesh = examples.load_uniform()
| >>> points = mesh.cast_to_poly_points(pass_cell_data=True)
| >>> type(points)
| <class 'pyvista.core.pointset.PolyData'>
| >>> points.n_arrays
| 2
| >>> points.point_data
| pyvista DataSetAttributes
| Association : POINT
| Active Scalars : Spatial Point Data
| Active Vectors : None
| Active Texture : None
| Active Normals : None
| Contains arrays :
| Spatial Point Data float64 (1000,) SCALARS
| >>> points.cell_data
| pyvista DataSetAttributes
| Association : CELL
| Active Scalars : None
| Active Vectors : None
| Active Texture : None
| Active Normals : None
| Contains arrays :
| Spatial Cell Data float64 (1000,)
|
| cast_to_unstructured_grid(self) -> 'pyvista.UnstructuredGrid'
| Get a new representation of this object as a :class:`pyvista.UnstructuredGrid`.
|
| Returns
| -------
| pyvista.UnstructuredGrid
| Dataset cast into a :class:`pyvista.UnstructuredGrid`.
|
| Examples
| --------
| Cast a :class:`pyvista.PolyData` to a
| :class:`pyvista.UnstructuredGrid`.
|
| >>> import pyvista
| >>> mesh = pyvista.Sphere()
| >>> type(mesh)
| <class 'pyvista.core.pointset.PolyData'>
| >>> grid = mesh.cast_to_unstructured_grid()
| >>> type(grid)
| <class 'pyvista.core.pointset.UnstructuredGrid'>
|
| cell_neighbors(self, ind: 'int', connections: 'str' = 'points') -> 'List[int]'
| Get the cell neighbors of the ind-th cell.
|
| Concrete implementation of vtkDataSet's `GetCellNeighbors
| <https://vtk.org/doc/nightly/html/classvtkDataSet.html#ae1ba413c15802ef50d9b1955a66521e4>`_.
|
| Parameters
| ----------
| ind : int
| Cell ID.
|
| connections : str, default: "points"
| Describe how the neighbor cell(s) must be connected to the current
| cell to be considered as a neighbor.
| Can be either ``'points'``, ``'edges'`` or ``'faces'``.
|
| Returns
| -------
| List[int]
| List of neighbor cells IDs for the ind-th cell.
|
| Warnings
| --------
| For a :class:`pyvista.ExplicitStructuredGrid`, use :func:`pyvista.ExplicitStructuredGrid.neighbors`.
|
| See Also
| --------
| pyvista.DataSet.cell_neighbors_levels
|
| Examples
| --------
| >>> from pyvista import examples
| >>> mesh = examples.load_airplane()
|
| Get the neighbor cell ids that have at least one point in common with
| the 0-th cell.
|
| >>> mesh.cell_neighbors(0, "points")
| [1, 2, 3, 388, 389, 11, 12, 395, 14, 209, 211, 212]
|
| Get the neighbor cell ids that have at least one edge in common with
| the 0-th cell.
|
| >>> mesh.cell_neighbors(0, "edges")
| [1, 3, 12]
|
| For unstructured grids with cells of dimension 3 (Tetrahedron for example),
| cell neighbors can be defined using faces.
|
| >>> mesh = examples.download_tetrahedron()
| >>> mesh.cell_neighbors(0, "faces")
| [1, 5, 7]
|
| Show a visual example.
|
| >>> from functools import partial
| >>> import pyvista
| >>> mesh = pyvista.Sphere(theta_resolution=10)
| >>>
| >>> pl = pyvista.Plotter(shape=(1, 2))
| >>> pl.link_views()
| >>> add_point_labels = partial(
| ... pl.add_point_labels,
| ... text_color="white",
| ... font_size=20,
| ... shape=None,
| ... show_points=False,
| ... )
| >>>
| >>> for i, connection in enumerate(["points", "edges"]):
| ... pl.subplot(0, i)
| ... pl.view_yx()
| ... _ = pl.add_title(
| ... f"{connection.capitalize()} neighbors",
| ... color="red",
| ... shadow=True,
| ... font_size=8,
| ... )
| ...
| ... # Add current cell
| ... i_cell = 0
| ... current_cell = mesh.extract_cells(i_cell)
| ... _ = pl.add_mesh(
| ... current_cell, show_edges=True, color="blue"
| ... )
| ... _ = add_point_labels(
| ... current_cell.cell_centers().points,
| ... labels=[f"{i_cell}"],
| ... )
| ...
| ... # Add neighbors
| ... ids = mesh.cell_neighbors(i_cell, connection)
| ... cells = mesh.extract_cells(ids)
| ... _ = pl.add_mesh(cells, color="red", show_edges=True)
| ... _ = add_point_labels(
| ... cells.cell_centers().points,
| ... labels=[f"{i}" for i in ids],
| ... )
| ...
| ... # Add other cells
| ... ids.append(i_cell)
| ... others = mesh.extract_cells(ids, invert=True)
| ... _ = pl.add_mesh(others, show_edges=True)
| ...
| >>> pl.show()
|
| cell_neighbors_levels(self, ind: 'int', connections: 'str' = 'points', n_levels: 'int' = 1) -> 'Generator[List[int], None, None]'
| Get consecutive levels of cell neighbors.
|
| Parameters
| ----------
| ind : int
| Cell ID.
|
| connections : str, default: "points"
| Describe how the neighbor cell(s) must be connected to the current
| cell to be considered as a neighbor.
| Can be either ``'points'``, ``'edges'`` or ``'faces'``.
|
| n_levels : int, default: 1
| Number of levels to search for cell neighbors.
| When equal to 1, it is equivalent to :func:`pyvista.DataSet.point_neighbors`.
|
| Returns
| -------
| generator[list[int]]
| A generator of list of cell IDs for each level.
|
| Warnings
| --------
| For a :class:`pyvista.ExplicitStructuredGrid`, use :func:`pyvista.ExplicitStructuredGrid.neighbors`.
|
| See Also
| --------
| pyvista.DataSet.cell_neighbors
|
| Examples
| --------
| Get the cell neighbors IDs starting from the 0-th cell
| up until the third level.
|
| >>> import pyvista as pv
| >>> mesh = pv.Sphere(theta_resolution=10)
| >>> nbr_levels = mesh.cell_neighbors_levels(
| ... 0, connections="edges", n_levels=3
| ... )
| >>> nbr_levels = list(nbr_levels)
| >>> nbr_levels[0]
| [1, 21, 9]
| >>> nbr_levels[1]
| [2, 8, 74, 75, 20, 507]
| >>> nbr_levels[2]
| [128, 129, 3, 453, 7, 77, 23, 506]
|
| Visualize these cells IDs.
|
| >>> from functools import partial
| >>> pv.global_theme.color_cycler = [
| ... 'red',
| ... 'green',
| ... 'blue',
| ... 'purple',
| ... ]
| >>> pl = pv.Plotter()
| >>>
| >>> # Define partial function to add point labels
| >>> add_point_labels = partial(
| ... pl.add_point_labels,
| ... text_color="white",
| ... font_size=40,
| ... shape=None,
| ... show_points=False,
| ... )
| >>>
| >>> # Add the 0-th cell to the plotter
| >>> cell = mesh.extract_cells(0)
| >>> _ = pl.add_mesh(cell, show_edges=True)
| >>> _ = add_point_labels(cell.cell_centers().points, labels=["0"])
| >>> other_ids = [0]
| >>>
| >>> # Add the neighbors to the plot
| >>> neighbors = mesh.cell_neighbors_levels(
| ... 0, connections="edges", n_levels=3
| ... )
| >>> for i, ids in enumerate(neighbors, start=1):
| ... cells = mesh.extract_cells(ids)
| ... _ = pl.add_mesh(cells, show_edges=True)
| ... _ = add_point_labels(
| ... cells.cell_centers().points, labels=[f"{i}"] * len(ids)
| ... )
| ... other_ids.extend(ids)
| ...
| >>>
| >>> # Add the cell IDs that are not neighbors (ie. the rest of the sphere)
| >>> cells = mesh.extract_cells(other_ids, invert=True)
| >>> _ = pl.add_mesh(cells, color="white", show_edges=True)
| >>>
| >>> pl.view_yx()
| >>> pl.camera.zoom(6.0)
| >>> pl.show()
|
| clear_cell_data(self)
| Remove all cell arrays.
|
| clear_data(self)
| Remove all arrays from point/cell/field data.
|
| Examples
| --------
| Clear all arrays from a mesh.
|
| >>> import pyvista
| >>> import numpy as np
| >>> mesh = pyvista.Sphere()
| >>> mesh.point_data.keys()
| ['Normals']
| >>> mesh.clear_data()
| >>> mesh.point_data.keys()
| []
|
| clear_point_data(self)
| Remove all point arrays.
|
| Examples
| --------
| Clear all point arrays from a mesh.
|
| >>> import pyvista
| >>> import numpy as np
| >>> mesh = pyvista.Sphere()
| >>> mesh.point_data.keys()
| ['Normals']
| >>> mesh.clear_point_data()
| >>> mesh.point_data.keys()
| []
|
| copy_from(self, mesh: '_vtk.vtkDataSet', deep: 'bool' = True)
| Overwrite this dataset inplace with the new dataset's geometries and data.
|
| Parameters
| ----------
| mesh : vtk.vtkDataSet
| The overwriting mesh.
|
| deep : bool, default: True
| Whether to perform a deep or shallow copy.
|
| Examples
| --------
| Create two meshes and overwrite ``mesh_a`` with ``mesh_b``.
| Show that ``mesh_a`` is equal to ``mesh_b``.
|
| >>> import pyvista
| >>> mesh_a = pyvista.Sphere()
| >>> mesh_b = pyvista.Cube()
| >>> mesh_a.copy_from(mesh_b)
| >>> mesh_a == mesh_b
| True
|
| copy_meta_from(self, ido: 'DataSet', deep: 'bool' = True)
| Copy pyvista meta data onto this object from another object.
|
| Parameters
| ----------
| ido : pyvista.DataSet
| Dataset to copy the metadata from.
|
| deep : bool, default: True
| Deep or shallow copy.
|
| find_cells_along_line(self, pointa: 'Iterable[float]', pointb: 'Iterable[float]', tolerance=0.0) -> 'np.ndarray'
| Find the index of cells whose bounds intersect a line.
|
| Line is defined from ``pointa`` to ``pointb``.
|
| Parameters
| ----------
| pointa : sequence[float]
| Length 3 coordinate of the start of the line.
|
| pointb : sequence[float]
| Length 3 coordinate of the end of the line.
|
| tolerance : float, default: 0.0
| The absolute tolerance to use to find cells along line.
|
| Returns
| -------
| numpy.ndarray
| Index or indices of the cell(s) whose bounds intersect
| the line.
|
| Warnings
| --------
| This method returns cells whose bounds intersect the line.
| This means that the line may not intersect the cell itself.
| To obtain cells that intersect the line, use
| :func:`pyvista.DataSet.find_cells_intersecting_line`.
|
| See Also
| --------
| DataSet.find_closest_point
| DataSet.find_closest_cell
| DataSet.find_containing_cell
| DataSet.find_cells_within_bounds
| DataSet.find_cells_intersecting_line
|
| Examples
| --------
| >>> import pyvista
| >>> mesh = pyvista.Sphere()
| >>> mesh.find_cells_along_line([0.0, 0, 0], [1.0, 0, 0])
| array([ 86, 87, 1652, 1653])
|
| find_cells_intersecting_line(self, pointa: 'Iterable[float]', pointb: 'Iterable[float]', tolerance=0.0) -> 'np.ndarray'
| Find the index of cells that intersect a line.
|
| Line is defined from ``pointa`` to ``pointb``. This
| method requires vtk version >=9.2.0.
|
| Parameters
| ----------
| pointa : sequence[float]
| Length 3 coordinate of the start of the line.
|
| pointb : sequence[float]
| Length 3 coordinate of the end of the line.
|
| tolerance : float, default: 0.0
| The absolute tolerance to use to find cells along line.
|
| Returns
| -------
| numpy.ndarray
| Index or indices of the cell(s) that intersect
| the line.
|
| See Also
| --------
| DataSet.find_closest_point
| DataSet.find_closest_cell
| DataSet.find_containing_cell
| DataSet.find_cells_within_bounds
| DataSet.find_cells_along_line
|
| Examples
| --------
| >>> import pyvista
| >>> mesh = pyvista.Sphere()
| >>> mesh.find_cells_intersecting_line([0.0, 0, 0], [1.0, 0, 0])
| array([ 86, 1653])
|
| find_cells_within_bounds(self, bounds: 'Iterable[float]') -> 'np.ndarray'
| Find the index of cells in this mesh within bounds.
|
| Parameters
| ----------
| bounds : sequence[float]
| Bounding box. The form is: ``[xmin, xmax, ymin, ymax, zmin, zmax]``.
|
| Returns
| -------
| numpy.ndarray
| Index or indices of the cell in this mesh that are closest
| to the given point.
|
| See Also
| --------
| DataSet.find_closest_point
| DataSet.find_closest_cell
| DataSet.find_containing_cell
| DataSet.find_cells_along_line
|
| Examples
| --------
| >>> import pyvista
| >>> mesh = pyvista.Cube()
| >>> index = mesh.find_cells_within_bounds(
| ... [-2.0, 2.0, -2.0, 2.0, -2.0, 2.0]
| ... )
|
| find_closest_cell(self, point: 'Union[VectorArray, NumericArray]', return_closest_point: 'bool' = False) -> 'Union[int, np.ndarray, Tuple[Union[int, np.ndarray], np.ndarray]]'
| Find index of closest cell in this mesh to the given point.
|
| Parameters
| ----------
| point : array_like[float]
| Coordinates of point to query (length 3) or a
| :class:`numpy.ndarray` of ``n`` points with shape ``(n, 3)``.
|
| return_closest_point : bool, default: False
| If ``True``, the closest point within a mesh cell to that point is
| returned. This is not necessarily the closest nodal point on the
| mesh. Default is ``False``.
|
| Returns
| -------
| int or numpy.ndarray
| Index or indices of the cell in this mesh that is/are closest
| to the given point(s).
|
| .. versionchanged:: 0.35.0
| Inputs of shape ``(1, 3)`` now return a :class:`numpy.ndarray`
| of shape ``(1,)``.
|
| numpy.ndarray
| Point or points inside a cell of the mesh that is/are closest
| to the given point(s). Only returned if
| ``return_closest_point=True``.
|
| .. versionchanged:: 0.35.0
| Inputs of shape ``(1, 3)`` now return a :class:`numpy.ndarray`
| of the same shape.
|
| Warnings
| --------
| This method may still return a valid cell index even if the point
| contains a value like ``numpy.inf`` or ``numpy.nan``.
|
| See Also
| --------
| DataSet.find_closest_point
| DataSet.find_containing_cell
| DataSet.find_cells_along_line
| DataSet.find_cells_within_bounds
|
| Examples
| --------
| Find nearest cell on a sphere centered on the
| origin to the point ``[0.1, 0.2, 0.3]``.
|
| >>> import pyvista
| >>> mesh = pyvista.Sphere()
| >>> point = [0.1, 0.2, 0.3]
| >>> index = mesh.find_closest_cell(point)
| >>> index
| 338
|
| Make sure that this cell indeed is the closest to
| ``[0.1, 0.2, 0.3]``.
|
| >>> import numpy as np
| >>> cell_centers = mesh.cell_centers()
| >>> relative_position = cell_centers.points - point
| >>> distance = np.linalg.norm(relative_position, axis=1)
| >>> np.argmin(distance)
| 338
|
| Find the nearest cells to several random points that
| are centered on the origin.
|
| >>> points = 2 * np.random.random((5000, 3)) - 1
| >>> indices = mesh.find_closest_cell(points)
| >>> indices.shape
| (5000,)
|
| For the closest cell, find the point inside the cell that is
| closest to the supplied point. The rectangle is a unit square
| with 1 cell and 4 nodal points at the corners in the plane with
| ``z`` normal and ``z=0``. The closest point inside the cell is
| not usually at a nodal point.
|
| >>> unit_square = pyvista.Rectangle()
| >>> index, closest_point = unit_square.find_closest_cell(
| ... [0.25, 0.25, 0.5], return_closest_point=True
| ... )
| >>> closest_point
| array([0.25, 0.25, 0. ])
|
| But, the closest point can be a nodal point, although the index of
| that point is not returned. If the closest nodal point by index is
| desired, see :func:`DataSet.find_closest_point`.
|
| >>> index, closest_point = unit_square.find_closest_cell(
| ... [1.0, 1.0, 0.5], return_closest_point=True
| ... )
| >>> closest_point
| array([1., 1., 0.])
|
| find_closest_point(self, point: 'Iterable[float]', n=1) -> 'int'
| Find index of closest point in this mesh to the given point.
|
| If wanting to query many points, use a KDTree with scipy or another
| library as those implementations will be easier to work with.
|
| See: https://github.com/pyvista/pyvista-support/issues/107
|
| Parameters
| ----------
| point : sequence[float]
| Length 3 coordinate of the point to query.
|
| n : int, optional
| If greater than ``1``, returns the indices of the ``n`` closest
| points.
|
| Returns
| -------
| int
| The index of the point in this mesh that is closest to the given point.
|
| See Also
| --------
| DataSet.find_closest_cell
| DataSet.find_containing_cell
| DataSet.find_cells_along_line
| DataSet.find_cells_within_bounds
|
| Examples
| --------
| Find the index of the closest point to ``(0, 1, 0)``.
|
| >>> import pyvista
| >>> mesh = pyvista.Sphere()
| >>> index = mesh.find_closest_point((0, 1, 0))
| >>> index
| 239
|
| Get the coordinate of that point.
|
| >>> mesh.points[index]
| pyvista_ndarray([-0.05218758, 0.49653167, 0.02706946], dtype=float32)
|
| find_containing_cell(self, point: 'Union[VectorArray, NumericArray]') -> 'Union[int, np.ndarray]'
| Find index of a cell that contains the given point.
|
| Parameters
| ----------
| point : array_like[float]
| Coordinates of point to query (length 3) or a
| :class:`numpy.ndarray` of ``n`` points with shape ``(n, 3)``.
|
| Returns
| -------
| int or numpy.ndarray
| Index or indices of the cell in this mesh that contains
| the given point.
|
| .. versionchanged:: 0.35.0
| Inputs of shape ``(1, 3)`` now return a :class:`numpy.ndarray`
| of shape ``(1,)``.
|
| See Also
| --------
| DataSet.find_closest_point
| DataSet.find_closest_cell
| DataSet.find_cells_along_line
| DataSet.find_cells_within_bounds
|
| Examples
| --------
| A unit square with 16 equal sized cells is created and a cell
| containing the point ``[0.3, 0.3, 0.0]`` is found.
|
| >>> import pyvista
| >>> mesh = pyvista.ImageData(
| ... dimensions=[5, 5, 1], spacing=[1 / 4, 1 / 4, 0]
| ... )
| >>> mesh
| ImageData...
| >>> mesh.find_containing_cell([0.3, 0.3, 0.0])
| 5
|
| A point outside the mesh domain will return ``-1``.
|
| >>> mesh.find_containing_cell([0.3, 0.3, 1.0])
| -1
|
| Find the cells that contain 1000 random points inside the mesh.
|
| >>> import numpy as np
| >>> points = np.random.random((1000, 3))
| >>> indices = mesh.find_containing_cell(points)
| >>> indices.shape
| (1000,)
|
| flip_normal(self, normal: 'List[float]', point=None, transform_all_input_vectors=False, inplace=False)
| Flip mesh about the normal.
|
| .. note::
| See also the notes at :func:`transform()
| <DataSetFilters.transform>` which is used by this filter
| under the hood.
|
| Parameters
| ----------
| normal : tuple
| Normal vector to flip about.
|
| point : sequence[float]
| Point to rotate about. Defaults to center of mesh at
| :attr:`center <pyvista.DataSet.center>`.
|
| transform_all_input_vectors : bool, default: False
| When ``True``, all input vectors are
| transformed. Otherwise, only the points, normals and
| active vectors are transformed.
|
| inplace : bool, default: False
| Updates mesh in-place.
|
| Returns
| -------
| pyvista.DataSet
| Dataset flipped about its normal.
|
| Examples
| --------
| >>> import pyvista
| >>> from pyvista import examples
| >>> pl = pyvista.Plotter(shape=(1, 2))
| >>> pl.subplot(0, 0)
| >>> pl.show_axes()
| >>> mesh1 = examples.download_teapot()
| >>> _ = pl.add_mesh(mesh1)
| >>> pl.subplot(0, 1)
| >>> pl.show_axes()
| >>> mesh2 = mesh1.flip_normal([1.0, 1.0, 1.0], inplace=False)
| >>> _ = pl.add_mesh(mesh2)
| >>> pl.show(cpos="xy")
|
| flip_x(self, point=None, transform_all_input_vectors=False, inplace=False)
| Flip mesh about the x-axis.
|
| .. note::
| See also the notes at :func:`transform()
| <DataSetFilters.transform>` which is used by this filter
| under the hood.
|
| Parameters
| ----------
| point : sequence[float], optional
| Point to rotate about. Defaults to center of mesh at
| :attr:`center <pyvista.DataSet.center>`.
|
| transform_all_input_vectors : bool, default: False
| When ``True``, all input vectors are
| transformed. Otherwise, only the points, normals and
| active vectors are transformed.
|
| inplace : bool, default: False
| Updates mesh in-place.
|
| Returns
| -------
| pyvista.DataSet
| Flipped dataset.
|
| Examples
| --------
| >>> import pyvista
| >>> from pyvista import examples
| >>> pl = pyvista.Plotter(shape=(1, 2))
| >>> pl.subplot(0, 0)
| >>> pl.show_axes()
| >>> mesh1 = examples.download_teapot()
| >>> _ = pl.add_mesh(mesh1)
| >>> pl.subplot(0, 1)
| >>> pl.show_axes()
| >>> mesh2 = mesh1.flip_x(inplace=False)
| >>> _ = pl.add_mesh(mesh2)
| >>> pl.show(cpos="xy")
|
| flip_y(self, point=None, transform_all_input_vectors=False, inplace=False)
| Flip mesh about the y-axis.
|
| .. note::
| See also the notes at :func:`transform()
| <DataSetFilters.transform>` which is used by this filter
| under the hood.
|
| Parameters
| ----------
| point : sequence[float], optional
| Point to rotate about. Defaults to center of mesh at
| :attr:`center <pyvista.DataSet.center>`.
|
| transform_all_input_vectors : bool, default: False
| When ``True``, all input vectors are
| transformed. Otherwise, only the points, normals and
| active vectors are transformed.
|
| inplace : bool, default: False
| Updates mesh in-place.
|
| Returns
| -------
| pyvista.DataSet
| Flipped dataset.
|
| Examples
| --------
| >>> import pyvista
| >>> from pyvista import examples
| >>> pl = pyvista.Plotter(shape=(1, 2))
| >>> pl.subplot(0, 0)
| >>> pl.show_axes()
| >>> mesh1 = examples.download_teapot()
| >>> _ = pl.add_mesh(mesh1)
| >>> pl.subplot(0, 1)
| >>> pl.show_axes()
| >>> mesh2 = mesh1.flip_y(inplace=False)
| >>> _ = pl.add_mesh(mesh2)
| >>> pl.show(cpos="xy")
|
| flip_z(self, point=None, transform_all_input_vectors=False, inplace=False)
| Flip mesh about the z-axis.
|
| .. note::
| See also the notes at :func:`transform()
| <DataSetFilters.transform>` which is used by this filter
| under the hood.
|
| Parameters
| ----------
| point : list, optional
| Point to rotate about. Defaults to center of mesh at
| :attr:`center <pyvista.DataSet.center>`.
|
| transform_all_input_vectors : bool, optional
| When ``True``, all input vectors are
| transformed. Otherwise, only the points, normals and
| active vectors are transformed.
|
| inplace : bool, optional
| Updates mesh in-place.
|
| Returns
| -------
| pyvista.DataSet
| Flipped dataset.
|
| Examples
| --------
| >>> import pyvista
| >>> from pyvista import examples
| >>> pl = pyvista.Plotter(shape=(1, 2))
| >>> pl.subplot(0, 0)
| >>> pl.show_axes()
| >>> mesh1 = examples.download_teapot().rotate_x(90, inplace=False)
| >>> _ = pl.add_mesh(mesh1)
| >>> pl.subplot(0, 1)
| >>> pl.show_axes()
| >>> mesh2 = mesh1.flip_z(inplace=False)
| >>> _ = pl.add_mesh(mesh2)
| >>> pl.show(cpos="xz")
|
| get_array(self, name: 'str', preference: "Literal['cell', 'point', 'field']" = 'cell') -> 'pyvista.pyvista_ndarray'
| Search both point, cell and field data for an array.
|
| Parameters
| ----------
| name : str
| Name of the array.
|
| preference : str, default: "cell"
| When scalars is specified, this is the preferred array
| type to search for in the dataset. Must be either
| ``'point'``, ``'cell'``, or ``'field'``.
|
| Returns
| -------
| pyvista.pyvista_ndarray
| Requested array.
|
| Examples
| --------
| Create a DataSet with a variety of arrays.
|
| >>> import pyvista
| >>> mesh = pyvista.Cube()
| >>> mesh.clear_data()
| >>> mesh.point_data['point-data'] = range(mesh.n_points)
| >>> mesh.cell_data['cell-data'] = range(mesh.n_cells)
| >>> mesh.field_data['field-data'] = ['a', 'b', 'c']
| >>> mesh.array_names
| ['point-data', 'field-data', 'cell-data']
|
| Get the point data array.
|
| >>> mesh.get_array('point-data')
| pyvista_ndarray([0, 1, 2, 3, 4, 5, 6, 7])
|
| Get the cell data array.
|
| >>> mesh.get_array('cell-data')
| pyvista_ndarray([0, 1, 2, 3, 4, 5])
|
| Get the field data array.
|
| >>> mesh.get_array('field-data')
| pyvista_ndarray(['a', 'b', 'c'], dtype='<U1')
|
| get_array_association(self, name: 'str', preference: "Literal['cell', 'point', 'field']" = 'cell') -> 'FieldAssociation'
| Get the association of an array.
|
| Parameters
| ----------
| name : str
| Name of the array.
|
| preference : str, default: "cell"
| When ``name`` is specified, this is the preferred array
| association to search for in the dataset. Must be either
| ``'point'``, ``'cell'``, or ``'field'``.
|
| Returns
| -------
| pyvista.core.utilities.arrays.FieldAssociation
| Field association of the array.
|
| Examples
| --------
| Create a DataSet with a variety of arrays.
|
| >>> import pyvista
| >>> mesh = pyvista.Cube()
| >>> mesh.clear_data()
| >>> mesh.point_data['point-data'] = range(mesh.n_points)
| >>> mesh.cell_data['cell-data'] = range(mesh.n_cells)
| >>> mesh.field_data['field-data'] = ['a', 'b', 'c']
| >>> mesh.array_names
| ['point-data', 'field-data', 'cell-data']
|
| Get the point data array association.
|
| >>> mesh.get_array_association('point-data')
| <FieldAssociation.POINT: 0>
|
| Get the cell data array association.
|
| >>> mesh.get_array_association('cell-data')
| <FieldAssociation.CELL: 1>
|
| Get the field data array association.
|
| >>> mesh.get_array_association('field-data')
| <FieldAssociation.NONE: 2>
|
| get_cell(self, index: 'int') -> 'pyvista.Cell'
| Return a :class:`pyvista.Cell` object.
|
| Parameters
| ----------
| index : int
| Cell ID.
|
| Returns
| -------
| pyvista.Cell
| The i-th pyvista.Cell.
|
| Notes
| -----
| Cells returned from this method are deep copies of the original
| cells. Changing properties (for example, ``points``) will not affect
| the dataset they originated from.
|
| Examples
| --------
| Get the 0-th cell.
|
| >>> from pyvista import examples
| >>> mesh = examples.load_airplane()
| >>> cell = mesh.get_cell(0)
| >>> cell
| Cell ...
|
| Get the point ids of the first cell
|
| >>> cell.point_ids
| [0, 1, 2]
|
| Get the point coordinates of the first cell
|
| >>> cell.points
| array([[897.0, 48.8, 82.3],
| [906.6, 48.8, 80.7],
| [907.5, 55.5, 83.7]])
|
| For the first cell, get the points associated with the first edge
|
| >>> cell.edges[0].point_ids
| [0, 1]
|
| For a Tetrahedron, get the point ids of the last face
|
| >>> mesh = examples.cells.Tetrahedron()
| >>> cell = mesh.get_cell(0)
| >>> cell.faces[-1].point_ids
| [0, 2, 1]
|
| get_data_range(self, arr_var: 'Optional[Union[str, np.ndarray]]' = None, preference='cell') -> 'Tuple[Union[float, np.ndarray], Union[float, np.ndarray]]'
| Get the non-NaN min and max of a named array.
|
| Parameters
| ----------
| arr_var : str, np.ndarray, optional
| The name of the array to get the range. If ``None``, the
| active scalars is used.
|
| preference : str, default: "cell"
| When scalars is specified, this is the preferred array type
| to search for in the dataset. Must be either ``'point'``,
| ``'cell'``, or ``'field'``.
|
| Returns
| -------
| tuple
| ``(min, max)`` of the named array.
|
| overwrite(self, mesh: '_vtk.vtkDataSet')
| Overwrite this dataset inplace with the new dataset's geometries and data.
|
| .. deprecated:: 0.37.0
| Use :func:`DataSet.copy_from` instead.
|
| Parameters
| ----------
| mesh : vtk.vtkDataSet
| The overwriting mesh.
|
| plot(var_item, off_screen=None, full_screen=None, screenshot=None, interactive=True, cpos=None, window_size=None, show_bounds=False, show_axes=None, notebook=None, background=None, text='', return_img=False, eye_dome_lighting=False, volume=False, parallel_projection=False, jupyter_backend=None, return_viewer=False, return_cpos=False, jupyter_kwargs=None, theme=None, hidden_line_removal=None, anti_aliasing=None, zoom=None, border=False, border_color='k', border_width=2.0, ssao=False, **kwargs)
| Plot a PyVista, numpy, or vtk object.
|
| Parameters
| ----------
| var_item : pyvista.DataSet
| See :func:`Plotter.add_mesh <pyvista.Plotter.add_mesh>` for all
| supported types.
|
| off_screen : bool, optional
| Plots off screen when ``True``. Helpful for saving
| screenshots without a window popping up. Defaults to the
| global setting ``pyvista.OFF_SCREEN``.
|
| full_screen : bool, default: :attr:`pyvista.plotting.themes.Theme.full_screen`
| Opens window in full screen. When enabled, ignores
| ``window_size``.
|
| screenshot : str or bool, optional
| Saves screenshot to file when enabled. See:
| :func:`Plotter.screenshot() <pyvista.Plotter.screenshot>`.
| Default ``False``.
|
| When ``True``, takes screenshot and returns ``numpy`` array of
| image.
|
| interactive : bool, default: :attr:`pyvista.plotting.themes.Theme.interactive`
| Allows user to pan and move figure.
|
| cpos : list, optional
| List of camera position, focal point, and view up.
|
| window_size : sequence, default: :attr:`pyvista.plotting.themes.Theme.window_size`
| Window size in pixels.
|
| show_bounds : bool, default: False
| Shows mesh bounds when ``True``.
|
| show_axes : bool, default: :attr:`pyvista.plotting.themes._AxesConfig.show`
| Shows a vtk axes widget.
|
| notebook : bool, default: :attr:`pyvista.plotting.themes.Theme.notebook`
| When ``True``, the resulting plot is placed inline a jupyter
| notebook. Assumes a jupyter console is active.
|
| background : ColorLike, default: :attr:`pyvista.plotting.themes.Theme.background`
| Color of the background.
|
| text : str, optional
| Adds text at the bottom of the plot.
|
| return_img : bool, default: False
| Returns numpy array of the last image rendered.
|
| eye_dome_lighting : bool, optional
| Enables eye dome lighting.
|
| volume : bool, default: False
| Use the :func:`Plotter.add_volume()
| <pyvista.Plotter.add_volume>` method for volume rendering.
|
| parallel_projection : bool, default: False
| Enable parallel projection.
|
| jupyter_backend : str, default: :attr:`pyvista.plotting.themes.Theme.jupyter_backend`
| Jupyter notebook plotting backend to use. One of the
| following:
|
| * ``'none'`` : Do not display in the notebook.
| * ``'static'`` : Display a static figure.
| * ``'trame'`` : Display using ``trame``.
|
| This can also be set globally with
| :func:`pyvista.set_jupyter_backend`.
|
| return_viewer : bool, default: False
| Return the jupyterlab viewer, scene, or display object
| when plotting with jupyter notebook.
|
| return_cpos : bool, default: False
| Return the last camera position from the render window
| when enabled. Defaults to value in theme settings.
|
| jupyter_kwargs : dict, optional
| Keyword arguments for the Jupyter notebook plotting backend.
|
| theme : pyvista.plotting.themes.Theme, optional
| Plot-specific theme.
|
| hidden_line_removal : bool, default: :attr:`pyvista.plotting.themes.Theme.hidden_line_removal`
| Wireframe geometry will be drawn using hidden line removal if
| the rendering engine supports it. See
| :func:`Plotter.enable_hidden_line_removal
| <Plotter.enable_hidden_line_removal>`.
|
| anti_aliasing : str | bool, default: :attr:`pyvista.plotting.themes.Theme.anti_aliasing`
| Enable or disable anti-aliasing. If ``True``, uses ``"msaa"``. If False,
| disables anti_aliasing. If a string, should be either ``"fxaa"`` or
| ``"ssaa"``.
|
| zoom : float, str, optional
| Camera zoom. Either ``'tight'`` or a float. A value greater than 1
| is a zoom-in, a value less than 1 is a zoom-out. Must be greater
| than 0.
|
| border : bool, default: False
| Draw a border around each render window.
|
| border_color : ColorLike, default: "k"
| Either a string, rgb list, or hex color string. For example:
|
| * ``color='white'``
| * ``color='w'``
| * ``color=[1.0, 1.0, 1.0]``
| * ``color='#FFFFFF'``
|
| border_width : float, default: 2.0
| Width of the border in pixels when enabled.
|
| ssao : bool, optional
| Enable surface space ambient occlusion (SSAO). See
| :func:`Plotter.enable_ssao` for more details.
|
| **kwargs : dict, optional
| See :func:`pyvista.Plotter.add_mesh` for additional options.
|
| Returns
| -------
| cpos : list
| List of camera position, focal point, and view up.
| Returned only when ``return_cpos=True`` or set in the
| default global or plot theme. Not returned when in a
| jupyter notebook and ``return_viewer=True``.
|
| image : np.ndarray
| Numpy array of the last image when either ``return_img=True``
| or ``screenshot=True`` is set. Not returned when in a
| jupyter notebook with ``return_viewer=True``. Optionally
| contains alpha values. Sized:
|
| * [Window height x Window width x 3] if the theme sets
| ``transparent_background=False``.
| * [Window height x Window width x 4] if the theme sets
| ``transparent_background=True``.
|
| widget : ipywidgets.Widget
| IPython widget when ``return_viewer=True``.
|
| Examples
| --------
| Plot a simple sphere while showing its edges.
|
| >>> import pyvista as pv
| >>> mesh = pv.Sphere()
| >>> mesh.plot(show_edges=True)
|
| Plot a volume mesh. Color by distance from the center of the
| ImageData. Note ``volume=True`` is passed.
|
| >>> import numpy as np
| >>> grid = pv.ImageData(
| ... dimensions=(32, 32, 32), spacing=(0.5, 0.5, 0.5)
| ... )
| >>> grid['data'] = np.linalg.norm(grid.center - grid.points, axis=1)
| >>> grid['data'] = np.abs(grid['data'] - grid['data'].max()) ** 3
| >>> grid.plot(volume=True)
|
| point_cell_ids(self, ind: 'int') -> 'List[int]'
| Get the cell IDs that use the ind-th point.
|
| Implements vtkDataSet's `GetPointCells <https://vtk.org/doc/nightly/html/classvtkDataSet.html#a36d1d8f67ad67adf4d1a9cfb30dade49>`_.
|
| Parameters
| ----------
| ind : int
| Point ID.
|
| Returns
| -------
| List[int]
| List of cell IDs using the ind-th point.
|
| Examples
| --------
| Get the cell ids using the 0-th point.
|
| >>> import pyvista as pv
| >>> mesh = pv.Sphere(theta_resolution=10)
| >>> mesh.point_cell_ids(0)
| [0, 1, 2, 3, 4, 5, 6, 7, 8, 9]
|
| Plot them.
|
| >>> pl = pv.Plotter()
| >>> _ = pl.add_mesh(mesh, show_edges=True)
| >>>
| >>> # Label the 0-th point
| >>> _ = pl.add_point_labels(
| ... mesh.points[0], ["0"], text_color="blue", font_size=20
| ... )
| >>>
| >>> # Get the cells ids using the 0-th point
| >>> ids = mesh.point_cell_ids(0)
| >>> cells = mesh.extract_cells(ids)
| >>> _ = pl.add_mesh(cells, color="red", show_edges=True)
| >>> centers = cells.cell_centers().points
| >>> _ = pl.add_point_labels(
| ... centers,
| ... labels=[f"{i}" for i in ids],
| ... text_color="white",
| ... font_size=20,
| ... shape=None,
| ... show_points=False,
| ... )
| >>>
| >>> # Plot the other cells
| >>> others = mesh.extract_cells(
| ... [i for i in range(mesh.n_cells) if i not in ids]
| ... )
| >>> _ = pl.add_mesh(others, show_edges=True)
| >>>
| >>> pl.camera_position = "yx"
| >>> pl.camera.zoom(7.0)
| >>> pl.show()
|
| point_is_inside_cell(self, ind: 'int', point: 'Union[VectorArray, NumericArray]') -> 'Union[int, np.ndarray]'
| Return whether one or more points are inside a cell.
|
| .. versionadded:: 0.35.0
|
| Parameters
| ----------
| ind : int
| Cell ID.
|
| point : array_like[float]
| Coordinates of point to query (length 3) or a
| :class:`numpy.ndarray` of ``n`` points with shape ``(n, 3)``.
|
| Returns
| -------
| bool or numpy.ndarray
| Whether point(s) is/are inside cell. A scalar bool is only returned if
| the input point has shape ``(3,)``.
|
| Examples
| --------
| >>> from pyvista import examples
| >>> mesh = examples.load_hexbeam()
| >>> mesh.get_cell(0).bounds
| (0.0, 0.5, 0.0, 0.5, 0.0, 0.5)
| >>> mesh.point_is_inside_cell(0, [0.2, 0.2, 0.2])
| True
|
| point_neighbors(self, ind: 'int') -> 'List[int]'
| Get the point neighbors of the ind-th point.
|
| Parameters
| ----------
| ind : int
| Point ID.
|
| Returns
| -------
| List[int]
| List of neighbor points IDs for the ind-th point.
|
| See Also
| --------
| pyvista.DataSet.point_neighbors_levels
|
| Examples
| --------
| Get the point neighbors of the 0-th point.
|
| >>> import pyvista as pv
| >>> mesh = pv.Sphere(theta_resolution=10)
| >>> mesh.point_neighbors(0)
| [2, 226, 198, 170, 142, 114, 86, 254, 58, 30]
|
| Plot them.
|
| >>> pl = pv.Plotter()
| >>> _ = pl.add_mesh(mesh, show_edges=True)
| >>>
| >>> # Label the 0-th point
| >>> _ = pl.add_point_labels(
| ... mesh.points[0], ["0"], text_color="blue", font_size=40
| ... )
| >>>
| >>> # Get the point neighbors and plot them
| >>> neighbors = mesh.point_neighbors(0)
| >>> _ = pl.add_point_labels(
| ... mesh.points[neighbors],
| ... labels=[f"{i}" for i in neighbors],
| ... text_color="red",
| ... font_size=40,
| ... )
| >>> pl.camera_position = "yx"
| >>> pl.camera.zoom(7.0)
| >>> pl.show()
|
| point_neighbors_levels(self, ind: 'int', n_levels: 'int' = 1) -> 'Generator[List[int], None, None]'
| Get consecutive levels of point neighbors.
|
| Parameters
| ----------
| ind : int
| Point ID.
|
| n_levels : int, default: 1
| Number of levels to search for point neighbors.
| When equal to 1, it is equivalent to :func:`pyvista.DataSet.point_neighbors`.
|
| Returns
| -------
| generator[list[[int]]
| A generator of list of neighbor points IDs for the ind-th point.
|
| See Also
| --------
| pyvista.DataSet.point_neighbors
|
| Examples
| --------
| Get the point neighbors IDs starting from the 0-th point
| up until the third level.
|
| >>> import pyvista as pv
| >>> mesh = pv.Sphere(theta_resolution=10)
| >>> pt_nbr_levels = mesh.point_neighbors_levels(0, 3)
| >>> pt_nbr_levels = list(pt_nbr_levels)
| >>> pt_nbr_levels[0]
| [2, 226, 198, 170, 142, 114, 86, 30, 58, 254]
| >>> pt_nbr_levels[1]
| [3, 227, 255, 199, 171, 143, 115, 87, 59, 31]
| >>> pt_nbr_levels[2]
| [256, 32, 4, 228, 200, 172, 144, 116, 88, 60]
|
| Visualize these points IDs.
|
| >>> from functools import partial
| >>> pl = pv.Plotter()
| >>> _ = pl.add_mesh(mesh, show_edges=True)
| >>>
| >>> # Define partial function to add point labels
| >>> add_point_labels = partial(
| ... pl.add_point_labels,
| ... text_color="white",
| ... font_size=40,
| ... point_size=10,
| ... )
| >>>
| >>> # Add the first point label
| >>> _ = add_point_labels(
| ... mesh.points[0], labels=["0"], text_color="blue"
| ... )
| >>>
| >>> # Add the neighbors to the plot
| >>> neighbors = mesh.point_neighbors_levels(0, n_levels=3)
| >>> for i, ids in enumerate(neighbors, start=1):
| ... _ = add_point_labels(
| ... mesh.points[ids],
| ... labels=[f"{i}"] * len(ids),
| ... text_color="red",
| ... )
| ...
| >>>
| >>> pl.view_yx()
| >>> pl.camera.zoom(4.0)
| >>> pl.show()
|
| rename_array(self, old_name: 'str', new_name: 'str', preference='cell')
| Change array name by searching for the array then renaming it.
|
| Parameters
| ----------
| old_name : str
| Name of the array to rename.
|
| new_name : str
| Name to rename the array to.
|
| preference : str, default: "cell"
| If there are two arrays of the same name associated with
| points, cells, or field data, it will prioritize an array
| matching this type. Can be either ``'cell'``,
| ``'field'``, or ``'point'``.
|
| Examples
| --------
| Create a cube, assign a point array to the mesh named
| ``'my_array'``, and rename it to ``'my_renamed_array'``.
|
| >>> import pyvista
| >>> import numpy as np
| >>> cube = pyvista.Cube()
| >>> cube['my_array'] = range(cube.n_points)
| >>> cube.rename_array('my_array', 'my_renamed_array')
| >>> cube['my_renamed_array']
| pyvista_ndarray([0, 1, 2, 3, 4, 5, 6, 7])
|
| rotate_vector(self, vector: 'Iterable[float]', angle: 'float', point=(0.0, 0.0, 0.0), transform_all_input_vectors=False, inplace=False)
| Rotate mesh about a vector.
|
| .. note::
| See also the notes at :func:`transform()
| <DataSetFilters.transform>` which is used by this filter
| under the hood.
|
| Parameters
| ----------
| vector : sequence[float]
| Axis to rotate about.
|
| angle : float
| Angle in degrees to rotate about the vector.
|
| point : sequence[float], default: (0.0, 0.0, 0.0)
| Point to rotate about. Defaults to origin.
|
| transform_all_input_vectors : bool, default: False
| When ``True``, all input vectors are
| transformed. Otherwise, only the points, normals and
| active vectors are transformed.
|
| inplace : bool, default: False
| Updates mesh in-place.
|
| Returns
| -------
| pyvista.DataSet
| Rotated dataset.
|
| Examples
| --------
| Rotate a mesh 30 degrees about the ``(1, 1, 1)`` axis.
|
| >>> import pyvista
| >>> mesh = pyvista.Cube()
| >>> rot = mesh.rotate_vector((1, 1, 1), 30, inplace=False)
|
| Plot the rotated mesh.
|
| >>> pl = pyvista.Plotter()
| >>> _ = pl.add_mesh(rot)
| >>> _ = pl.add_mesh(mesh, style='wireframe', line_width=3)
| >>> _ = pl.add_axes_at_origin()
| >>> pl.show()
|
| rotate_x(self, angle: 'float', point=(0.0, 0.0, 0.0), transform_all_input_vectors=False, inplace=False)
| Rotate mesh about the x-axis.
|
| .. note::
| See also the notes at :func:`transform()
| <DataSetFilters.transform>` which is used by this filter
| under the hood.
|
| Parameters
| ----------
| angle : float
| Angle in degrees to rotate about the x-axis.
|
| point : sequence[float], default: (0.0, 0.0, 0.0)
| Point to rotate about. Defaults to origin.
|
| transform_all_input_vectors : bool, default: False
| When ``True``, all input vectors are
| transformed. Otherwise, only the points, normals and
| active vectors are transformed.
|
| inplace : bool, default: False
| Updates mesh in-place.
|
| Returns
| -------
| pyvista.DataSet
| Rotated dataset.
|
| Examples
| --------
| Rotate a mesh 30 degrees about the x-axis.
|
| >>> import pyvista
| >>> mesh = pyvista.Cube()
| >>> rot = mesh.rotate_x(30, inplace=False)
|
| Plot the rotated mesh.
|
| >>> pl = pyvista.Plotter()
| >>> _ = pl.add_mesh(rot)
| >>> _ = pl.add_mesh(mesh, style='wireframe', line_width=3)
| >>> _ = pl.add_axes_at_origin()
| >>> pl.show()
|
| rotate_y(self, angle: 'float', point=(0.0, 0.0, 0.0), transform_all_input_vectors=False, inplace=False)
| Rotate mesh about the y-axis.
|
| .. note::
| See also the notes at :func:`transform()
| <DataSetFilters.transform>` which is used by this filter
| under the hood.
|
| Parameters
| ----------
| angle : float
| Angle in degrees to rotate about the y-axis.
|
| point : sequence[float], default: (0.0, 0.0, 0.0)
| Point to rotate about.
|
| transform_all_input_vectors : bool, default: False
| When ``True``, all input vectors are transformed. Otherwise, only
| the points, normals and active vectors are transformed.
|
| inplace : bool, default: False
| Updates mesh in-place.
|
| Returns
| -------
| pyvista.DataSet
| Rotated dataset.
|
| Examples
| --------
| Rotate a cube 30 degrees about the y-axis.
|
| >>> import pyvista
| >>> mesh = pyvista.Cube()
| >>> rot = mesh.rotate_y(30, inplace=False)
|
| Plot the rotated mesh.
|
| >>> pl = pyvista.Plotter()
| >>> _ = pl.add_mesh(rot)
| >>> _ = pl.add_mesh(mesh, style='wireframe', line_width=3)
| >>> _ = pl.add_axes_at_origin()
| >>> pl.show()
|
| rotate_z(self, angle: 'float', point=(0.0, 0.0, 0.0), transform_all_input_vectors=False, inplace=False)
| Rotate mesh about the z-axis.
|
| .. note::
| See also the notes at :func:`transform()
| <DataSetFilters.transform>` which is used by this filter
| under the hood.
|
| Parameters
| ----------
| angle : float
| Angle in degrees to rotate about the z-axis.
|
| point : sequence[float], default: (0.0, 0.0, 0.0)
| Point to rotate about. Defaults to origin.
|
| transform_all_input_vectors : bool, default: False
| When ``True``, all input vectors are
| transformed. Otherwise, only the points, normals and
| active vectors are transformed.
|
| inplace : bool, default: False
| Updates mesh in-place.
|
| Returns
| -------
| pyvista.DataSet
| Rotated dataset.
|
| Examples
| --------
| Rotate a mesh 30 degrees about the z-axis.
|
| >>> import pyvista
| >>> mesh = pyvista.Cube()
| >>> rot = mesh.rotate_z(30, inplace=False)
|
| Plot the rotated mesh.
|
| >>> pl = pyvista.Plotter()
| >>> _ = pl.add_mesh(rot)
| >>> _ = pl.add_mesh(mesh, style='wireframe', line_width=3)
| >>> _ = pl.add_axes_at_origin()
| >>> pl.show()
|
| scale(self, xyz: 'Union[Number, list, tuple, np.ndarray]', transform_all_input_vectors=False, inplace=False)
| Scale the mesh.
|
| .. note::
| See also the notes at :func:`transform()
| <DataSetFilters.transform>` which is used by this filter
| under the hood.
|
| Parameters
| ----------
| xyz : float | sequence[float]
| A scalar or length 3 sequence defining the scale factors along x,
| y, and z. If a scalar, the same uniform scale is used along all
| three axes.
|
| transform_all_input_vectors : bool, default: False
| When ``True``, all input vectors are transformed. Otherwise, only
| the points, normals and active vectors are transformed.
|
| inplace : bool, default: False
| Updates mesh in-place.
|
| Returns
| -------
| pyvista.DataSet
| Scaled dataset.
|
| Examples
| --------
| >>> import pyvista
| >>> from pyvista import examples
| >>> pl = pyvista.Plotter(shape=(1, 2))
| >>> pl.subplot(0, 0)
| >>> pl.show_axes()
| >>> _ = pl.show_grid()
| >>> mesh1 = examples.download_teapot()
| >>> _ = pl.add_mesh(mesh1)
| >>> pl.subplot(0, 1)
| >>> pl.show_axes()
| >>> _ = pl.show_grid()
| >>> mesh2 = mesh1.scale([10.0, 10.0, 10.0], inplace=False)
| >>> _ = pl.add_mesh(mesh2)
| >>> pl.show(cpos="xy")
|
| set_active_scalars(self, name: 'Optional[str]', preference='cell')
| Find the scalars by name and appropriately sets it as active.
|
| To deactivate any active scalars, pass ``None`` as the ``name``.
|
| Parameters
| ----------
| name : str, optional
| Name of the scalars array to assign as active. If
| ``None``, deactivates active scalars for both point and
| cell data.
|
| preference : str, default: "cell"
| If there are two arrays of the same name associated with
| points or cells, it will prioritize an array matching this
| type. Can be either ``'cell'`` or ``'point'``.
|
| Returns
| -------
| pyvista.core.utilities.arrays.FieldAssociation
| Association of the scalars matching ``name``.
|
| numpy.ndarray
| An array from the dataset matching ``name``.
|
| set_active_tensors(self, name: 'Optional[str]', preference='point')
| Find the tensors by name and appropriately sets it as active.
|
| To deactivate any active tensors, pass ``None`` as the ``name``.
|
| Parameters
| ----------
| name : str, optional
| Name of the tensors array to assign as active.
|
| preference : str, default: "point"
| If there are two arrays of the same name associated with
| points, cells, or field data, it will prioritize an array
| matching this type. Can be either ``'cell'``,
| ``'field'``, or ``'point'``.
|
| set_active_vectors(self, name: 'Optional[str]', preference='point')
| Find the vectors by name and appropriately sets it as active.
|
| To deactivate any active vectors, pass ``None`` as the ``name``.
|
| Parameters
| ----------
| name : str, optional
| Name of the vectors array to assign as active.
|
| preference : str, default: "point"
| If there are two arrays of the same name associated with
| points, cells, or field data, it will prioritize an array
| matching this type. Can be either ``'cell'``,
| ``'field'``, or ``'point'``.
|
| ----------------------------------------------------------------------
| Readonly properties inherited from pyvista.core.dataset.DataSet:
|
| active_normals
| Return the active normals as an array.
|
| Returns
| -------
| pyvista_ndarray
| Active normals of this dataset.
|
| Notes
| -----
| If both point and cell normals exist, this returns point
| normals by default.
|
| Examples
| --------
| Compute normals on an example sphere mesh and return the
| active normals for the dataset. Show that this is the same size
| as the number of points.
|
| >>> import pyvista
| >>> mesh = pyvista.Sphere()
| >>> mesh = mesh.compute_normals()
| >>> normals = mesh.active_normals
| >>> normals.shape
| (842, 3)
| >>> mesh.n_points
| 842
|
| active_scalars
| Return the active scalars as an array.
|
| Returns
| -------
| Optional[pyvista_ndarray]
| Active scalars as an array.
|
| active_scalars_info
| Return the active scalar's association and name.
|
| Association refers to the data association (e.g. point, cell, or
| field) of the active scalars.
|
| Returns
| -------
| ActiveArrayInfo
| The scalars info in an object with namedtuple semantics,
| with attributes ``association`` and ``name``.
|
| Notes
| -----
| If both cell and point scalars are present and neither have
| been set active within at the dataset level, point scalars
| will be made active.
|
| Examples
| --------
| Create a mesh, add scalars to the mesh, and return the active
| scalars info. Note how when the scalars are added, they
| automatically become the active scalars.
|
| >>> import pyvista
| >>> mesh = pyvista.Sphere()
| >>> mesh['Z Height'] = mesh.points[:, 2]
| >>> mesh.active_scalars_info
| ActiveArrayInfoTuple(association=<FieldAssociation.POINT: 0>, name='Z Height')
|
| active_tensors
| Return the active tensors array.
|
| Returns
| -------
| Optional[np.ndarray]
| Active tensors array.
|
| active_tensors_info
| Return the active tensor's field and name: [field, name].
|
| Returns
| -------
| ActiveArrayInfo
| Active tensor's field and name: [field, name].
|
| active_vectors
| Return the active vectors array.
|
| Returns
| -------
| Optional[pyvista_ndarray]
| Active vectors array.
|
| Examples
| --------
| Create a mesh, compute the normals inplace, and return the
| normals vector array.
|
| >>> import pyvista
| >>> mesh = pyvista.Sphere()
| >>> _ = mesh.compute_normals(inplace=True)
| >>> mesh.active_vectors # doctest:+SKIP
| pyvista_ndarray([[-2.48721432e-10, -1.08815623e-09, -1.00000000e+00],
| [-2.48721432e-10, -1.08815623e-09, 1.00000000e+00],
| [-1.18888125e-01, 3.40539310e-03, -9.92901802e-01],
| ...,
| [-3.11940581e-01, -6.81432486e-02, 9.47654784e-01],
| [-2.09880397e-01, -4.65070531e-02, 9.76620376e-01],
| [-1.15582108e-01, -2.80492082e-02, 9.92901802e-01]],
| dtype=float32)
|
| active_vectors_info
| Return the active vector's association and name.
|
| Association refers to the data association (e.g. point, cell, or
| field) of the active vectors.
|
| Returns
| -------
| ActiveArrayInfo
| The vectors info in an object with namedtuple semantics,
| with attributes ``association`` and ``name``.
|
| Notes
| -----
| If both cell and point vectors are present and neither have
| been set active within at the dataset level, point vectors
| will be made active.
|
| Examples
| --------
| Create a mesh, compute the normals inplace, set the active
| vectors to the normals, and show that the active vectors are
| the ``'Normals'`` array associated with points.
|
| >>> import pyvista
| >>> mesh = pyvista.Sphere()
| >>> _ = mesh.compute_normals(inplace=True)
| >>> mesh.active_vectors_name = 'Normals'
| >>> mesh.active_vectors_info
| ActiveArrayInfoTuple(association=<FieldAssociation.POINT: 0>, name='Normals')
|
| area
| Return the mesh area if 2D.
|
| This will return 0 for meshes with 3D cells.
|
| Returns
| -------
| float
| Total area of the mesh.
|
| Examples
| --------
| Get the area of a square of size 2x2.
| Note 5 points in each direction.
|
| >>> import pyvista as pv
| >>> mesh = pv.ImageData(dimensions=(5, 5, 1))
| >>> mesh.area
| 16.0
|
| A mesh with 3D cells does not have an area. To get
| the outer surface area, first extract the surface using
| :func:`pyvista.DataSetFilters.extract_surface`.
|
| >>> mesh = pv.ImageData(dimensions=(5, 5, 5))
| >>> mesh.area
| 0.0
|
| Get the area of a sphere.
|
| >>> mesh = pv.Sphere()
| >>> mesh.volume
| 0.51825
|
| array_names
| Return a list of array names for the dataset.
|
| This makes sure to put the active scalars' name first in the list.
|
| Returns
| -------
| List[str]
| List of array names for the dataset.
|
| Examples
| --------
| Return the array names for a mesh.
|
| >>> import pyvista
| >>> mesh = pyvista.Sphere()
| >>> mesh.point_data['my_array'] = range(mesh.n_points)
| >>> mesh.array_names
| ['my_array', 'Normals']
|
| arrows
| Return a glyph representation of the active vector data as arrows.
|
| Arrows will be located at the points of the mesh and
| their size will be dependent on the norm of the vector.
| Their direction will be the "direction" of the vector
|
| Returns
| -------
| pyvista.PolyData
| Active vectors represented as arrows.
|
| Examples
| --------
| Create a mesh, compute the normals and set them active, and
| plot the active vectors.
|
| >>> import pyvista
| >>> mesh = pyvista.Cube()
| >>> mesh_w_normals = mesh.compute_normals()
| >>> mesh_w_normals.active_vectors_name = 'Normals'
| >>> arrows = mesh_w_normals.arrows
| >>> arrows.plot(show_scalar_bar=False)
|
| bounds
| Return the bounding box of this dataset.
|
| Returns
| -------
| BoundsLike
| Bounding box of this dataset.
| The form is: ``(xmin, xmax, ymin, ymax, zmin, zmax)``.
|
| Examples
| --------
| Create a cube and return the bounds of the mesh.
|
| >>> import pyvista
| >>> cube = pyvista.Cube()
| >>> cube.bounds
| (-0.5, 0.5, -0.5, 0.5, -0.5, 0.5)
|
| cell
| A generator that provides an easy way to loop over all cells.
|
| To access a single cell, use :func:`pyvista.DataSet.get_cell`.
|
| .. versionchanged:: 0.39.0
| Now returns a generator instead of a list.
| Use ``get_cell(i)`` instead of ``cell[i]``.
|
| Yields
| ------
| pyvista.Cell
|
| See Also
| --------
| pyvista.DataSet.get_cell
|
| Examples
| --------
| Loop over the cells
|
| >>> import pyvista as pv
| >>> # Create a grid with 9 points and 4 cells
| >>> mesh = pv.ImageData(dimensions=(3, 3, 1))
| >>> for cell in mesh.cell: # doctest: +SKIP
| ... cell
| ...
|
| cell_data
| Return cell data as DataSetAttributes.
|
| Returns
| -------
| DataSetAttributes
| Cell data as DataSetAttributes.
|
| Examples
| --------
| Add cell arrays to a mesh and list the available ``cell_data``.
|
| >>> import pyvista
| >>> import numpy as np
| >>> mesh = pyvista.Cube()
| >>> mesh.clear_data()
| >>> mesh.cell_data['my_array'] = np.random.random(mesh.n_cells)
| >>> mesh.cell_data['my_other_array'] = np.arange(mesh.n_cells)
| >>> mesh.cell_data
| pyvista DataSetAttributes
| Association : CELL
| Active Scalars : my_array
| Active Vectors : None
| Active Texture : None
| Active Normals : None
| Contains arrays :
| my_array float64 (6,) SCALARS
| my_other_array int64 (6,)
|
| Access an array from ``cell_data``.
|
| >>> mesh.cell_data['my_other_array']
| pyvista_ndarray([0, 1, 2, 3, 4, 5])
|
| Or access it directly from the mesh.
|
| >>> mesh['my_array'].shape
| (6,)
|
| center
| Return the center of the bounding box.
|
| Returns
| -------
| Vector :
| Center of the bounding box.
|
| Examples
| --------
| Get the center of a mesh.
|
| >>> import pyvista
| >>> mesh = pyvista.Sphere(center=(1, 2, 0))
| >>> mesh.center
| [1.0, 2.0, 0.0]
|
| length
| Return the length of the diagonal of the bounding box.
|
| Returns
| -------
| float :
| Length of the diagonal of the bounding box.
|
| Examples
| --------
| Get the length of the bounding box of a cube. This should
| match ``3**(1/2)`` since it is the diagonal of a cube that is
| ``1 x 1 x 1``.
|
| >>> import pyvista
| >>> mesh = pyvista.Cube()
| >>> mesh.length
| 1.7320508075688772
|
| n_arrays
| Return the number of arrays present in the dataset.
|
| Returns
| -------
| int
| Number of arrays present in the dataset.
|
| n_cells
| Return the number of cells in the entire dataset.
|
| Returns
| -------
| int :
| Number of cells in the entire dataset.
|
| Notes
| -----
| This is identical to :attr:`n_faces <pyvista.PolyData.n_faces>`
| in :class:`pyvista.PolyData`.
|
| Examples
| --------
| Create a mesh and return the number of cells in the
| mesh.
|
| >>> import pyvista
| >>> cube = pyvista.Cube()
| >>> cube.n_cells
| 6
|
| n_points
| Return the number of points in the entire dataset.
|
| Returns
| -------
| int
| Number of points in the entire dataset.
|
| Examples
| --------
| Create a mesh and return the number of points in the
| mesh.
|
| >>> import pyvista
| >>> cube = pyvista.Cube()
| >>> cube.n_points
| 8
|
| number_of_cells
| Return the number of cells.
|
| Returns
| -------
| int :
| Number of cells.
|
| number_of_points
| Return the number of points.
|
| Returns
| -------
| int :
| Number of points.
|
| point_data
| Return point data as DataSetAttributes.
|
| Returns
| -------
| DataSetAttributes
| Point data as DataSetAttributes.
|
| Examples
| --------
| Add point arrays to a mesh and list the available ``point_data``.
|
| >>> import pyvista
| >>> import numpy as np
| >>> mesh = pyvista.Cube()
| >>> mesh.clear_data()
| >>> mesh.point_data['my_array'] = np.random.random(mesh.n_points)
| >>> mesh.point_data['my_other_array'] = np.arange(mesh.n_points)
| >>> mesh.point_data
| pyvista DataSetAttributes
| Association : POINT
| Active Scalars : my_array
| Active Vectors : None
| Active Texture : None
| Active Normals : None
| Contains arrays :
| my_array float64 (8,) SCALARS
| my_other_array int64 (8,)
|
| Access an array from ``point_data``.
|
| >>> mesh.point_data['my_other_array']
| pyvista_ndarray([0, 1, 2, 3, 4, 5, 6, 7])
|
| Or access it directly from the mesh.
|
| >>> mesh['my_array'].shape
| (8,)
|
| ----------------------------------------------------------------------
| Data descriptors inherited from pyvista.core.dataset.DataSet:
|
| active_scalars_name
| Return the name of the active scalars.
|
| Returns
| -------
| str
| Name of the active scalars.
|
| Examples
| --------
| Create a mesh, add scalars to the mesh, and return the name of
| the active scalars.
|
| >>> import pyvista
| >>> mesh = pyvista.Sphere()
| >>> mesh['Z Height'] = mesh.points[:, 2]
| >>> mesh.active_scalars_name
| 'Z Height'
|
| active_t_coords
| Return the active texture coordinates on the points.
|
| Returns
| -------
| Optional[pyvista_ndarray]
| Active texture coordinates on the points.
|
| Examples
| --------
| Return the active texture coordinates from the globe example.
|
| >>> from pyvista import examples
| >>> globe = examples.load_globe()
| >>> globe.active_t_coords
| pyvista_ndarray([[0. , 0. ],
| [0. , 0.07142857],
| [0. , 0.14285714],
| ...,
| [1. , 0.85714286],
| [1. , 0.92857143],
| [1. , 1. ]])
|
| active_tensors_name
| Return the name of the active tensor array.
|
| Returns
| -------
| str
| Name of the active tensor array.
|
| active_vectors_name
| Return the name of the active vectors array.
|
| Returns
| -------
| str
| Name of the active vectors array.
|
| Examples
| --------
| Create a mesh, compute the normals, set them as active, and
| return the name of the active vectors.
|
| >>> import pyvista
| >>> mesh = pyvista.Sphere()
| >>> mesh_w_normals = mesh.compute_normals()
| >>> mesh_w_normals.active_vectors_name = 'Normals'
| >>> mesh_w_normals.active_vectors_name
| 'Normals'
|
| points
| Return a reference to the points as a numpy object.
|
| Returns
| -------
| pyvista_ndarray
| Reference to the points as a numpy object.
|
| Examples
| --------
| Create a mesh and return the points of the mesh as a numpy
| array.
|
| >>> import pyvista
| >>> cube = pyvista.Cube()
| >>> points = cube.points
| >>> points
| pyvista_ndarray([[-0.5, -0.5, -0.5],
| [-0.5, -0.5, 0.5],
| [-0.5, 0.5, 0.5],
| [-0.5, 0.5, -0.5],
| [ 0.5, -0.5, -0.5],
| [ 0.5, 0.5, -0.5],
| [ 0.5, 0.5, 0.5],
| [ 0.5, -0.5, 0.5]], dtype=float32)
|
| Shift these points in the z direction and show that their
| position is reflected in the mesh points.
|
| >>> points[:, 2] += 1
| >>> cube.points
| pyvista_ndarray([[-0.5, -0.5, 0.5],
| [-0.5, -0.5, 1.5],
| [-0.5, 0.5, 1.5],
| [-0.5, 0.5, 0.5],
| [ 0.5, -0.5, 0.5],
| [ 0.5, 0.5, 0.5],
| [ 0.5, 0.5, 1.5],
| [ 0.5, -0.5, 1.5]], dtype=float32)
|
| You can also update the points in-place:
|
| >>> cube.points[...] = 2 * points
| >>> cube.points
| pyvista_ndarray([[-1., -1., 1.],
| [-1., -1., 3.],
| [-1., 1., 3.],
| [-1., 1., 1.],
| [ 1., -1., 1.],
| [ 1., 1., 1.],
| [ 1., 1., 3.],
| [ 1., -1., 3.]], dtype=float32)
|
| ----------------------------------------------------------------------
| Methods inherited from pyvista.core.filters.poly_data.PolyDataFilters:
|
| __add__(self, dataset)
| Merge these two meshes.
|
| __iadd__(self, dataset)
| Merge another mesh into this one if possible.
|
| "If possible" means that ``dataset`` is also a :class:`PolyData`.
| Otherwise we have to return a :class:`pyvista.UnstructuredGrid`,
| so the in-place merge attempt will raise.
|
| append_polydata(self, *meshes, inplace=False, progress_bar=False)
| Append one or more PolyData into this one.
|
| Under the hood, the VTK `vtkAppendPolyDataFilter
| <https://vtk.org/doc/nightly/html/classvtkAppendPolyData.html#details>`_ filter is used to perform the
| append operation.
|
| .. versionadded:: 0.40.0
|
| .. note::
| As stated in the VTK documentation of `vtkAppendPolyDataFilter
| <https://vtk.org/doc/nightly/html/classvtkAppendPolyData.html#details>`_,
| point and cell data are added to the output PolyData **only** if they are present across **all**
| input PolyData.
|
| .. seealso::
| :func:`pyvista.PolyDataFilters.merge`
|
| Parameters
| ----------
| *meshes : list[pyvista.PolyData]
| The PolyData(s) to append with the current one.
|
| inplace : bool, default: False
| Whether to update the mesh in-place.
|
| progress_bar : bool, default: False
| Display a progress bar to indicate progress.
|
| Returns
| -------
| pyvista.PolyData
| Appended PolyData(s).
|
| Examples
| --------
| >>> import pyvista as pv
| >>> sp0 = pv.Sphere()
| >>> sp1 = sp0.translate((1, 0, 0))
| >>> appended = sp0.append_polydata(sp1)
| >>> appended.plot()
|
| Append more than one PolyData.
|
| >>> sp2 = sp0.translate((-1, 0, 0))
| >>> appended = sp0.append_polydata(sp1, sp2)
| >>> appended.plot()
|
| boolean_add(self, *args, **kwargs)
| Merge two meshes together.
|
| .. deprecated:: 0.32.0
| Use :func:`PolyDataFilters.merge` instead.
|
| boolean_cut(self, *args, **kwargs)
| Cut two meshes.
|
| .. deprecated:: 0.32.0
| Use :func:`PolyDataFilters.boolean_difference` instead.
|
| boolean_difference(self, other_mesh, tolerance=1e-05, progress_bar=False)
| Perform a boolean difference operation between two meshes.
|
| Essentially, boolean union, difference, and intersection are
| all the same operation. Just different parts of the objects
| are kept at the end.
|
| The difference of two manifold meshes ``A`` and ``B`` is the
| volume of the mesh in ``A`` not belonging to ``B``.
|
| .. note::
| If your boolean operations don't react the way you think they
| should (i.e. the wrong parts disappear), one of your meshes
| probably has its normals pointing inward. Use
| :func:`PolyDataFilters.plot_normals` to visualize the
| normals.
|
| .. note::
| Both meshes must be composed of all triangles. Check with
| :attr:`PolyData.is_all_triangles` and convert with
| :func:`PolyDataFilters.triangulate`.
|
| .. versionchanged:: 0.32.0
| Behavior changed to match default VTK behavior.
|
| Parameters
| ----------
| other_mesh : pyvista.PolyData
| Mesh operating on the source mesh.
|
| tolerance : float, default: 1e-5
| Tolerance used to determine when a point's absolute
| distance is considered to be zero.
|
| progress_bar : bool, default: False
| Display a progress bar to indicate progress.
|
| Returns
| -------
| pyvista.PolyData
| The result of the boolean operation.
|
| Examples
| --------
| Demonstrate a boolean difference with two spheres. Note how
| the final mesh only includes ``sphere_a``.
|
| >>> import pyvista
| >>> sphere_a = pyvista.Sphere()
| >>> sphere_b = pyvista.Sphere(center=(0.5, 0, 0))
| >>> result = sphere_a.boolean_difference(sphere_b)
| >>> pl = pyvista.Plotter()
| >>> _ = pl.add_mesh(
| ... sphere_a, color='r', style='wireframe', line_width=3
| ... )
| >>> _ = pl.add_mesh(
| ... sphere_b, color='b', style='wireframe', line_width=3
| ... )
| >>> _ = pl.add_mesh(result, color='lightblue')
| >>> pl.camera_position = 'xz'
| >>> pl.show()
|
| See :ref:`boolean_example` for more examples using this filter.
|
| boolean_intersection(self, other_mesh, tolerance=1e-05, progress_bar=False)
| Perform a boolean intersection operation on two meshes.
|
| Essentially, boolean union, difference, and intersection are
| all the same operation. Just different parts of the objects
| are kept at the end.
|
| The intersection of two manifold meshes ``A`` and ``B`` is the mesh
| which is the volume of ``A`` that is also in ``B``.
|
| .. note::
| If your boolean operations don't react the way you think they
| should (i.e. the wrong parts disappear), one of your meshes
| probably has its normals pointing inward. Use
| :func:`PolyDataFilters.plot_normals` to visualize the
| normals.
|
| .. note::
| This method returns the "volume" intersection between two
| meshes whereas the :func:`PolyDataFilters.intersection`
| filter returns the surface intersection between two meshes
| (which often resolves as a line).
|
|
| .. note::
| Both meshes must be composed of all triangles. Check with
| :attr:`PolyData.is_all_triangles` and convert with
| :func:`PolyDataFilters.triangulate`.
|
| .. versionadded:: 0.32.0
|
| Parameters
| ----------
| other_mesh : pyvista.PolyData
| Mesh operating on the source mesh.
|
| tolerance : float, default: 1e-5
| Tolerance used to determine when a point's absolute
| distance is considered to be zero.
|
| progress_bar : bool, default: False
| Display a progress bar to indicate progress.
|
| Returns
| -------
| pyvista.PolyData
| The result of the boolean operation.
|
| Examples
| --------
| Demonstrate a boolean intersection with two spheres. Note how
| the final mesh only includes the intersection of the two.
|
| >>> import pyvista
| >>> sphere_a = pyvista.Sphere()
| >>> sphere_b = pyvista.Sphere(center=(0.5, 0, 0))
| >>> result = sphere_a.boolean_intersection(sphere_b)
| >>> pl = pyvista.Plotter()
| >>> _ = pl.add_mesh(
| ... sphere_a, color='r', style='wireframe', line_width=3
| ... )
| >>> _ = pl.add_mesh(
| ... sphere_b, color='b', style='wireframe', line_width=3
| ... )
| >>> _ = pl.add_mesh(result, color='lightblue')
| >>> pl.camera_position = 'xz'
| >>> pl.show()
|
| See :ref:`boolean_example` for more examples using this filter.
|
| boolean_union(self, other_mesh, tolerance=1e-05, progress_bar=False)
| Perform a boolean union operation on two meshes.
|
| Essentially, boolean union, difference, and intersection are
| all the same operation. Just different parts of the objects
| are kept at the end.
|
| The union of two manifold meshes ``A`` and ``B`` is the mesh
| which is in ``A``, in ``B``, or in both ``A`` and ``B``.
|
| .. note::
| If your boolean operations don't react the way you think they
| should (i.e. the wrong parts disappear), one of your meshes
| probably has its normals pointing inward. Use
| :func:`PolyDataFilters.plot_normals` to visualize the
| normals.
|
| .. note::
| The behavior of this filter varies from the
| :func:`PolyDataFilters.merge` filter. This filter attempts
| to create a manifold mesh and will not include internal
| surfaces when two meshes overlap.
|
| .. note::
| Both meshes must be composed of all triangles. Check with
| :attr:`PolyData.is_all_triangles` and convert with
| :func:`PolyDataFilters.triangulate`.
|
| .. versionchanged:: 0.32.0
| Behavior changed to match default VTK behavior.
|
| Parameters
| ----------
| other_mesh : pyvista.PolyData
| Mesh operating on the source mesh.
|
| tolerance : float, tolerance: 1e-5
| Tolerance used to determine when a point's absolute
| distance is considered to be zero.
|
| progress_bar : bool, default: False
| Display a progress bar to indicate progress.
|
| Returns
| -------
| pyvista.PolyData
| The result of the boolean operation.
|
| Examples
| --------
| Demonstrate a boolean union with two spheres. Note how the
| final mesh includes both spheres.
|
| >>> import pyvista
| >>> sphere_a = pyvista.Sphere()
| >>> sphere_b = pyvista.Sphere(center=(0.5, 0, 0))
| >>> result = sphere_a.boolean_union(sphere_b)
| >>> pl = pyvista.Plotter()
| >>> _ = pl.add_mesh(
| ... sphere_a, color='r', style='wireframe', line_width=3
| ... )
| >>> _ = pl.add_mesh(
| ... sphere_b, color='b', style='wireframe', line_width=3
| ... )
| >>> _ = pl.add_mesh(result, color='lightblue')
| >>> pl.camera_position = 'xz'
| >>> pl.show()
|
| See :ref:`boolean_example` for more examples using this filter.
|
| clean(self, point_merging=True, tolerance=None, lines_to_points=True, polys_to_lines=True, strips_to_polys=True, inplace=False, absolute=True, progress_bar=False, **kwargs)
| Clean the mesh.
|
| This merges duplicate points, removes unused points, and/or
| removes degenerate cells.
|
| Parameters
| ----------
| point_merging : bool, optional
| Enables point merging. ``True`` by default.
|
| tolerance : float, optional
| Set merging tolerance. When enabled merging is set to
| absolute distance. If ``absolute`` is ``False``, then the
| merging tolerance is a fraction of the bounding box
| length. The alias ``merge_tol`` is also excepted.
|
| lines_to_points : bool, optional
| Enable or disable the conversion of degenerate lines to
| points. Enabled by default.
|
| polys_to_lines : bool, optional
| Enable or disable the conversion of degenerate polys to
| lines. Enabled by default.
|
| strips_to_polys : bool, optional
| Enable or disable the conversion of degenerate strips to
| polys.
|
| inplace : bool, default: False
| Updates mesh in-place.
|
| absolute : bool, optional
| Control if ``tolerance`` is an absolute distance or a
| fraction.
|
| progress_bar : bool, default: False
| Display a progress bar to indicate progress.
|
| **kwargs : dict, optional
| Accepts for ``merge_tol`` to replace the ``tolerance``
| keyword argument. This may be deprecated in future.
|
| Returns
| -------
| pyvista.PolyData
| Cleaned mesh.
|
| Examples
| --------
| Create a mesh with a degenerate face and then clean it,
| removing the degenerate face
|
| >>> import pyvista as pv
| >>> import numpy as np
| >>> points = np.array(
| ... [[0, 0, 0], [0, 1, 0], [1, 0, 0]], dtype=np.float32
| ... )
| >>> faces = np.array([3, 0, 1, 2, 3, 0, 2, 2])
| >>> mesh = pv.PolyData(points, faces)
| >>> mout = mesh.clean()
| >>> mout.faces # doctest:+SKIP
| array([3, 0, 1, 2])
|
| clip_closed_surface(self, normal='x', origin=None, tolerance=1e-06, inplace=False, progress_bar=False)
| Clip a closed polydata surface with a plane.
|
| This currently only supports one plane but could be
| implemented to handle a plane collection.
|
| It will produce a new closed surface by creating new polygonal
| faces where the input data was clipped.
|
| Non-manifold surfaces should not be used as input for this
| filter. The input surface should have no open edges, and must
| not have any edges that are shared by more than two faces. In
| addition, the input surface should not self-intersect, meaning
| that the faces of the surface should only touch at their
| edges.
|
| Parameters
| ----------
| normal : str, list, optional
| Plane normal to clip with. Plane is centered at
| ``origin``. Normal can be either a 3 member list
| (e.g. ``[0, 0, 1]``) or one of the following strings:
| ``'x'``, ``'y'``, ``'z'``, ``'-x'``, ``'-y'``, or
| ``'-z'``.
|
| origin : list, optional
| Coordinate of the origin (e.g. ``[1, 0, 0]``). Defaults
| to the center of the mesh.
|
| tolerance : float, optional
| The tolerance for creating new points while clipping. If
| the tolerance is too small, then degenerate triangles
| might be produced.
|
| inplace : bool, default: False
| Updates mesh in-place.
|
| progress_bar : bool, default: False
| Display a progress bar to indicate progress.
|
| Returns
| -------
| pyvista.PolyData
| The clipped mesh.
|
| Examples
| --------
| Clip a sphere in the X direction centered at the origin. This
| will leave behind half a sphere in the positive X direction.
|
| >>> import pyvista as pv
| >>> sphere = pv.Sphere()
| >>> clipped_mesh = sphere.clip_closed_surface('-z')
| >>> clipped_mesh.plot(show_edges=True, line_width=3)
|
| Clip the sphere at the XY plane and leave behind half the
| sphere in the positive Z direction. Shift the clip upwards to
| leave a smaller mesh behind.
|
| >>> clipped_mesh = sphere.clip_closed_surface(
| ... 'z', origin=[0, 0, 0.3]
| ... )
| >>> clipped_mesh.plot(show_edges=True, line_width=3)
|
| collision(self, other_mesh, contact_mode=0, box_tolerance=0.001, cell_tolerance=0.0, n_cells_per_node=2, generate_scalars=False, progress_bar=False)
| Perform collision determination between two polyhedral surfaces.
|
| If ``collision_mode`` is set to all contacts, the output will
| be lines of contact. If ``collision_mode`` is first contact or half
| contacts then the Contacts output will be vertices.
|
| .. warning::
| Currently only triangles are processed. Use
| :func:`PolyDataFilters.triangulate` to convert any strips
| or polygons to triangles. Otherwise, the mesh will be
| converted for you within this method.
|
| Parameters
| ----------
| other_mesh : pyvista.DataSet
| Other mesh to test collision with. If the other mesh is
| not a surface, its external surface will be extracted and
| triangulated.
|
| contact_mode : int, default: 0
| Contact mode. One of the following:
|
| * 0 - All contacts. Find all the contacting cell pairs
| with two points per collision
| * 1 - First contact. Quickly find the first contact point.
| * 2 - Half contacts. Find all the contacting cell pairs
| with one point per collision.
|
| box_tolerance : float, default: 0.001
| Oriented bounding box (OBB) tree tolerance in world coordinates.
|
| cell_tolerance : float, default: 0.0
| Cell tolerance (squared value).
|
| n_cells_per_node : int, default: 2
| Number of cells in each OBB.
|
| generate_scalars : bool, default: False
| Flag to visualize the contact cells. If ``True``, the
| contacting cells will be colored from red through blue,
| with collisions first determined colored red. This array
| is stored as ``"collision_rgba"``.
|
| .. note::
| This will remove any other cell arrays in the mesh.
|
| progress_bar : bool, default: False
| Display a progress bar to indicate progress.
|
| Returns
| -------
| pyvista.PolyData
| Mesh containing collisions in the ``field_data``
| attribute named ``"ContactCells"``. Array only exists
| when there are collisions.
|
| int
| Number of collisions.
|
| Notes
| -----
| Due to the nature of the `vtk.vtkCollisionDetectionFilter
| <https://vtk.org/doc/nightly/html/classvtkCollisionDetectionFilter.html>`_,
| repeated uses of this method will be slower that using the
| ``vtk.vtkCollisionDetectionFilter`` directly. The first
| update of the filter creates two instances of `vtkOBBTree
| <https://vtk.org/doc/nightly/html/classvtkOBBTree.html>`_,
| which can be subsequently updated by modifying the transform or
| matrix of the input meshes.
|
| This method assumes no transform and is easier to use for
| single collision tests, but it is recommended to use a
| combination of ``pyvista`` and ``vtk`` for rapidly computing
| repeated collisions. See the `Collision Detection Example
| <https://kitware.github.io/vtk-examples/site/Python/Visualization/CollisionDetection/>`_
|
| Examples
| --------
| Compute the collision between a sphere and the back faces of a
| cube and output the cell indices of the first 10 collisions.
|
| >>> import numpy as np
| >>> import pyvista
| >>> mesh_a = pyvista.Sphere(radius=0.5)
| >>> mesh_b = pyvista.Cube((0.5, 0.5, 0.5)).extract_cells([0, 2, 4])
| >>> collision, ncol = mesh_a.collision(mesh_b, cell_tolerance=1)
| >>> collision['ContactCells'][:10]
| pyvista_ndarray([464, 0, 0, 29, 29, 27, 27, 28, 28, 23])
|
| Plot the collisions by creating a collision mask with the
| ``"ContactCells"`` field data. Cells with a collision are
| colored red.
|
| >>> scalars = np.zeros(collision.n_cells, dtype=bool)
| >>> scalars[collision.field_data['ContactCells']] = True
| >>> pl = pyvista.Plotter()
| >>> _ = pl.add_mesh(
| ... collision,
| ... scalars=scalars,
| ... show_scalar_bar=False,
| ... cmap='bwr',
| ... )
| >>> _ = pl.add_mesh(
| ... mesh_b,
| ... color='lightblue',
| ... line_width=5,
| ... opacity=0.7,
| ... show_edges=True,
| ... )
| >>> pl.show()
|
| Alternatively, simply plot the collisions using the default
| ``'collision_rgba'`` array after enabling ``generate_scalars``.
|
| >>> collision, ncol = mesh_a.collision(
| ... mesh_b, cell_tolerance=1, generate_scalars=True
| ... )
| >>> collision.plot()
|
| See :ref:`collision_example` for more examples using this filter.
|
| compute_arc_length(self, progress_bar=False)
| Compute the arc length over the length of the probed line.
|
| It adds a new point-data array named ``"arc_length"`` with the
| computed arc length for each of the polylines in the
| input. For all other cell types, the arc length is set to 0.
|
| Parameters
| ----------
| progress_bar : bool, default: False
| Display a progress bar to indicate progress.
|
| Returns
| -------
| float
| Arc length of the length of the probed line.
|
| Examples
| --------
| >>> import pyvista as pv
| >>> sphere = pv.Sphere()
| >>> path = sphere.geodesic(0, 100)
| >>> length = path.compute_arc_length()['arc_length'][-1]
| >>> f'Length is {length:.3f}'
| 'Length is 0.812'
|
| This is identical to the geodesic_distance.
|
| >>> length = sphere.geodesic_distance(0, 100)
| >>> f'Length is {length:.3f}'
| 'Length is 0.812'
|
| You can also plot the arc_length.
|
| >>> arc = path.compute_arc_length()
| >>> arc.plot(scalars="arc_length")
|
| compute_normals(self, cell_normals=True, point_normals=True, split_vertices=False, flip_normals=False, consistent_normals=True, auto_orient_normals=False, non_manifold_traversal=True, feature_angle=30.0, inplace=False, progress_bar=False)
| Compute point and/or cell normals for a mesh.
|
| The filter can reorder polygons to insure consistent
| orientation across polygon neighbors. Sharp edges can be split
| and points duplicated with separate normals to give crisp
| (rendered) surface definition. It is also possible to globally
| flip the normal orientation.
|
| The algorithm works by determining normals for each polygon
| and then averaging them at shared points. When sharp edges are
| present, the edges are split and new points generated to
| prevent blurry edges (due to Phong shading).
|
| Parameters
| ----------
| cell_normals : bool, default: True
| Calculation of cell normals.
|
| point_normals : bool, default: True
| Calculation of point normals.
|
| split_vertices : bool, default: False
| Splitting of sharp edges. Indices to the original points are
| tracked in the ``"pyvistaOriginalPointIds"`` array.
|
| flip_normals : bool, default: False
| Set global flipping of normal orientation. Flipping
| modifies both the normal direction and the order of a
| cell's points.
|
| consistent_normals : bool, default: True
| Enforcement of consistent polygon ordering.
|
| auto_orient_normals : bool, default: False
| Turn on/off the automatic determination of correct normal
| orientation. NOTE: This assumes a completely closed
| surface (i.e. no boundary edges) and no non-manifold
| edges. If these constraints do not hold, all bets are
| off. This option adds some computational complexity, and
| is useful if you do not want to have to inspect the
| rendered image to determine whether to turn on the
| ``flip_normals`` flag. However, this flag can work with
| the ``flip_normals`` flag, and if both are set, all the
| normals in the output will point "inward".
|
| non_manifold_traversal : bool, default: True
| Turn on/off traversal across non-manifold edges. Changing
| this may prevent problems where the consistency of
| polygonal ordering is corrupted due to topological
| loops.
|
| feature_angle : float, default: 30.0
| The angle that defines a sharp edge. If the difference in
| angle across neighboring polygons is greater than this
| value, the shared edge is considered "sharp".
|
| inplace : bool, default: False
| Updates mesh in-place.
|
| progress_bar : bool, default: False
| Display a progress bar to indicate progress.
|
| Returns
| -------
| pyvista.PolyData
| Updated mesh with cell and point normals.
|
| Notes
| -----
| Previous arrays named ``"Normals"`` will be overwritten.
|
| Normals are computed only for polygons and triangle
| strips. Normals are not computed for lines or vertices.
|
| Triangle strips are broken up into triangle polygons. You may
| want to restrip the triangles.
|
| It may be easier to run
| :func:`pyvista.PolyData.point_normals` or
| :func:`pyvista.PolyData.cell_normals` if you would just
| like the array of point or cell normals.
|
| Examples
| --------
| Compute the point normals of the surface of a sphere.
|
| >>> import pyvista as pv
| >>> sphere = pv.Sphere()
| >>> sphere = sphere.compute_normals(cell_normals=False)
| >>> normals = sphere['Normals']
| >>> normals.shape
| (842, 3)
|
| Alternatively, create a new mesh when computing the normals
| and compute both cell and point normals.
|
| >>> import pyvista as pv
| >>> sphere = pv.Sphere()
| >>> sphere_with_norm = sphere.compute_normals()
| >>> sphere_with_norm.point_data['Normals'].shape
| (842, 3)
| >>> sphere_with_norm.cell_data['Normals'].shape
| (1680, 3)
|
| See :ref:`surface_normal_example` for more examples using this filter.
|
| contour_banded(self, n_contours, rng=None, scalars=None, component=0, clip_tolerance=1e-06, generate_contour_edges=True, scalar_mode='value', clipping=True, progress_bar=False)
| Generate filled contours.
|
| Generates filled contours for vtkPolyData. Filled contours are
| bands of cells that all have the same cell scalar value, and can
| therefore be colored the same. The method is also referred to as
| filled contour generation.
|
| This filter implements `vtkBandedPolyDataContourFilter
| <https://vtk.org/doc/nightly/html/classvtkBandedPolyDataContourFilter.html>`_.
|
| Parameters
| ----------
| n_contours : int
| Number of contours.
|
| rng : Sequence, optional
| Range of the scalars. Optional and defaults to the minimum and
| maximum of the active scalars of ``scalars``.
|
| scalars : str, optional
| The name of the scalar array to use for contouring. If ``None``,
| the active scalar array will be used.
|
| component : int, default: 0
| The component to use of an input scalars array with more than one
| component.
|
| clip_tolerance : float, default: 1e-6
| Set/Get the clip tolerance. Warning: setting this too large will
| certainly cause numerical issues. Change from the default value at
| your own risk. The actual internal clip tolerance is computed by
| multiplying ``clip_tolerance`` by the scalar range.
|
| generate_contour_edges : bool, default: True
| Controls whether contour edges are generated. Contour edges are
| the edges between bands. If enabled, they are generated from
| polygons/triangle strips and returned as a second output.
|
| scalar_mode : str, default: 'value'
| Control whether the cell scalars are output as an integer index or
| a scalar value. If ``'index'``, the index refers to the bands
| produced by the clipping range. If ``'value'``, then a scalar value
| which is a value between clip values is used.
|
| clipping : bool, default: True
| Indicate whether to clip outside ``rng`` and only return cells with
| values within ``rng``.
|
| progress_bar : bool, default: False
| Display a progress bar to indicate progress.
|
| Returns
| -------
| output : pyvista.PolyData
| Surface containing the contour surface.
|
| edges : pyvista.PolyData
| Optional edges when ``generate_contour_edges`` is ``True``.
|
| Examples
| --------
| Plot the random hills dataset and with 8 contour lines. Note how we use 7
| colors here (``n_contours - 1``).
|
| >>> import pyvista as pv
| >>> from pyvista import examples
|
| >>> mesh = examples.load_random_hills()
| >>> n_contours = 8
| >>> _, edges = mesh.contour_banded(n_contours)
|
| >>> pl = pv.Plotter()
| >>> _ = pl.add_mesh(
| ... edges,
| ... line_width=5,
| ... render_lines_as_tubes=True,
| ... color='k',
| ... )
| >>> _ = pl.add_mesh(mesh, n_colors=n_contours - 1, cmap='Set3')
| >>> pl.show()
|
| Extract the surface from the uniform grid dataset and plot its contours
| alongside the output from the banded contour filter.
|
| >>> surf = examples.load_uniform().extract_surface()
| >>> n_contours = 5
| >>> rng = [200, 500]
| >>> output, edges = surf.contour_banded(n_contours, rng=rng)
|
| >>> dargs = dict(n_colors=n_contours - 1, clim=rng)
| >>> pl = pv.Plotter()
| >>> _ = pl.add_mesh(
| ... edges,
| ... line_width=5,
| ... render_lines_as_tubes=True,
| ... color='k',
| ... )
| >>> _ = pl.add_mesh(surf, opacity=0.3, **dargs)
| >>> _ = pl.add_mesh(output, **dargs)
| >>> pl.show()
|
| curvature(self, curv_type='mean', progress_bar=False)
| Return the pointwise curvature of a mesh.
|
| Parameters
| ----------
| curv_type : str, default: "mean"
| Curvature type. One of the following:
|
| * ``"mean"``
| * ``"gaussian"``
| * ``"maximum"``
| * ``"minimum"``
|
| progress_bar : bool, default: False
| Display a progress bar to indicate progress.
|
| Returns
| -------
| numpy.ndarray
| Array of curvature values.
|
| Examples
| --------
| Calculate the mean curvature of the hills example mesh and plot it.
|
| >>> from pyvista import examples
| >>> hills = examples.load_random_hills()
| >>> curv = hills.curvature()
| >>> hills.plot(scalars=curv)
|
| Show the curvature array.
|
| >>> curv # doctest:+SKIP
| array([0.20587616, 0.06747695, ..., 0.11781171, 0.15988467])
|
| decimate(self, target_reduction, volume_preservation=False, attribute_error=False, scalars=True, vectors=True, normals=False, tcoords=True, tensors=True, scalars_weight=0.1, vectors_weight=0.1, normals_weight=0.1, tcoords_weight=0.1, tensors_weight=0.1, inplace=False, progress_bar=False)
| Reduce the number of triangles in a triangular mesh using ``vtkQuadricDecimation``.
|
| Parameters
| ----------
| target_reduction : float
| Fraction of the original mesh to remove.
| If ``target_reduction`` is set to 0.9, this filter will try
| to reduce the data set to 10% of its original size and will
| remove 90% of the input triangles.
|
| volume_preservation : bool, default: False
| Decide whether to activate volume preservation which greatly
| reduces errors in triangle normal direction. If ``False``,
| volume preservation is disabled and if ``attribute_error``
| is active, these errors can be large.
|
| attribute_error : bool, default: False
| Decide whether to include data attributes in the error metric. If
| ``False``, then only geometric error is used to control the
| decimation. If ``True``, the following flags are used to specify
| which attributes are to be included in the error calculation.
|
| scalars : bool, default: True
| If attribute errors are to be included in the metric (i.e.,
| ``attribute_error`` is ``True``), then these flags control
| which attributes are to be included in the error
| calculation.
|
| vectors : bool, default: True
| See ``scalars`` parameter.
|
| normals : bool, default: False
| See ``scalars`` parameter.
|
| tcoords : bool, default: True
| See ``scalars`` parameter.
|
| tensors : bool, default: True
| See ``scalars`` parameter.
|
| scalars_weight : float, default: 0.1
| The scaling weight contribution of the scalar attribute.
| These values are used to weight the contribution of the
| attributes towards the error metric.
|
| vectors_weight : float, default: 0.1
| See ``scalars_weight`` parameter.
|
| normals_weight : float, default: 0.1
| See ``scalars_weight`` parameter.
|
| tcoords_weight : float, default: 0.1
| See ``scalars_weight`` parameter.
|
| tensors_weight : float, default: 0.1
| See ``scalars_weight`` parameter.
|
| inplace : bool, default: False
| Whether to update the mesh in-place.
|
| progress_bar : bool, default: False
| Display a progress bar to indicate progress.
|
| Returns
| -------
| pyvista.PolyData
| Decimated mesh.
|
| Notes
| -----
| If you encounter a segmentation fault or other error, consider using
| :func:`pyvista.PolyDataFilters.clean` to remove any invalid cells
| before using this filter.
|
| Examples
| --------
| Decimate a sphere. First plot the sphere.
|
| >>> import pyvista
| >>> sphere = pyvista.Sphere(phi_resolution=60, theta_resolution=60)
| >>> sphere.plot(show_edges=True, line_width=2)
|
| Now decimate it by 75% and plot it.
|
| >>> decimated = sphere.decimate(0.75)
| >>> decimated.plot(show_edges=True, line_width=2)
|
| See :ref:`decimate_example` for more examples using this filter.
|
| decimate_pro(self, reduction, feature_angle=45.0, split_angle=75.0, splitting=True, pre_split_mesh=False, preserve_topology=False, boundary_vertex_deletion=True, max_degree=None, inplace=False, progress_bar=False)
| Reduce the number of triangles in a triangular mesh.
|
| It forms a good approximation to the original geometry. Based
| on the algorithm originally described in "Decimation of
| Triangle Meshes", Proc Siggraph 92
| (https://doi.org/10.1145/133994.134010).
|
| Parameters
| ----------
| reduction : float
| Reduction factor. A value of 0.9 will leave 10% of the
| original number of vertices.
|
| feature_angle : float, default: 45.0
| Angle used to define what an edge is (i.e., if the surface
| normal between two adjacent triangles is >= ``feature_angle``,
| an edge exists).
|
| split_angle : float, default: 75.0
| Angle used to control the splitting of the mesh. A split
| line exists when the surface normals between two edge
| connected triangles are >= ``split_angle``.
|
| splitting : bool, default: True
| Controls the splitting of the mesh at corners, along
| edges, at non-manifold points, or anywhere else a split is
| required. Turning splitting off will better preserve the
| original topology of the mesh, but may not necessarily
| give the exact requested decimation.
|
| pre_split_mesh : bool, default: False
| Separates the mesh into semi-planar patches, which are
| disconnected from each other. This can give superior
| results in some cases. If ``pre_split_mesh`` is set to
| ``True``, the mesh is split with the specified
| ``split_angle``. Otherwise mesh splitting is deferred as
| long as possible.
|
| preserve_topology : bool, default: False
| Controls topology preservation. If on, mesh splitting and
| hole elimination will not occur. This may limit the
| maximum reduction that may be achieved.
|
| boundary_vertex_deletion : bool, default: True
| Allow deletion of vertices on the boundary of the mesh.
| Turning this off may limit the maximum reduction that may
| be achieved.
|
| max_degree : float, optional
| The maximum vertex degree. If the number of triangles
| connected to a vertex exceeds ``max_degree``, then the
| vertex will be split. The complexity of the triangulation
| algorithm is proportional to ``max_degree**2``. Setting ``max_degree``
| small can improve the performance of the algorithm.
|
| inplace : bool, default: False
| Whether to update the mesh in-place.
|
| progress_bar : bool, default: False
| Display a progress bar to indicate progress.
|
| Returns
| -------
| pyvista.PolyData
| Decimated mesh.
|
| Examples
| --------
| Decimate a sphere. First plot the sphere.
|
| >>> import pyvista
| >>> sphere = pyvista.Sphere(phi_resolution=60, theta_resolution=60)
| >>> sphere.plot(show_edges=True, line_width=2)
|
| Now decimate it and plot it.
|
| >>> decimated = sphere.decimate_pro(0.75)
| >>> decimated.plot(show_edges=True, line_width=2)
|
| See :ref:`decimate_example` for more examples using this filter.
|
| delaunay_2d(self, tol=1e-05, alpha=0.0, offset=1.0, bound=False, inplace=False, edge_source=None, progress_bar=False)
| Apply a 2D Delaunay filter along the best fitting plane.
|
| This filter can be used to generate a 2d surface from a set of
| points on a plane. If you want to create a surface from a
| point cloud, see :func:`pyvista.PolyDataFilters.reconstruct_surface`.
|
| Parameters
| ----------
| tol : float, default: 1e-05
| Specify a tolerance to control discarding of closely
| spaced points. This tolerance is specified as a fraction
| of the diagonal length of the bounding box of the points.
|
| alpha : float, default: 0.0
| Specify alpha (or distance) value to control output of
| this filter. For a non-zero alpha value, only edges or
| triangles contained within a sphere centered at mesh
| vertices will be output. Otherwise, only triangles will be
| output.
|
| offset : float, default: 1.0
| Specify a multiplier to control the size of the initial,
| bounding Delaunay triangulation.
|
| bound : bool, default: False
| Boolean controls whether bounding triangulation points
| and associated triangles are included in the
| output. These are introduced as an initial triangulation
| to begin the triangulation process. This feature is nice
| for debugging output.
|
| inplace : bool, default: False
| If ``True``, overwrite this mesh with the triangulated
| mesh.
|
| edge_source : pyvista.PolyData, optional
| Specify the source object used to specify constrained
| edges and loops. If set, and lines/polygons are defined, a
| constrained triangulation is created. The lines/polygons
| are assumed to reference points in the input point set
| (i.e. point ids are identical in the input and
| source).
|
| progress_bar : bool, default: False
| Display a progress bar to indicate progress.
|
| Returns
| -------
| pyvista.PolyData
| Mesh from the 2D delaunay filter.
|
| Examples
| --------
| First, generate 30 points on circle and plot them.
|
| >>> import pyvista as pv
| >>> points = pv.Polygon(n_sides=30).points
| >>> circle = pv.PolyData(points)
| >>> circle.plot(show_edges=True, point_size=15)
|
| Use :func:`delaunay_2d` to fill the interior of the circle.
|
| >>> filled_circle = circle.delaunay_2d()
| >>> filled_circle.plot(show_edges=True, line_width=5)
|
| Use the ``edge_source`` parameter to create a constrained delaunay
| triangulation and plot it.
|
| >>> squar = pv.Polygon(n_sides=4, radius=8, fill=False)
| >>> squar = squar.rotate_z(45, inplace=False)
| >>> circ0 = pv.Polygon(center=(2, 3, 0), n_sides=30, radius=1)
| >>> circ1 = pv.Polygon(center=(-2, -3, 0), n_sides=30, radius=1)
| >>> comb = circ0 + circ1 + squar
| >>> tess = comb.delaunay_2d(edge_source=comb)
| >>> tess.plot(cpos='xy', show_edges=True)
|
| See :ref:`triangulated_surface` for more examples using this filter.
|
| edge_mask(self, angle, progress_bar=False)
| Return a mask of the points of a surface mesh that has a surface angle greater than angle.
|
| Parameters
| ----------
| angle : float
| Angle to consider an edge.
|
| progress_bar : bool, default: False
| Display a progress bar to indicate progress.
|
| Returns
| -------
| numpy.ndarray
| Mask of points with an angle greater than ``angle``.
|
| Examples
| --------
| Plot the mask of points that exceed 45 degrees.
|
| >>> import pyvista
| >>> mesh = pyvista.Cube().triangulate().subdivide(4)
| >>> mask = mesh.edge_mask(45)
| >>> mesh.plot(scalars=mask)
|
| Show the array of masked points.
|
| >>> mask # doctest:+SKIP
| array([ True, True, True, ..., False, False, False])
|
| extrude(self, vector, capping=None, inplace=False, progress_bar=False)
| Sweep polygonal data creating a "skirt" from free edges.
|
| This will create a line from vertices.
|
| This takes polygonal data as input and generates polygonal
| data on output. The input dataset is swept according to some
| extrusion function and creates new polygonal primitives. These
| primitives form a "skirt" or swept surface. For example,
| sweeping a line results in a quadrilateral, and sweeping a
| triangle creates a "wedge".
|
| The skirt is generated by locating certain topological
| features. Free edges (edges of polygons or triangle strips
| only used by one polygon or triangle strips) generate
| surfaces. This is true also of lines or polylines. Vertices
| generate lines.
|
| .. versionchanged:: 0.32.0
| The ``capping`` keyword was added with a default of ``False``.
| The previously used VTK default corresponds to ``capping=True``.
| In a future version the default will be changed to ``True`` to
| match the behavior of the underlying VTK filter.
|
| Parameters
| ----------
| vector : numpy.ndarray or sequence
| Direction and length to extrude the mesh in.
|
| capping : bool, optional
| Control if the sweep of a 2D object is capped. The default is
| ``False``, which differs from VTK's default.
|
| .. warning::
| The ``capping`` keyword was added in version 0.32.0 with a
| default value of ``False``. In a future version this default
| will be changed to ``True`` to match the behavior of the
| underlying VTK filter. It is recommended to explicitly pass
| a value for this keyword argument to prevent future changes
| in behavior and warnings.
|
| inplace : bool, default: False
| Overwrites the original mesh in-place.
|
| progress_bar : bool, default: False
| Display a progress bar to indicate progress.
|
| Returns
| -------
| pyvista.PolyData
| Extruded mesh.
|
| Examples
| --------
| Extrude a half circle arc.
|
| >>> import pyvista
| >>> arc = pyvista.CircularArc([-1, 0, 0], [1, 0, 0], [0, 0, 0])
| >>> mesh = arc.extrude([0, 0, 1], capping=False)
| >>> mesh.plot(color='lightblue')
|
| Extrude and cap an 8 sided polygon.
|
| >>> poly = pyvista.Polygon(n_sides=8)
| >>> mesh = poly.extrude((0, 0, 1.5), capping=True)
| >>> mesh.plot(line_width=5, show_edges=True)
|
| extrude_rotate(self, resolution=30, inplace=False, translation=0.0, dradius=0.0, angle=360.0, capping=None, rotation_axis=(0, 0, 1), progress_bar=False)
| Sweep polygonal data creating "skirt" from free edges and lines, and lines from vertices.
|
| This takes polygonal data as input and generates polygonal
| data on output. The input dataset is swept around the axis
| to create new polygonal primitives. These primitives form a
| "skirt" or swept surface. For example, sweeping a line results
| in a cylindrical shell, and sweeping a circle creates a torus.
|
| There are a number of control parameters for this filter. You
| can control whether the sweep of a 2D object (i.e., polygon or
| triangle strip) is capped with the generating geometry via the
| ``capping`` parameter. Also, you can control the angle of
| rotation, and whether translation along the axis is
| performed along with the rotation. (Translation is useful for
| creating "springs".) You also can adjust the radius of the
| generating geometry with the ``dradius`` parameter.
|
| The skirt is generated by locating certain topological
| features. Free edges (edges of polygons or triangle strips
| only used by one polygon or triangle strips) generate
| surfaces. This is true also of lines or polylines. Vertices
| generate lines.
|
| This filter can be used to model axisymmetric objects like
| cylinders, bottles, and wine glasses; or translational
| rotational symmetric objects like springs or corkscrews.
|
| .. versionchanged:: 0.32.0
| The ``capping`` keyword was added with a default of ``False``.
| The previously used VTK default corresponds to ``capping=True``.
| In a future version the default will be changed to ``True`` to
| match the behavior of the underlying VTK filter.
|
| Parameters
| ----------
| resolution : int, optional
| Number of pieces to divide line into.
|
| inplace : bool, default: False
| Overwrites the original mesh inplace.
|
| translation : float, optional
| Total amount of translation along the axis.
|
| dradius : float, optional
| Change in radius during sweep process.
|
| angle : float, optional
| The angle of rotation in degrees.
|
| capping : bool, optional
| Control if the sweep of a 2D object is capped. The default is
| ``False``, which differs from VTK's default.
|
| .. warning::
| The ``capping`` keyword was added in version 0.32.0 with a
| default value of ``False``. In a future version this default
| will be changed to ``True`` to match the behavior of the
| underlying VTK filter. It is recommended to explicitly pass
| a value for this keyword argument to prevent future changes
| in behavior and warnings.
|
| rotation_axis : numpy.ndarray or sequence, optional
| The direction vector of the axis around which the rotation is done.
| It requires vtk>=9.1.0.
|
| progress_bar : bool, default: False
| Display a progress bar to indicate progress.
|
| Returns
| -------
| pyvista.PolyData
| Rotationally extruded mesh.
|
| Examples
| --------
| Create a "spring" using the rotational extrusion filter.
|
| >>> import pyvista
| >>> profile = pyvista.Polygon(
| ... center=[1.25, 0.0, 0.0],
| ... radius=0.2,
| ... normal=(0, 1, 0),
| ... n_sides=30,
| ... )
| >>> extruded = profile.extrude_rotate(
| ... resolution=360,
| ... translation=4.0,
| ... dradius=0.5,
| ... angle=1500.0,
| ... capping=True,
| ... )
| >>> extruded.plot(smooth_shading=True)
|
| Create a "wine glass" using the rotational extrusion filter.
|
| >>> import numpy as np
| >>> points = np.array(
| ... [
| ... [-0.18, 0, 0],
| ... [-0.18, 0, 0.01],
| ... [-0.18, 0, 0.02],
| ... [-0.01, 0, 0.03],
| ... [-0.01, 0, 0.04],
| ... [-0.02, 0, 0.5],
| ... [-0.05, 0, 0.75],
| ... [-0.1, 0, 0.8],
| ... [-0.2, 0, 1.0],
| ... ]
| ... )
| >>> spline = pyvista.Spline(points, 30)
| >>> extruded = spline.extrude_rotate(resolution=20, capping=False)
| >>> extruded.plot(color='lightblue')
|
| extrude_trim(self, direction, trim_surface, extrusion='boundary_edges', capping='intersection', inplace=False, progress_bar=False)
| Extrude polygonal data trimmed by a surface.
|
| The input dataset is swept along a specified direction forming a
| "skirt" from the boundary edges 2D primitives (i.e., edges used
| by only one polygon); and/or from vertices and lines. The extent
| of the sweeping is defined where the sweep intersects a
| user-specified surface.
|
| Parameters
| ----------
| direction : numpy.ndarray or sequence
| Direction vector to extrude.
|
| trim_surface : pyvista.PolyData
| Surface which trims the surface.
|
| extrusion : str, default: "boundary_edges"
| Control the strategy of extrusion. One of the following:
|
| * ``"boundary_edges"``
| * ``"all_edges"``
|
| The default only generates faces on the boundary of the original
| input surface. When using ``"all_edges"``, faces are created along
| interior points as well.
|
| capping : str, default: "intersection"
| Control the strategy of capping. One of the following:
|
| * ``"intersection"``
| * ``"minimum_distance"``
| * ``"maximum_distance"``
| * ``"average_distance"``
|
| inplace : bool, default: False
| Overwrites the original mesh in-place.
|
| progress_bar : bool, default: False
| Display a progress bar to indicate progress.
|
| Returns
| -------
| pyvista.PolyData
| Extruded mesh trimmed by a surface.
|
| Examples
| --------
| Extrude a disc.
|
| >>> import pyvista
| >>> import numpy as np
| >>> plane = pyvista.Plane(
| ... i_size=2, j_size=2, direction=[0, 0.8, 1]
| ... )
| >>> disc = pyvista.Disc(center=(0, 0, -1), c_res=50)
| >>> direction = [0, 0, 1]
| >>> extruded_disc = disc.extrude_trim(direction, plane)
| >>> extruded_disc.plot(smooth_shading=True, split_sharp_edges=True)
|
| fill_holes(self, hole_size, inplace=False, progress_bar=False)
| Fill holes in a pyvista.PolyData or vtk.vtkPolyData object.
|
| Holes are identified by locating boundary edges, linking them
| together into loops, and then triangulating the resulting
| loops. Note that you can specify an approximate limit to the
| size of the hole that can be filled.
|
| .. warning::
| This method is known to segfault. Use at your own risk.
|
| Parameters
| ----------
| hole_size : float
| Specifies the maximum hole size to fill. This is
| represented as a radius to the bounding circumsphere
| containing the hole. Note that this is an approximate
| area; the actual area cannot be computed without first
| triangulating the hole.
|
| inplace : bool, default: False
| Return new mesh or overwrite input.
|
| progress_bar : bool, default: False
| Display a progress bar to indicate progress.
|
| Returns
| -------
| pyvista.PolyData
| Mesh with holes filled if ``inplace=False``.
|
| Examples
| --------
| Create a partial sphere with a hole and then fill it.
|
| >>> import pyvista as pv
| >>> sphere_with_hole = pv.Sphere(end_theta=330)
| >>> sphere = sphere_with_hole.fill_holes(1000) # doctest:+SKIP
| >>> edges = sphere.extract_feature_edges(
| ... feature_edges=False, manifold_edges=False
| ... ) # doctest:+SKIP
| >>> assert edges.n_cells == 0 # doctest:+SKIP
|
| flip_normals(self)
| Flip normals of a triangular mesh by reversing the point ordering.
|
| Examples
| --------
| Flip the normals of a sphere and plot the normals before and
| after the flip.
|
| >>> import pyvista as pv
| >>> sphere = pv.Sphere()
| >>> sphere.plot_normals(mag=0.1)
| >>> sphere.flip_normals()
| >>> sphere.plot_normals(mag=0.1, opacity=0.5)
|
| geodesic(self, start_vertex, end_vertex, inplace=False, keep_order=True, use_scalar_weights=False, progress_bar=False)
| Calculate the geodesic path between two vertices using Dijkstra's algorithm.
|
| This will add an array titled ``'vtkOriginalPointIds'`` of the input
| mesh's point ids to the output mesh. The default behavior of the
| underlying ``vtkDijkstraGraphGeodesicPath`` filter is that the
| geodesic path is reversed in the resulting mesh. This is overridden
| in PyVista by default.
|
| Parameters
| ----------
| start_vertex : int
| Vertex index indicating the start point of the geodesic segment.
|
| end_vertex : int
| Vertex index indicating the end point of the geodesic segment.
|
| inplace : bool, default: False
| Whether the input mesh should be replaced with the path. The
| geodesic path is always returned.
|
| keep_order : bool, default: True
| If ``True``, the points of the returned path are guaranteed
| to start with the start vertex (as opposed to the end vertex).
|
| .. versionadded:: 0.32.0
|
| use_scalar_weights : bool, default: False
| If ``True``, use scalar values in the edge weight.
| This only works for point data.
|
| progress_bar : bool, default: False
| Display a progress bar to indicate progress.
|
| Returns
| -------
| pyvista.PolyData
| ``PolyData`` object consisting of the line segment between the
| two given vertices. If ``inplace`` is ``True`` this is the
| same object as the input mesh.
|
| Examples
| --------
| Plot the path between two points on the random hills mesh.
|
| >>> import pyvista as pv
| >>> from pyvista import examples
| >>> hills = examples.load_random_hills()
| >>> path = hills.geodesic(560, 5820)
| >>> pl = pv.Plotter()
| >>> _ = pl.add_mesh(hills)
| >>> _ = pl.add_mesh(path, line_width=5, color='k')
| >>> pl.show()
|
| See :ref:`geodesic_example` for more examples using this filter.
|
| geodesic_distance(self, start_vertex, end_vertex, use_scalar_weights=False, progress_bar=False)
| Calculate the geodesic distance between two vertices using Dijkstra's algorithm.
|
| Parameters
| ----------
| start_vertex : int
| Vertex index indicating the start point of the geodesic segment.
|
| end_vertex : int
| Vertex index indicating the end point of the geodesic segment.
|
| use_scalar_weights : bool, default: False
| If ``True``, use scalar values in the edge weight.
| This only works for point data.
|
| progress_bar : bool, default: False
| Display a progress bar to indicate progress.
|
| Returns
| -------
| float
| Length of the geodesic segment.
|
| Examples
| --------
| >>> import pyvista as pv
| >>> sphere = pv.Sphere()
| >>> length = sphere.geodesic_distance(0, 100)
| >>> f'Length is {length:.3f}'
| 'Length is 0.812'
|
| See :ref:`geodesic_example` for more examples using this filter.
|
| intersection(self, mesh, split_first=True, split_second=True, progress_bar=False)
| Compute the intersection between two meshes.
|
| .. note::
| This method returns the surface intersection from two meshes
| (which often resolves as a line), whereas the
| :func:`PolyDataFilters.boolean_intersection` filter returns
| the "volume" intersection between two closed (manifold)
| meshes.
|
| Parameters
| ----------
| mesh : pyvista.PolyData
| The mesh to intersect with.
|
| split_first : bool, default: True
| If ``True``, return the first input mesh split by the
| intersection with the second input mesh.
|
| split_second : bool, default: True
| If ``True``, return the second input mesh split by the
| intersection with the first input mesh.
|
| progress_bar : bool, default: False
| Display a progress bar to indicate progress.
|
| Returns
| -------
| pyvista.PolyData
| The intersection line.
|
| pyvista.PolyData
| The first mesh split along the intersection. Returns the
| original first mesh if ``split_first=False``.
|
| pyvista.PolyData
| The second mesh split along the intersection. Returns the
| original second mesh if ``split_second=False``.
|
| Examples
| --------
| Intersect two spheres, returning the intersection and both spheres
| which have new points/cells along the intersection line.
|
| >>> import pyvista as pv
| >>> import numpy as np
| >>> s1 = pv.Sphere(phi_resolution=15, theta_resolution=15)
| >>> s2 = s1.copy()
| >>> s2.points += np.array([0.25, 0, 0])
| >>> intersection, s1_split, s2_split = s1.intersection(s2)
| >>> pl = pv.Plotter()
| >>> _ = pl.add_mesh(s1, style='wireframe')
| >>> _ = pl.add_mesh(s2, style='wireframe')
| >>> _ = pl.add_mesh(intersection, color='r', line_width=10)
| >>> pl.show()
|
| The mesh splitting takes additional time and can be turned
| off for either mesh individually.
|
| >>> intersection, _, s2_split = s1.intersection(
| ... s2, split_first=False, split_second=True
| ... )
|
| merge(self, dataset, merge_points=True, tolerance=0.0, inplace=False, main_has_priority=True, progress_bar=False)
| Merge this mesh with one or more datasets.
|
| .. note::
| The behavior of this filter varies from the
| :func:`PolyDataFilters.boolean_union` filter. This filter
| does not attempt to create a manifold mesh and will include
| internal surfaces when two meshes overlap.
|
| .. note::
| The ``+`` operator between two meshes uses this filter with
| the default parameters. When the other mesh is also a
| :class:`pyvista.PolyData`, in-place merging via ``+=`` is
| similarly possible.
|
| .. versionchanged:: 0.39.0
| Before version ``0.39.0``, if all input datasets were of type :class:`pyvista.PolyData`,
| the VTK ``vtkAppendPolyDataFilter`` and ``vtkCleanPolyData`` filters were used to perform merging.
| Otherwise, :func:`DataSetFilters.merge`, which uses the VTK ``vtkAppendFilter`` filter,
| was called.
| To enhance performance and coherence with merging operations available for other datasets in pyvista,
| the merging operation has been delegated in ``0.39.0`` to :func:`DataSetFilters.merge` only,
| irrespectively of input datasets types.
| This induced that points ordering can be altered compared to previous pyvista versions when
| merging only PolyData together.
| To obtain similar results as before ``0.39.0`` for multiple PolyData, combine
| :func:`PolyDataFilters.append_polydata` and :func:`PolyDataFilters.clean`.
|
| .. seealso::
| :func:`PolyDataFilters.append_polydata`
|
| Parameters
| ----------
| dataset : pyvista.DataSet
| PyVista dataset to merge this mesh with.
|
| merge_points : bool, optional
| Merge equivalent points when ``True``.
|
| tolerance : float, default: 0.0
| The absolute tolerance to use to find coincident points when
| ``merge_points=True``.
|
| inplace : bool, default: False
| Updates grid inplace when ``True`` if the input type is a
| :class:`pyvista.PolyData`. For other input meshes the
| result is a :class:`pyvista.UnstructuredGrid` which makes
| in-place operation impossible.
|
| main_has_priority : bool, optional
| When this parameter is ``True`` and ``merge_points=True``,
| the arrays of the merging grids will be overwritten
| by the original main mesh.
|
| progress_bar : bool, default: False
| Display a progress bar to indicate progress.
|
| Returns
| -------
| pyvista.DataSet
| :class:`pyvista.PolyData` if ``dataset`` is a
| :class:`pyvista.PolyData`, otherwise a
| :class:`pyvista.UnstructuredGrid`.
|
| Examples
| --------
| >>> import pyvista
| >>> sphere_a = pyvista.Sphere()
| >>> sphere_b = pyvista.Sphere(center=(0.5, 0, 0))
| >>> merged = sphere_a.merge(sphere_b)
| >>> merged.plot(style='wireframe', color='lightblue')
|
| multi_ray_trace(self, origins, directions, first_point=False, retry=False)
| Perform multiple ray trace calculations.
|
| This requires a mesh with only triangular faces, an array of
| origin points and an equal sized array of direction vectors to
| trace along.
|
| The embree library used for vectorization of the ray traces is
| known to occasionally return no intersections where the VTK
| implementation would return an intersection. If the result
| appears to be missing some intersection points, set
| ``retry=True`` to run a second pass over rays that returned no
| intersections, using :func:`PolyDataFilters.ray_trace`.
|
| Parameters
| ----------
| origins : array_like[float]
| Starting point for each trace.
|
| directions : array_like[float]
| Direction vector for each trace.
|
| first_point : bool, default: False
| Returns intersection of first point only.
|
| retry : bool, default: False
| Will retry rays that return no intersections using
| :func:`PolyDataFilters.ray_trace`.
|
| Returns
| -------
| intersection_points : numpy.ndarray
| Location of the intersection points. Empty array if no
| intersections.
|
| intersection_rays : numpy.ndarray
| Indices of the ray for each intersection point. Empty array if no
| intersections.
|
| intersection_cells : numpy.ndarray
| Indices of the intersection cells. Empty array if no
| intersections.
|
| Examples
| --------
| Compute the intersection between rays from the origin in
| directions ``[1, 0, 0]``, ``[0, 1, 0]`` and ``[0, 0, 1]``, and
| a sphere with radius 0.5 centered at the origin
|
| >>> import pyvista as pv # doctest:+SKIP
| >>> sphere = pv.Sphere() # doctest:+SKIP
| >>> points, rays, cells = sphere.multi_ray_trace(
| ... [[0, 0, 0]] * 3,
| ... [[1, 0, 0], [0, 1, 0], [0, 0, 1]],
| ... first_point=True,
| ... ) # doctest:+SKIP
| >>> string = ", ".join(
| ... [
| ... f"({point[0]:.3f}, {point[1]:.3f}, {point[2]:.3f})"
| ... for point in points
| ... ]
| ... ) # doctest:+SKIP
| >>> f'Rays intersected at {string}' # doctest:+SKIP
| 'Rays intersected at (0.499, 0.000, 0.000), (0.000, 0.497, 0.000), (0.000, 0.000, 0.500)'
|
| plot_boundaries(self, edge_color='red', line_width=None, progress_bar=False, **kwargs)
| Plot boundaries of a mesh.
|
| Parameters
| ----------
| edge_color : ColorLike, default: "red"
| The color of the edges when they are added to the plotter.
|
| line_width : int, optional
| Width of the boundary lines.
|
| progress_bar : bool, default: False
| Display a progress bar to indicate progress.
|
| **kwargs : dict, optional
| All additional keyword arguments will be passed to
| :func:`pyvista.Plotter.add_mesh`.
|
| Returns
| -------
| pyvista.CameraPosition
| List of camera position, focal point, and view up.
| Returned when ``return_cpos`` is ``True``.
|
| Examples
| --------
| >>> from pyvista import examples
| >>> hills = examples.load_random_hills()
| >>> hills.plot_boundaries(line_width=10)
|
| plot_curvature(self, curv_type='mean', **kwargs)
| Plot the curvature.
|
| Parameters
| ----------
| curv_type : str, default: "mean"
| One of the following strings indicating curvature type:
|
| * ``'mean'``
| * ``'gaussian'``
| * ``'maximum'``
| * ``'minimum'``
|
| **kwargs : dict, optional
| See :func:`pyvista.plot`.
|
| Returns
| -------
| pyvista.CameraPosition
| List of camera position, focal point, and view up.
| Returned when ``return_cpos`` is ``True``.
|
| Examples
| --------
| Plot the Gaussian curvature of an example mesh. Override the
| default scalar bar range as the mesh edges report high
| curvature.
|
| >>> from pyvista import examples
| >>> hills = examples.load_random_hills()
| >>> hills.plot_curvature(
| ... curv_type='gaussian', smooth_shading=True, clim=[0, 1]
| ... )
|
| plot_normals(self, show_mesh=True, mag=1.0, flip=False, use_every=1, faces=False, color=None, **kwargs)
| Plot the point normals of a mesh.
|
| Parameters
| ----------
| show_mesh : bool, default: true
| Plot the mesh itself.
|
| mag : float, default: 1.0
| Size magnitude of the normal arrows.
|
| flip : bool, default: False
| Flip the normal direction when ``True``.
|
| use_every : int, default: 1
| Display every nth normal. By default every normal is
| displayed. Display every 10th normal by setting this
| parameter to 10.
|
| faces : bool, default: False
| Plot face normals instead of the default point normals.
|
| color : ColorLike, optional
| Color of the arrows. Defaults to
| :attr:`pyvista.plotting.themes.Theme.edge_color`.
|
| **kwargs : dict, optional
| All additional keyword arguments will be passed to
| :func:`pyvista.Plotter.add_mesh`.
|
| Returns
| -------
| pyvista.CameraPosition
| List of camera position, focal point, and view up.
| Returned when ``return_cpos`` is ``True``.
|
| Examples
| --------
| Plot the point normals of a sphere.
|
| >>> import pyvista as pv
| >>> sphere = pv.Sphere(phi_resolution=10, theta_resolution=10)
| >>> sphere.plot_normals(mag=0.1, show_edges=True)
|
| Plot the face normals of a sphere.
|
| >>> import pyvista as pv
| >>> sphere = pv.Sphere(phi_resolution=10, theta_resolution=10)
| >>> sphere.plot_normals(mag=0.1, faces=True, show_edges=True)
|
| project_points_to_plane(self, origin=None, normal=(0.0, 0.0, 1.0), inplace=False)
| Project points of this mesh to a plane.
|
| Parameters
| ----------
| origin : sequence[float], optional
| Plane origin. Defaults to the approximate center of the
| input mesh minus half the length of the input mesh in the
| direction of the normal.
|
| normal : sequence[float], default: (0.0, 0.0, 1.0)
| Plane normal. Defaults to +Z.
|
| inplace : bool, default: False
| Whether to overwrite the original mesh with the projected
| points.
|
| Returns
| -------
| pyvista.PolyData
| The points of this mesh projected onto a plane.
|
| Examples
| --------
| Flatten a sphere to the XY plane.
|
| >>> import pyvista as pv
| >>> sphere = pv.Sphere()
| >>> projected = sphere.project_points_to_plane()
| >>> projected.plot(show_edges=True, line_width=3)
|
| ray_trace(self, origin, end_point, first_point=False, plot=False, off_screen=None)
| Perform a single ray trace calculation.
|
| This requires a mesh and a line segment defined by an origin
| and end_point.
|
| Parameters
| ----------
| origin : sequence[float]
| Start of the line segment.
|
| end_point : sequence[float]
| End of the line segment.
|
| first_point : bool, default: False
| Returns intersection of first point only.
|
| plot : bool, default: False
| Whether to plot the ray trace results.
|
| off_screen : bool, optional
| Plots off screen when ``plot=True``. Used for unit testing.
|
| Returns
| -------
| intersection_points : numpy.ndarray
| Location of the intersection points. Empty array if no
| intersections.
|
| intersection_cells : numpy.ndarray
| Indices of the intersection cells. Empty array if no
| intersections.
|
| Examples
| --------
| Compute the intersection between a ray from the origin to
| ``[1, 0, 0]`` and a sphere with radius 0.5 centered at the
| origin.
|
| >>> import pyvista as pv
| >>> sphere = pv.Sphere()
| >>> point, cell = sphere.ray_trace(
| ... [0, 0, 0], [1, 0, 0], first_point=True
| ... )
| >>> f'Intersected at {point[0]:.3f} {point[1]:.3f} {point[2]:.3f}'
| 'Intersected at 0.499 0.000 0.000'
|
| Show a plot of the ray trace.
|
| >>> point, cell = sphere.ray_trace([0, 0, 0], [1, 0, 0], plot=True)
|
| See :ref:`ray_trace_example` for more examples using this filter.
|
| reconstruct_surface(self, nbr_sz=None, sample_spacing=None, progress_bar=False)
| Reconstruct a surface from the points in this dataset.
|
| This filter takes a list of points assumed to lie on the
| surface of a solid 3D object. A signed measure of the distance
| to the surface is computed and sampled on a regular grid. The
| grid can then be contoured at zero to extract the surface. The
| default values for neighborhood size and sample spacing should
| give reasonable results for most uses but can be set if
| desired.
|
| This is helpful when generating surfaces from point clouds and
| is more reliable than :func:`DataSetFilters.delaunay_3d`.
|
| Parameters
| ----------
| nbr_sz : int, optional
| Specify the number of neighbors each point has, used for
| estimating the local surface orientation.
|
| The default value of 20 should be fine for most
| applications, higher values can be specified if the spread
| of points is uneven. Values as low as 10 may yield
| adequate results for some surfaces. Higher values cause
| the algorithm to take longer and will cause
| errors on sharp boundaries.
|
| sample_spacing : float, optional
| The spacing of the 3D sampling grid. If not set, a
| reasonable guess will be made.
|
| progress_bar : bool, default: False
| Display a progress bar to indicate progress.
|
| Returns
| -------
| pyvista.PolyData
| Reconstructed surface.
|
| Examples
| --------
| Create a point cloud out of a sphere and reconstruct a surface
| from it.
|
| >>> import pyvista as pv
| >>> points = pv.wrap(pv.Sphere().points)
| >>> surf = points.reconstruct_surface()
|
| >>> pl = pv.Plotter(shape=(1, 2))
| >>> _ = pl.add_mesh(points)
| >>> _ = pl.add_title('Point Cloud of 3D Surface')
| >>> pl.subplot(0, 1)
| >>> _ = pl.add_mesh(surf, color=True, show_edges=True)
| >>> _ = pl.add_title('Reconstructed Surface')
| >>> pl.show()
|
| See :ref:`surface_reconstruction_example` for more examples
| using this filter.
|
| remove_points(self, remove, mode='any', keep_scalars=True, inplace=False)
| Rebuild a mesh by removing points.
|
| Only valid for all-triangle meshes.
|
| Parameters
| ----------
| remove : sequence[bool | int]
| If remove is a bool array, points that are ``True`` will
| be removed. Otherwise, it is treated as a list of
| indices.
|
| mode : str, default: "any"
| When ``'all'``, only faces containing all points flagged
| for removal will be removed.
|
| keep_scalars : bool, default: True
| When ``True``, point and cell scalars will be passed on to
| the new mesh.
|
| inplace : bool, default: False
| Updates mesh in-place.
|
| Returns
| -------
| pyvista.PolyData
| Mesh without the points flagged for removal.
|
| numpy.ndarray
| Indices of new points relative to the original mesh.
|
| Examples
| --------
| Remove the first 100 points from a sphere.
|
| >>> import pyvista as pv
| >>> sphere = pv.Sphere()
| >>> reduced_sphere, ridx = sphere.remove_points(range(100, 250))
| >>> reduced_sphere.plot(show_edges=True, line_width=3)
|
| ribbon(self, width=None, scalars=None, angle=0.0, factor=2.0, normal=None, tcoords=False, preference='points', progress_bar=False)
| Create a ribbon of the lines in this dataset.
|
| .. note::
| If there are no lines in the input dataset, then the output
| will be an empty :class:`pyvista.PolyData` mesh.
|
| Parameters
| ----------
| width : float, optional
| Set the "half" width of the ribbon. If the width is
| allowed to vary, this is the minimum width. The default is
| 10% the length.
|
| scalars : str, optional
| String name of the scalars array to use to vary the ribbon
| width. This is only used if a scalars array is specified.
|
| angle : float, optional
| Angle in degrees of the offset angle of the ribbon from
| the line normal. The default is 0.0.
|
| factor : float, optional
| Set the maximum ribbon width in terms of a multiple of the
| minimum width. The default is 2.0.
|
| normal : sequence[float], optional
| Normal to use as default.
|
| tcoords : bool, str, optional
| If ``True``, generate texture coordinates along the
| ribbon. This can also be specified to generate the texture
| coordinates with either ``'length'`` or ``'normalized'``.
|
| preference : str, optional
| The field preference when searching for the scalars array by
| name.
|
| progress_bar : bool, default: False
| Display a progress bar to indicate progress.
|
| Returns
| -------
| pyvista.PolyData
| Ribbon mesh. Empty if there are no lines in the input dataset.
|
| Examples
| --------
| Convert a line to a ribbon and plot it.
|
| >>> import numpy as np
| >>> import pyvista
| >>> n = 1000
| >>> theta = np.linspace(-10 * np.pi, 10 * np.pi, n)
| >>> z = np.linspace(-2, 2, n)
| >>> r = z**2 + 1
| >>> x = r * np.sin(theta)
| >>> y = r * np.cos(theta)
| >>> points = np.column_stack((x, y, z))
| >>> pdata = pyvista.PolyData(points)
| >>> pdata.lines = np.hstack((n, range(n)))
| >>> pdata['distance'] = range(n)
| >>> ribbon = pdata.ribbon(width=0.2)
| >>> ribbon.plot(show_scalar_bar=False)
|
| smooth(self, n_iter=20, relaxation_factor=0.01, convergence=0.0, edge_angle=15, feature_angle=45, boundary_smoothing=True, feature_smoothing=False, inplace=False, progress_bar=False)
| Adjust point coordinates using Laplacian smoothing.
|
| The effect is to "relax" the mesh, making the cells better shaped and
| the vertices more evenly distributed.
|
| Parameters
| ----------
| n_iter : int, default: 20
| Number of iterations for Laplacian smoothing.
|
| relaxation_factor : float, default: 0.01
| Relaxation factor controls the amount of displacement in a single
| iteration. Generally a lower relaxation factor and higher number of
| iterations is numerically more stable.
|
| convergence : float, default: 0.0
| Convergence criterion for the iteration process. Smaller numbers
| result in more smoothing iterations. Range from (0 to 1).
|
| edge_angle : float, default: 15
| Edge angle to control smoothing along edges (either interior or boundary).
|
| feature_angle : float, default: 45
| Feature angle for sharp edge identification.
|
| boundary_smoothing : bool, default: True
| Flag to control smoothing of boundary edges. When ``True``,
| boundary edges remain fixed.
|
| feature_smoothing : bool, default: False
| Flag to control smoothing of feature edges. When ``True``,
| boundary edges remain fixed as defined by ``feature_angle`` and
| ``edge_angle``.
|
| inplace : bool, default: False
| Updates mesh in-place.
|
| progress_bar : bool, default: False
| Display a progress bar to indicate progress.
|
| Returns
| -------
| pyvista.PolyData
| Smoothed mesh.
|
| Examples
| --------
| Smooth the edges of an all triangular cube
|
| >>> import pyvista as pv
| >>> cube = pv.Cube().triangulate().subdivide(5)
| >>> smooth_cube = cube.smooth(1000, feature_smoothing=False)
| >>> n_edge_cells = cube.extract_feature_edges().n_cells
| >>> n_smooth_cells = smooth_cube.extract_feature_edges().n_cells
| >>> f'Sharp Edges on Cube: {n_edge_cells}'
| 'Sharp Edges on Cube: 384'
| >>> f'Sharp Edges on Smooth Cube: {n_smooth_cells}'
| 'Sharp Edges on Smooth Cube: 12'
| >>> smooth_cube.plot()
|
| See :ref:`surface_smoothing_example` for more examples using this filter.
|
| smooth_taubin(self, n_iter=20, pass_band=0.1, edge_angle=15.0, feature_angle=45.0, boundary_smoothing=True, feature_smoothing=False, non_manifold_smoothing=False, normalize_coordinates=False, inplace=False, progress_bar=False)
| Smooth a PolyData DataSet with Taubin smoothing.
|
| This filter allows you to smooth the mesh as in the Laplacian smoothing
| implementation in :func:`smooth() <PolyDataFilters.smooth>`. However,
| unlike Laplacian smoothing the surface does not "shrink" since this
| filter relies on an alternative approach to smoothing. This filter is
| more akin to a low pass filter where undesirable high frequency features
| are removed.
|
| This PyVista filter uses the VTK `vtkWindowedSincPolyDataFilter
| <https://vtk.org/doc/nightly/html/classvtkWindowedSincPolyDataFilter.html>`_
| filter.
|
| Parameters
| ----------
| n_iter : int, default: 20
| This is the degree of the polynomial used to approximate the
| windowed sync function. This is generally much less than the number
| needed by :func:`smooth() <PolyDataFilters.smooth>`.
|
| pass_band : float, default: 0.1
| The passband value for the windowed sinc filter. This should be
| between 0 and 2, where lower values cause more smoothing.
|
| edge_angle : float, default: 15.0
| Edge angle to control smoothing along edges (either interior or
| boundary).
|
| feature_angle : float, default: 45.0
| Feature angle for sharp edge identification.
|
| boundary_smoothing : bool, default: True
| Flag to control smoothing of boundary edges. When ``True``,
| boundary edges remain fixed.
|
| feature_smoothing : bool, default: False
| Flag to control smoothing of feature edges. When ``True``,
| boundary edges remain fixed as defined by ``feature_angle`` and
| ``edge_angle``.
|
| non_manifold_smoothing : bool, default: False
| Smooth non-manifold points.
|
| normalize_coordinates : bool, default: False
| Flag to control coordinate normalization. To improve the
| numerical stability of the solution and minimize the scaling of the
| translation effects, the algorithm can translate and scale the
| position coordinates to within the unit cube ``[-1, 1]``, perform the
| smoothing, and translate and scale the position coordinates back to
| the original coordinate frame.
|
| inplace : bool, default: False
| Updates mesh in-place.
|
| progress_bar : bool, default: False
| Display a progress bar to indicate progress.
|
| Returns
| -------
| pyvista.PolyData
| Smoothed mesh.
|
| Notes
| -----
| For maximum performance, do not enable ``feature_smoothing`` or
| ``boundary_smoothing``. ``feature_smoothing`` is especially expensive.
|
| References
| ----------
| See `Optimal Surface Smoothing as Filter Design
| <https://dl.acm.org/doi/pdf/10.1145/218380.218473>`_ for details
| regarding the implementation of Taubin smoothing.
|
| Examples
| --------
| Smooth the example bone mesh. Here, it's necessary to subdivide the
| mesh to increase the number of faces as the original mesh is so coarse.
|
| >>> import pyvista as pv
| >>> from pyvista import examples
| >>> mesh = examples.download_foot_bones().subdivide(2)
| >>> smoothed_mesh = mesh.smooth_taubin()
| >>> pl = pv.Plotter(shape=(1, 2))
| >>> _ = pl.add_mesh(mesh)
| >>> _ = pl.add_text('Original Mesh')
| >>> pl.subplot(0, 1)
| >>> _ = pl.add_mesh(smoothed_mesh)
| >>> _ = pl.add_text('Smoothed Mesh')
| >>> pl.show()
|
| See :ref:`surface_smoothing_example` for more examples using this filter.
|
| strip(self, join=False, max_length=1000, pass_cell_data=False, pass_cell_ids=False, pass_point_ids=False, progress_bar=False)
| Strip poly data cells.
|
| Generates triangle strips and/or poly-lines from input
| polygons, triangle strips, and lines.
|
| Polygons are assembled into triangle strips only if they are
| triangles; other types of polygons are passed through to the
| output and not stripped. (Use ``triangulate`` filter to
| triangulate non-triangular polygons prior to running this
| filter if you need to strip all the data.) The filter will
| pass through (to the output) vertices if they are present in
| the input polydata.
|
| Also note that if triangle strips or polylines are defined in
| the input they are passed through and not joined nor
| extended. (If you wish to strip these use ``triangulate``
| filter to fragment the input into triangles and lines prior to
| running this filter.)
|
| This filter implements `vtkStripper
| <https://vtk.org/doc/nightly/html/classvtkStripper.html>`_
|
| Parameters
| ----------
| join : bool, default: False
| If ``True``, the output polygonal segments will be joined
| if they are contiguous. This is useful after slicing a
| surface.
|
| max_length : int, default: 1000
| Specify the maximum number of triangles in a triangle
| strip, and/or the maximum number of lines in a poly-line.
|
| pass_cell_data : bool, default: False
| Enable/Disable passing of the CellData in the input to the
| output as FieldData. Note the field data is transformed.
|
| pass_cell_ids : bool, default: False
| If ``True``, the output polygonal dataset will have a
| celldata array that holds the cell index of the original
| 3D cell that produced each output cell. This is useful for
| picking. The default is ``False`` to conserve memory.
|
| pass_point_ids : bool, default: False
| If ``True``, the output polygonal dataset will have a
| pointdata array that holds the point index of the original
| vertex that produced each output vertex. This is useful
| for picking. The default is ``False`` to conserve memory.
|
| progress_bar : bool, default: False
| Display a progress bar to indicate progress.
|
| Returns
| -------
| pyvista.PolyData
| Stripped mesh.
|
| Examples
| --------
| >>> from pyvista import examples
| >>> mesh = examples.load_airplane()
| >>> slc = mesh.slice(normal='z', origin=(0, 0, -10))
| >>> stripped = slc.strip()
| >>> stripped.n_cells
| 1
| >>> stripped.plot(show_edges=True, line_width=3)
|
| subdivide(self, nsub, subfilter='linear', inplace=False, progress_bar=False)
| Increase the number of triangles in a single, connected triangular mesh.
|
| Uses one of the following vtk subdivision filters to subdivide a mesh:
|
| * ``vtkButterflySubdivisionFilter``
| * ``vtkLoopSubdivisionFilter``
| * ``vtkLinearSubdivisionFilter``
|
| Linear subdivision results in the fastest mesh subdivision,
| but it does not smooth mesh edges, but rather splits each
| triangle into 4 smaller triangles.
|
| Butterfly and loop subdivision perform smoothing when
| dividing, and may introduce artifacts into the mesh when
| dividing.
|
| .. note::
| Subdivision filter sometimes fails for multiple part
| meshes. The input should be one connected mesh.
|
| Parameters
| ----------
| nsub : int
| Number of subdivisions. Each subdivision creates 4 new
| triangles, so the number of resulting triangles is
| ``nface*4**nsub`` where ``nface`` is the current number of
| faces.
|
| subfilter : str, default: "linear"
| Can be one of the following:
|
| * ``'butterfly'``
| * ``'loop'``
| * ``'linear'``
|
| inplace : bool, default: False
| Updates mesh in-place.
|
| progress_bar : bool, default: False
| Display a progress bar to indicate progress.
|
| Returns
| -------
| pyvista.PolyData
| Subdivided mesh.
|
| Examples
| --------
| First, create an example coarse sphere mesh and plot it.
|
| >>> from pyvista import examples
| >>> import pyvista
| >>> mesh = pyvista.Sphere(phi_resolution=10, theta_resolution=10)
| >>> mesh.plot(show_edges=True, line_width=3)
|
| Subdivide the sphere mesh using linear subdivision.
|
| >>> submesh = mesh.subdivide(1, 'linear')
| >>> submesh.plot(show_edges=True, line_width=3)
|
| Subdivide the sphere mesh using loop subdivision.
|
| >>> submesh = mesh.subdivide(1, 'loop')
| >>> submesh.plot(show_edges=True, line_width=3)
|
| Subdivide the sphere mesh using butterfly subdivision.
|
| >>> submesh = mesh.subdivide(1, 'butterfly')
| >>> submesh.plot(show_edges=True, line_width=3)
|
| subdivide_adaptive(self, max_edge_len=None, max_tri_area=None, max_n_tris=None, max_n_passes=None, inplace=False, progress_bar=False)
| Increase the number of triangles in a triangular mesh based on edge and/or area metrics.
|
| This filter uses a simple case-based, multi-pass approach to
| repeatedly subdivide the input triangle mesh to meet the area
| and/or edge length criteria. New points may be inserted only
| on edges; depending on the number of edges to be subdivided a
| different number of triangles are inserted ranging from two
| (i.e., two triangles replace the original one) to four.
|
| Point and cell data is treated as follows: The cell data from
| a parent triangle is assigned to its subdivided
| children. Point data is interpolated along edges as the edges
| are subdivided.
|
| This filter retains mesh watertightness if the mesh was
| originally watertight; and the area and max triangles criteria
| are not used.
|
| Parameters
| ----------
| max_edge_len : float, optional
| The maximum edge length that a triangle may have. Edges
| longer than this value are split in half and the
| associated triangles are modified accordingly.
|
| max_tri_area : float, optional
| The maximum area that a triangle may have. Triangles
| larger than this value are subdivided to meet this
| threshold. Note that if this criterion is used it may
| produce non-watertight meshes as a result.
|
| max_n_tris : int, optional
| The maximum number of triangles that can be created. If
| the limit is hit, it may result in premature termination
| of the algorithm and the results may be less than
| satisfactory (for example non-watertight meshes may be
| created). By default, the limit is set to a very large
| number (i.e., no effective limit).
|
| max_n_passes : int, optional
| The maximum number of passes (i.e., levels of
| subdivision). If the limit is hit, then the subdivision
| process stops and additional passes (needed to meet other
| criteria) are aborted. The default limit is set to a very
| large number (i.e., no effective limit).
|
| inplace : bool, default: False
| Updates mesh in-place.
|
| progress_bar : bool, default: False
| Display a progress bar to indicate progress.
|
| Returns
| -------
| pyvista.PolyData
| Subdivided mesh.
|
| Examples
| --------
| First, load the example airplane mesh and plot it.
|
| >>> import pyvista
| >>> from pyvista import examples
| >>> mesh = pyvista.PolyData(examples.planefile)
| >>> mesh.plot(show_edges=True, line_width=3)
|
| Subdivide the mesh
|
| >>> submesh = mesh.subdivide_adaptive(max_n_passes=2)
| >>> submesh.plot(show_edges=True)
|
| triangulate(self, inplace=False, progress_bar=False)
| Return an all triangle mesh.
|
| More complex polygons will be broken down into triangles.
|
| Parameters
| ----------
| inplace : bool, default: False
| Whether to update the mesh in-place.
|
| progress_bar : bool, default: False
| Display a progress bar to indicate progress.
|
| Returns
| -------
| pyvista.PolyData
| Mesh containing only triangles.
|
| Examples
| --------
| Generate a mesh with quadrilateral faces.
|
| >>> import pyvista
| >>> plane = pyvista.Plane()
| >>> plane.point_data.clear()
| >>> plane.plot(show_edges=True, line_width=5)
|
| Convert it to an all triangle mesh.
|
| >>> mesh = plane.triangulate()
| >>> mesh.plot(show_edges=True, line_width=5)
|
| tube(self, radius=None, scalars=None, capping=True, n_sides=20, radius_factor=10.0, absolute=False, preference='point', inplace=False, progress_bar=False)
| Generate a tube around each input line.
|
| The radius of the tube can be set to linearly vary with a
| scalar value.
|
| Parameters
| ----------
| radius : float, optional
| Minimum tube radius (minimum because the tube radius may
| vary).
|
| scalars : str, optional
| Scalars array by which the radius varies.
|
| capping : bool, default: True
| Turn on/off whether to cap the ends with polygons.
|
| n_sides : int, default: 20
| Set the number of sides for the tube. Minimum of 3.
|
| radius_factor : float, default: 10.0
| Maximum tube radius in terms of a multiple of the minimum
| radius.
|
| absolute : bool, default: False
| Vary the radius with values from scalars in absolute units.
|
| preference : str, default: 'point'
| The field preference when searching for the scalars array by
| name.
|
| inplace : bool, default: False
| Whether to update the mesh in-place.
|
| progress_bar : bool, default: False
| Display a progress bar to indicate progress.
|
| Returns
| -------
| pyvista.PolyData
| Tube-filtered mesh.
|
| Examples
| --------
| Convert a single line to a tube.
|
| >>> import pyvista as pv
| >>> line = pv.Line()
| >>> tube = line.tube(radius=0.02)
| >>> f'Line Cells: {line.n_cells}'
| 'Line Cells: 1'
| >>> f'Tube Cells: {tube.n_cells}'
| 'Tube Cells: 22'
| >>> tube.plot(color='lightblue')
|
| See :ref:`create_spline_example` for more examples using this filter.
|
| ----------------------------------------------------------------------
| Methods inherited from pyvista.core.filters.data_set.DataSetFilters:
|
| align(self, target, max_landmarks=100, max_mean_distance=1e-05, max_iterations=500, check_mean_distance=True, start_by_matching_centroids=True, return_matrix=False)
| Align a dataset to another.
|
| Uses the iterative closest point algorithm to align the points of the
| two meshes. See the VTK class `vtkIterativeClosestPointTransform
| <https://vtk.org/doc/nightly/html/classvtkIterativeClosestPointTransform.html>`_
|
| Parameters
| ----------
| target : pyvista.DataSet
| The target dataset to align to.
|
| max_landmarks : int, default: 100
| The maximum number of landmarks.
|
| max_mean_distance : float, default: 1e-5
| The maximum mean distance for convergence.
|
| max_iterations : int, default: 500
| The maximum number of iterations.
|
| check_mean_distance : bool, default: True
| Whether to check the mean distance for convergence.
|
| start_by_matching_centroids : bool, default: True
| Whether to start the alignment by matching centroids. Default is True.
|
| return_matrix : bool, default: False
| Return the transform matrix as well as the aligned mesh.
|
| Returns
| -------
| aligned : pyvista.DataSet
| The dataset aligned to the target mesh.
|
| matrix : numpy.ndarray
| Transform matrix to transform the input dataset to the target dataset.
|
| Examples
| --------
| Create a cylinder, translate it, and use iterative closest point to
| align mesh to its original position.
|
| >>> import pyvista as pv
| >>> import numpy as np
| >>> source = pv.Cylinder(resolution=30).triangulate().subdivide(1)
| >>> transformed = source.rotate_y(20).translate([-0.75, -0.5, 0.5])
| >>> aligned = transformed.align(source)
| >>> _, closest_points = aligned.find_closest_cell(
| ... source.points, return_closest_point=True
| ... )
| >>> dist = np.linalg.norm(source.points - closest_points, axis=1)
|
| Visualize the source, transformed, and aligned meshes.
|
| >>> pl = pv.Plotter(shape=(1, 2))
| >>> _ = pl.add_text('Before Alignment')
| >>> _ = pl.add_mesh(
| ... source, style='wireframe', opacity=0.5, line_width=2
| ... )
| >>> _ = pl.add_mesh(transformed)
| >>> pl.subplot(0, 1)
| >>> _ = pl.add_text('After Alignment')
| >>> _ = pl.add_mesh(
| ... source, style='wireframe', opacity=0.5, line_width=2
| ... )
| >>> _ = pl.add_mesh(
| ... aligned,
| ... scalars=dist,
| ... scalar_bar_args={
| ... 'title': 'Distance to Source',
| ... 'fmt': '%.1E',
| ... },
| ... )
| >>> pl.show()
|
| Show that the mean distance between the source and the target is
| nearly zero.
|
| >>> np.abs(dist).mean() # doctest:+SKIP
| 9.997635192915073e-05
|
| cell_centers(self, vertex=True, progress_bar=False)
| Generate points at the center of the cells in this dataset.
|
| These points can be used for placing glyphs or vectors.
|
| Parameters
| ----------
| vertex : bool, default: True
| Enable or disable the generation of vertex cells.
|
| progress_bar : bool, default: False
| Display a progress bar to indicate progress.
|
| Returns
| -------
| pyvista.PolyData
| Polydata where the points are the cell centers of the
| original dataset.
|
| Examples
| --------
| >>> import pyvista
| >>> mesh = pyvista.Plane()
| >>> mesh.point_data.clear()
| >>> centers = mesh.cell_centers()
| >>> pl = pyvista.Plotter()
| >>> actor = pl.add_mesh(mesh, show_edges=True)
| >>> actor = pl.add_points(
| ... centers,
| ... render_points_as_spheres=True,
| ... color='red',
| ... point_size=20,
| ... )
| >>> pl.show()
|
| See :ref:`cell_centers_example` for more examples using this filter.
|
| cell_data_to_point_data(self, pass_cell_data=False, progress_bar=False)
| Transform cell data into point data.
|
| Point data are specified per node and cell data specified
| within cells. Optionally, the input point data can be passed
| through to the output.
|
| The method of transformation is based on averaging the data
| values of all cells using a particular point. Optionally, the
| input cell data can be passed through to the output as well.
|
| See also :func:`pyvista.DataSetFilters.point_data_to_cell_data`.
|
| Parameters
| ----------
| pass_cell_data : bool, default: False
| If enabled, pass the input cell data through to the output.
|
| progress_bar : bool, default: False
| Display a progress bar to indicate progress.
|
| Returns
| -------
| pyvista.DataSet
| Dataset with the point data transformed into cell data.
| Return type matches input.
|
| Examples
| --------
| First compute the face area of the example airplane mesh and
| show the cell values. This is to show discrete cell data.
|
| >>> from pyvista import examples
| >>> surf = examples.load_airplane()
| >>> surf = surf.compute_cell_sizes(length=False, volume=False)
| >>> surf.plot(scalars='Area')
|
| These cell scalars can be applied to individual points to
| effectively smooth out the cell data onto the points.
|
| >>> from pyvista import examples
| >>> surf = examples.load_airplane()
| >>> surf = surf.compute_cell_sizes(length=False, volume=False)
| >>> surf = surf.cell_data_to_point_data()
| >>> surf.plot(scalars='Area')
|
| clip(self, normal='x', origin=None, invert=True, value=0.0, inplace=False, return_clipped=False, progress_bar=False, crinkle=False)
| Clip a dataset by a plane by specifying the origin and normal.
|
| If no parameters are given the clip will occur in the center
| of that dataset.
|
| Parameters
| ----------
| normal : tuple(float) or str, default: 'x'
| Length 3 tuple for the normal vector direction. Can also
| be specified as a string conventional direction such as
| ``'x'`` for ``(1, 0, 0)`` or ``'-x'`` for ``(-1, 0, 0)``, etc.
|
| origin : sequence[float], optional
| The center ``(x, y, z)`` coordinate of the plane on which the clip
| occurs. The default is the center of the dataset.
|
| invert : bool, default: True
| Flag on whether to flip/invert the clip.
|
| value : float, default: 0.0
| Set the clipping value along the normal direction.
|
| inplace : bool, default: False
| Updates mesh in-place.
|
| return_clipped : bool, default: False
| Return both unclipped and clipped parts of the dataset.
|
| progress_bar : bool, default: False
| Display a progress bar to indicate progress.
|
| crinkle : bool, default: False
| Crinkle the clip by extracting the entire cells along the
| clip. This adds the ``"cell_ids"`` array to the ``cell_data``
| attribute that tracks the original cell IDs of the original
| dataset.
|
| Returns
| -------
| pyvista.PolyData or tuple(pyvista.PolyData)
| Clipped mesh when ``return_clipped=False``,
| otherwise a tuple containing the unclipped and clipped datasets.
|
| Examples
| --------
| Clip a cube along the +X direction. ``triangulate`` is used as
| the cube is initially composed of quadrilateral faces and
| subdivide only works on triangles.
|
| >>> import pyvista as pv
| >>> cube = pv.Cube().triangulate().subdivide(3)
| >>> clipped_cube = cube.clip()
| >>> clipped_cube.plot()
|
| Clip a cube in the +Z direction. This leaves half a cube
| below the XY plane.
|
| >>> import pyvista as pv
| >>> cube = pv.Cube().triangulate().subdivide(3)
| >>> clipped_cube = cube.clip('z')
| >>> clipped_cube.plot()
|
| See :ref:`clip_with_surface_example` for more examples using this filter.
|
| clip_box(self, bounds=None, invert=True, factor=0.35, progress_bar=False, merge_points=True, crinkle=False)
| Clip a dataset by a bounding box defined by the bounds.
|
| If no bounds are given, a corner of the dataset bounds will be removed.
|
| Parameters
| ----------
| bounds : sequence[float], optional
| Length 6 sequence of floats: ``(xmin, xmax, ymin, ymax, zmin, zmax)``.
| Length 3 sequence of floats: distances from the min coordinate of
| of the input mesh. Single float value: uniform distance from the
| min coordinate. Length 12 sequence of length 3 sequence of floats:
| a plane collection (normal, center, ...).
| :class:`pyvista.PolyData`: if a poly mesh is passed that represents
| a box with 6 faces that all form a standard box, then planes will
| be extracted from the box to define the clipping region.
|
| invert : bool, default: True
| Flag on whether to flip/invert the clip.
|
| factor : float, default: 0.35
| If bounds are not given this is the factor along each axis to
| extract the default box.
|
| progress_bar : bool, default: False
| Display a progress bar to indicate progress.
|
| merge_points : bool, default: True
| If ``True``, coinciding points of independently defined mesh
| elements will be merged.
|
| crinkle : bool, default: False
| Crinkle the clip by extracting the entire cells along the
| clip. This adds the ``"cell_ids"`` array to the ``cell_data``
| attribute that tracks the original cell IDs of the original
| dataset.
|
| Returns
| -------
| pyvista.UnstructuredGrid
| Clipped dataset.
|
| Examples
| --------
| Clip a corner of a cube. The bounds of a cube are normally
| ``[-0.5, 0.5, -0.5, 0.5, -0.5, 0.5]``, and this removes 1/8 of
| the cube's surface.
|
| >>> import pyvista as pv
| >>> cube = pv.Cube().triangulate().subdivide(3)
| >>> clipped_cube = cube.clip_box([0, 1, 0, 1, 0, 1])
| >>> clipped_cube.plot()
|
| See :ref:`clip_with_plane_box_example` for more examples using this filter.
|
| clip_scalar(self, scalars=None, invert=True, value=0.0, inplace=False, progress_bar=False, both=False)
| Clip a dataset by a scalar.
|
| Parameters
| ----------
| scalars : str, optional
| Name of scalars to clip on. Defaults to currently active scalars.
|
| invert : bool, default: True
| Flag on whether to flip/invert the clip. When ``True``,
| only the mesh below ``value`` will be kept. When
| ``False``, only values above ``value`` will be kept.
|
| value : float, default: 0.0
| Set the clipping value.
|
| inplace : bool, default: False
| Update mesh in-place.
|
| progress_bar : bool, default: False
| Display a progress bar to indicate progress.
|
| both : bool, default: False
| If ``True``, also returns the complementary clipped mesh.
|
| Returns
| -------
| pyvista.PolyData or tuple
| Clipped dataset if ``both=False``. If ``both=True`` then
| returns a tuple of both clipped datasets.
|
| Examples
| --------
| Remove the part of the mesh with "sample_point_scalars" above 100.
|
| >>> import pyvista as pv
| >>> from pyvista import examples
| >>> dataset = examples.load_hexbeam()
| >>> clipped = dataset.clip_scalar(
| ... scalars="sample_point_scalars", value=100
| ... )
| >>> clipped.plot()
|
| Get clipped meshes corresponding to the portions of the mesh above and below 100.
|
| >>> import pyvista as pv
| >>> from pyvista import examples
| >>> dataset = examples.load_hexbeam()
| >>> _below, _above = dataset.clip_scalar(
| ... scalars="sample_point_scalars", value=100, both=True
| ... )
|
| Remove the part of the mesh with "sample_point_scalars" below 100.
|
| >>> import pyvista as pv
| >>> from pyvista import examples
| >>> dataset = examples.load_hexbeam()
| >>> clipped = dataset.clip_scalar(
| ... scalars="sample_point_scalars", value=100, invert=False
| ... )
| >>> clipped.plot()
|
| clip_surface(self, surface, invert=True, value=0.0, compute_distance=False, progress_bar=False, crinkle=False)
| Clip any mesh type using a :class:`pyvista.PolyData` surface mesh.
|
| This will return a :class:`pyvista.UnstructuredGrid` of the clipped
| mesh. Geometry of the input dataset will be preserved where possible.
| Geometries near the clip intersection will be triangulated/tessellated.
|
| Parameters
| ----------
| surface : pyvista.PolyData
| The ``PolyData`` surface mesh to use as a clipping
| function. If this input mesh is not a :class`pyvista.PolyData`,
| the external surface will be extracted.
|
| invert : bool, default: True
| Flag on whether to flip/invert the clip.
|
| value : float, default: 0.0
| Set the clipping value of the implicit function (if
| clipping with implicit function) or scalar value (if
| clipping with scalars).
|
| compute_distance : bool, default: False
| Compute the implicit distance from the mesh onto the input
| dataset. A new array called ``'implicit_distance'`` will
| be added to the output clipped mesh.
|
| progress_bar : bool, default: False
| Display a progress bar to indicate progress.
|
| crinkle : bool, default: False
| Crinkle the clip by extracting the entire cells along the
| clip. This adds the ``"cell_ids"`` array to the ``cell_data``
| attribute that tracks the original cell IDs of the original
| dataset.
|
| Returns
| -------
| pyvista.PolyData
| Clipped surface.
|
| Examples
| --------
| Clip a cube with a sphere.
|
| >>> import pyvista
| >>> sphere = pyvista.Sphere(center=(-0.4, -0.4, -0.4))
| >>> cube = pyvista.Cube().triangulate().subdivide(3)
| >>> clipped = cube.clip_surface(sphere)
| >>> clipped.plot(show_edges=True, cpos='xy', line_width=3)
|
| See :ref:`clip_with_surface_example` for more examples using
| this filter.
|
| compute_cell_quality(self, quality_measure='scaled_jacobian', null_value=-1.0, progress_bar=False)
| Compute a function of (geometric) quality for each cell of a mesh.
|
| The per-cell quality is added to the mesh's cell data, in an
| array named ``"CellQuality"``. Cell types not supported by this
| filter or undefined quality of supported cell types will have an
| entry of -1.
|
| Defaults to computing the scaled Jacobian.
|
| Options for cell quality measure:
|
| - ``'area'``
| - ``'aspect_beta'``
| - ``'aspect_frobenius'``
| - ``'aspect_gamma'``
| - ``'aspect_ratio'``
| - ``'collapse_ratio'``
| - ``'condition'``
| - ``'diagonal'``
| - ``'dimension'``
| - ``'distortion'``
| - ``'jacobian'``
| - ``'max_angle'``
| - ``'max_aspect_frobenius'``
| - ``'max_edge_ratio'``
| - ``'med_aspect_frobenius'``
| - ``'min_angle'``
| - ``'oddy'``
| - ``'radius_ratio'``
| - ``'relative_size_squared'``
| - ``'scaled_jacobian'``
| - ``'shape'``
| - ``'shape_and_size'``
| - ``'shear'``
| - ``'shear_and_size'``
| - ``'skew'``
| - ``'stretch'``
| - ``'taper'``
| - ``'volume'``
| - ``'warpage'``
|
| Parameters
| ----------
| quality_measure : str, default: 'scaled_jacobian'
| The cell quality measure to use.
|
| null_value : float, default: -1.0
| Float value for undefined quality. Undefined quality are qualities
| that could be addressed by this filter but is not well defined for
| the particular geometry of cell in question, e.g. a volume query
| for a triangle. Undefined quality will always be undefined.
| The default value is -1.
|
| progress_bar : bool, default: False
| Display a progress bar to indicate progress.
|
| Returns
| -------
| pyvista.DataSet
| Dataset with the computed mesh quality in the
| ``cell_data`` as the ``"CellQuality"`` array.
|
| Examples
| --------
| Compute and plot the minimum angle of a sample sphere mesh.
|
| >>> import pyvista
| >>> sphere = pyvista.Sphere(theta_resolution=20, phi_resolution=20)
| >>> cqual = sphere.compute_cell_quality('min_angle')
| >>> cqual.plot(show_edges=True)
|
| See the :ref:`mesh_quality_example` for more examples using this filter.
|
| compute_cell_sizes(self, length=True, area=True, volume=True, progress_bar=False)
| Compute sizes for 1D (length), 2D (area) and 3D (volume) cells.
|
| Parameters
| ----------
| length : bool, default: True
| Specify whether or not to compute the length of 1D cells.
|
| area : bool, default: True
| Specify whether or not to compute the area of 2D cells.
|
| volume : bool, default: True
| Specify whether or not to compute the volume of 3D cells.
|
| progress_bar : bool, default: False
| Display a progress bar to indicate progress.
|
| Returns
| -------
| pyvista.DataSet
| Dataset with `cell_data` containing the ``"Length"``,
| ``"Area"``, and ``"Volume"`` arrays if set in the
| parameters. Return type matches input.
|
| Notes
| -----
| If cells do not have a dimension (for example, the length of
| hexahedral cells), the corresponding array will be all zeros.
|
| Examples
| --------
| Compute the face area of the example airplane mesh.
|
| >>> from pyvista import examples
| >>> surf = examples.load_airplane()
| >>> surf = surf.compute_cell_sizes(length=False, volume=False)
| >>> surf.plot(show_edges=True, scalars='Area')
|
| compute_derivative(self, scalars=None, gradient=True, divergence=None, vorticity=None, qcriterion=None, faster=False, preference='point', progress_bar=False)
| Compute derivative-based quantities of point/cell scalar field.
|
| Utilize ``vtkGradientFilter`` to compute derivative-based quantities,
| such as gradient, divergence, vorticity, and Q-criterion, of the
| selected point or cell scalar field.
|
| Parameters
| ----------
| scalars : str, optional
| String name of the scalars array to use when computing the
| derivative quantities. Defaults to the active scalars in
| the dataset.
|
| gradient : bool | str, default: True
| Calculate gradient. If a string is passed, the string will be used
| for the resulting array name. Otherwise, array name will be
| ``'gradient'``. Default ``True``.
|
| divergence : bool | str, optional
| Calculate divergence. If a string is passed, the string will be
| used for the resulting array name. Otherwise, default array name
| will be ``'divergence'``.
|
| vorticity : bool | str, optional
| Calculate vorticity. If a string is passed, the string will be used
| for the resulting array name. Otherwise, default array name will be
| ``'vorticity'``.
|
| qcriterion : bool | str, optional
| Calculate qcriterion. If a string is passed, the string will be
| used for the resulting array name. Otherwise, default array name
| will be ``'qcriterion'``.
|
| faster : bool, default: False
| Use faster algorithm for computing derivative quantities. Result is
| less accurate and performs fewer derivative calculations,
| increasing computation speed. The error will feature smoothing of
| the output and possibly errors at boundaries. Option has no effect
| if DataSet is not :class:`pyvista.UnstructuredGrid`.
|
| preference : str, default: "point"
| Data type preference. Either ``'point'`` or ``'cell'``.
|
| progress_bar : bool, default: False
| Display a progress bar to indicate progress.
|
| Returns
| -------
| pyvista.DataSet
| Dataset with calculated derivative.
|
| Examples
| --------
| First, plot the random hills dataset with the active elevation
| scalars. These scalars will be used for the derivative
| calculations.
|
| >>> from pyvista import examples
| >>> hills = examples.load_random_hills()
| >>> hills.plot(smooth_shading=True)
|
| Compute and plot the gradient of the active scalars.
|
| >>> from pyvista import examples
| >>> hills = examples.load_random_hills()
| >>> deriv = hills.compute_derivative()
| >>> deriv.plot(scalars='gradient')
|
| See the :ref:`gradients_example` for more examples using this filter.
|
| compute_implicit_distance(self, surface, inplace=False)
| Compute the implicit distance from the points to a surface.
|
| This filter will compute the implicit distance from all of the
| nodes of this mesh to a given surface. This distance will be
| added as a point array called ``'implicit_distance'``.
|
| Nodes of this mesh which are interior to the input surface
| geometry have a negative distance, and nodes on the exterior
| have a positive distance. Nodes which intersect the input
| surface has a distance of zero.
|
| Parameters
| ----------
| surface : pyvista.DataSet
| The surface used to compute the distance.
|
| inplace : bool, default: False
| If ``True``, a new scalar array will be added to the
| ``point_data`` of this mesh and the modified mesh will
| be returned. Otherwise a copy of this mesh is returned
| with that scalar field added.
|
| Returns
| -------
| pyvista.DataSet
| Dataset containing the ``'implicit_distance'`` array in
| ``point_data``.
|
| Examples
| --------
| Compute the distance between all the points on a sphere and a
| plane.
|
| >>> import pyvista as pv
| >>> sphere = pv.Sphere(radius=0.35)
| >>> plane = pv.Plane()
| >>> _ = sphere.compute_implicit_distance(plane, inplace=True)
| >>> dist = sphere['implicit_distance']
| >>> type(dist)
| <class 'pyvista.core.pyvista_ndarray.pyvista_ndarray'>
|
| Plot these distances as a heatmap. Note how distances above the
| plane are positive, and distances below the plane are negative.
|
| >>> pl = pv.Plotter()
| >>> _ = pl.add_mesh(
| ... sphere, scalars='implicit_distance', cmap='bwr'
| ... )
| >>> _ = pl.add_mesh(plane, color='w', style='wireframe')
| >>> pl.show()
|
| We can also compute the distance from all the points on the
| plane to the sphere.
|
| >>> _ = plane.compute_implicit_distance(sphere, inplace=True)
|
| Again, we can plot these distances as a heatmap. Note how
| distances inside the sphere are negative and distances outside
| the sphere are positive.
|
| >>> pl = pv.Plotter()
| >>> _ = pl.add_mesh(
| ... plane,
| ... scalars='implicit_distance',
| ... cmap='bwr',
| ... clim=[-0.35, 0.35],
| ... )
| >>> _ = pl.add_mesh(sphere, color='w', style='wireframe')
| >>> pl.show()
|
| See :ref:`clip_with_surface_example` and
| :ref:`voxelize_surface_mesh_example` for more examples using
| this filter.
|
| connectivity(self, largest=False, progress_bar=False)
| Find and label connected bodies/volumes.
|
| This adds an ID array to the point and cell data to
| distinguish separate connected bodies. This applies a
| ``vtkConnectivityFilter`` filter which extracts cells that
| share common points and/or meet other connectivity criterion.
|
| Cells that share vertices and meet other connectivity
| criterion such as scalar range are known as a region.
|
| Parameters
| ----------
| largest : bool, default: False
| Extract the largest connected part of the mesh.
|
| progress_bar : bool, default: False
| Display a progress bar to indicate progress.
|
| Returns
| -------
| pyvista.DataSet
| Dataset with labeled connected bodies. Return type
| matches input.
|
| Examples
| --------
| Join two meshes together and plot their connectivity.
|
| >>> import pyvista
| >>> mesh = pyvista.Sphere() + pyvista.Sphere(center=(2, 0, 0))
| >>> conn = mesh.connectivity(largest=False)
| >>> conn.plot(cmap=['red', 'blue'])
|
| See :ref:`volumetric_example` for more examples using this filter.
|
| contour(self, isosurfaces=10, scalars=None, compute_normals=False, compute_gradients=False, compute_scalars=True, rng=None, preference='point', method='contour', progress_bar=False)
| Contour an input self by an array.
|
| ``isosurfaces`` can be an integer specifying the number of
| isosurfaces in the data range or a sequence of values for
| explicitly setting the isosurfaces.
|
| Parameters
| ----------
| isosurfaces : int | sequence[float], optional
| Number of isosurfaces to compute across valid data range or a
| sequence of float values to explicitly use as the isosurfaces.
|
| scalars : str | array_like[float], optional
| Name or array of scalars to threshold on. If this is an array, the
| output of this filter will save them as ``"Contour Data"``.
| Defaults to currently active scalars.
|
| compute_normals : bool, default: False
| Compute normals for the dataset.
|
| compute_gradients : bool, default: False
| Compute gradients for the dataset.
|
| compute_scalars : bool, default: True
| Preserves the scalar values that are being contoured.
|
| rng : sequence[float], optional
| If an integer number of isosurfaces is specified, this is
| the range over which to generate contours. Default is the
| scalars array's full data range.
|
| preference : str, default: "point"
| When ``scalars`` is specified, this is the preferred array
| type to search for in the dataset. Must be either
| ``'point'`` or ``'cell'``.
|
| method : str, default: "contour"
| Specify to choose which vtk filter is used to create the contour.
| Must be one of ``'contour'``, ``'marching_cubes'`` and
| ``'flying_edges'``.
|
| progress_bar : bool, default: False
| Display a progress bar to indicate progress.
|
| Returns
| -------
| pyvista.PolyData
| Contoured surface.
|
| Examples
| --------
| Generate contours for the random hills dataset.
|
| >>> from pyvista import examples
| >>> hills = examples.load_random_hills()
| >>> contours = hills.contour()
| >>> contours.plot(line_width=5)
|
| Generate the surface of a mobius strip using flying edges.
|
| >>> import pyvista as pv
| >>> a = 0.4
| >>> b = 0.1
| >>> def f(x, y, z):
| ... xx = x * x
| ... yy = y * y
| ... zz = z * z
| ... xyz = x * y * z
| ... xx_yy = xx + yy
| ... a_xx = a * xx
| ... b_yy = b * yy
| ... return (
| ... (xx_yy + 1) * (a_xx + b_yy)
| ... + zz * (b * xx + a * yy)
| ... - 2 * (a - b) * xyz
| ... - a * b * xx_yy
| ... ) ** 2 - 4 * (xx + yy) * (a_xx + b_yy - xyz * (a - b)) ** 2
| ...
| >>> n = 100
| >>> x_min, y_min, z_min = -1.35, -1.7, -0.65
| >>> grid = pv.ImageData(
| ... dimensions=(n, n, n),
| ... spacing=(
| ... abs(x_min) / n * 2,
| ... abs(y_min) / n * 2,
| ... abs(z_min) / n * 2,
| ... ),
| ... origin=(x_min, y_min, z_min),
| ... )
| >>> x, y, z = grid.points.T
| >>> values = f(x, y, z)
| >>> out = grid.contour(
| ... 1,
| ... scalars=values,
| ... rng=[0, 0],
| ... method='flying_edges',
| ... )
| >>> out.plot(color='lightblue', smooth_shading=True)
|
| See :ref:`common_filter_example` or
| :ref:`marching_cubes_example` for more examples using this
| filter.
|
| ctp(self, pass_cell_data=False, progress_bar=False, **kwargs)
| Transform cell data into point data.
|
| Point data are specified per node and cell data specified
| within cells. Optionally, the input point data can be passed
| through to the output.
|
| This method is an alias for
| :func:`pyvista.DataSetFilters.cell_data_to_point_data`.
|
| Parameters
| ----------
| pass_cell_data : bool, default: False
| If enabled, pass the input cell data through to the output.
|
| progress_bar : bool, default: False
| Display a progress bar to indicate progress.
|
| **kwargs : dict, optional
| Deprecated keyword argument ``pass_cell_arrays``.
|
| Returns
| -------
| pyvista.DataSet
| Dataset with the cell data transformed into point data.
| Return type matches input.
|
| decimate_boundary(self, target_reduction=0.5, progress_bar=False)
| Return a decimated version of a triangulation of the boundary.
|
| Only the outer surface of the input dataset will be considered.
|
| Parameters
| ----------
| target_reduction : float, default: 0.5
| Fraction of the original mesh to remove.
| TargetReduction is set to ``0.9``, this filter will try to reduce
| the data set to 10% of its original size and will remove 90%
| of the input triangles.
|
| progress_bar : bool, default: False
| Display a progress bar to indicate progress.
|
| Returns
| -------
| pyvista.PolyData
| Decimated boundary.
|
| Examples
| --------
| See the :ref:`linked_views_example` example.
|
| delaunay_3d(self, alpha=0.0, tol=0.001, offset=2.5, progress_bar=False)
| Construct a 3D Delaunay triangulation of the mesh.
|
| This filter can be used to generate a 3D tetrahedral mesh from
| a surface or scattered points. If you want to create a
| surface from a point cloud, see
| :func:`pyvista.PolyDataFilters.reconstruct_surface`.
|
| Parameters
| ----------
| alpha : float, default: 0.0
| Distance value to control output of this filter. For a
| non-zero alpha value, only vertices, edges, faces, or
| tetrahedra contained within the circumsphere (of radius
| alpha) will be output. Otherwise, only tetrahedra will be
| output.
|
| tol : float, default: 0.001
| Tolerance to control discarding of closely spaced points.
| This tolerance is specified as a fraction of the diagonal
| length of the bounding box of the points.
|
| offset : float, default: 2.5
| Multiplier to control the size of the initial, bounding
| Delaunay triangulation.
|
| progress_bar : bool, default: False
| Display a progress bar to indicate progress.
|
| Returns
| -------
| pyvista.UnstructuredGrid
| UnstructuredGrid containing the Delaunay triangulation.
|
| Examples
| --------
| Generate a 3D Delaunay triangulation of a surface mesh of a
| sphere and plot the interior edges generated.
|
| >>> import pyvista
| >>> sphere = pyvista.Sphere(theta_resolution=5, phi_resolution=5)
| >>> grid = sphere.delaunay_3d()
| >>> edges = grid.extract_all_edges()
| >>> edges.plot(line_width=5, color='k')
|
| elevation(self, low_point=None, high_point=None, scalar_range=None, preference='point', set_active=True, progress_bar=False)
| Generate scalar values on a dataset.
|
| The scalar values lie within a user specified range, and are
| generated by computing a projection of each dataset point onto
| a line. The line can be oriented arbitrarily. A typical
| example is to generate scalars based on elevation or height
| above a plane.
|
| .. warning::
| This will create a scalars array named ``'Elevation'`` on the
| point data of the input dataset and overwrite the array
| named ``'Elevation'`` if present.
|
| Parameters
| ----------
| low_point : sequence[float], optional
| The low point of the projection line in 3D space. Default is bottom
| center of the dataset. Otherwise pass a length 3 sequence.
|
| high_point : sequence[float], optional
| The high point of the projection line in 3D space. Default is top
| center of the dataset. Otherwise pass a length 3 sequence.
|
| scalar_range : str | sequence[float], optional
| The scalar range to project to the low and high points on the line
| that will be mapped to the dataset. If None given, the values will
| be computed from the elevation (Z component) range between the
| high and low points. Min and max of a range can be given as a length
| 2 sequence. If ``str``, name of scalar array present in the
| dataset given, the valid range of that array will be used.
|
| preference : str, default: "point"
| When an array name is specified for ``scalar_range``, this is the
| preferred array type to search for in the dataset.
| Must be either ``'point'`` or ``'cell'``.
|
| set_active : bool, default: True
| A boolean flag on whether or not to set the new
| ``'Elevation'`` scalar as the active scalars array on the
| output dataset.
|
| progress_bar : bool, default: False
| Display a progress bar to indicate progress.
|
| Returns
| -------
| pyvista.DataSet
| Dataset containing elevation scalars in the
| ``"Elevation"`` array in ``point_data``.
|
| Examples
| --------
| Generate the "elevation" scalars for a sphere mesh. This is
| simply the height in Z from the XY plane.
|
| >>> import pyvista
| >>> sphere = pyvista.Sphere()
| >>> sphere_elv = sphere.elevation()
| >>> sphere_elv.plot(smooth_shading=True)
|
| Access the first 4 elevation scalars. This is a point-wise
| array containing the "elevation" of each point.
|
| >>> sphere_elv['Elevation'][:4] # doctest:+SKIP
| array([-0.5 , 0.5 , -0.49706897, -0.48831028], dtype=float32)
|
| See :ref:`common_filter_example` for more examples using this filter.
|
| explode(self, factor=0.1)
| Push each individual cell away from the center of the dataset.
|
| Parameters
| ----------
| factor : float, default: 0.1
| How much each cell will move from the center of the dataset
| relative to its distance from it. Increase this number to push the
| cells farther away.
|
| Returns
| -------
| pyvista.UnstructuredGrid
| UnstructuredGrid containing the exploded cells.
|
| Notes
| -----
| This is similar to :func:`shrink <pyvista.DataSetFilters.shrink>`
| except that it does not change the size of the cells.
|
| Examples
| --------
| >>> import numpy as np
| >>> import pyvista as pv
| >>> xrng = np.linspace(0, 1, 3)
| >>> yrng = np.linspace(0, 2, 4)
| >>> zrng = np.linspace(0, 3, 5)
| >>> grid = pv.RectilinearGrid(xrng, yrng, zrng)
| >>> exploded = grid.explode()
| >>> exploded.plot(show_edges=True)
|
| extract_all_edges(self, use_all_points=False, clear_data=False, progress_bar=False)
| Extract all the internal/external edges of the dataset as PolyData.
|
| This produces a full wireframe representation of the input dataset.
|
| Parameters
| ----------
| use_all_points : bool, default: False
| Indicates whether all of the points of the input mesh should exist
| in the output. When ``True``, point numbering does not change and
| a threaded approach is used, which avoids the use of a point locator
| and is quicker.
|
| By default this is set to ``False``, and unused points are omitted
| from the output.
|
| This parameter can only be set to ``True`` with ``vtk==9.1.0`` or newer.
|
| clear_data : bool, default: False
| Clear any point, cell, or field data. This is useful
| if wanting to strictly extract the edges.
|
| progress_bar : bool, default: False
| Display a progress bar to indicate progress.
|
| Returns
| -------
| pyvista.PolyData
| Edges extracted from the dataset.
|
| Examples
| --------
| Extract the edges of a sample unstructured grid and plot the edges.
| Note how it plots interior edges.
|
| >>> import pyvista
| >>> from pyvista import examples
| >>> hex_beam = pyvista.read(examples.hexbeamfile)
| >>> edges = hex_beam.extract_all_edges()
| >>> edges.plot(line_width=5, color='k')
|
| See :ref:`cell_centers_example` for more examples using this filter.
|
| extract_cells(self, ind, invert=False, progress_bar=False)
| Return a subset of the grid.
|
| Parameters
| ----------
| ind : sequence[int]
| Numpy array of cell indices to be extracted.
|
| invert : bool, default: False
| Invert the selection.
|
| progress_bar : bool, default: False
| Display a progress bar to indicate progress.
|
| Returns
| -------
| pyvista.UnstructuredGrid
| Subselected grid.
|
| Examples
| --------
| >>> import pyvista
| >>> from pyvista import examples
| >>> grid = pyvista.read(examples.hexbeamfile)
| >>> subset = grid.extract_cells(range(20))
| >>> subset.n_cells
| 20
| >>> pl = pyvista.Plotter()
| >>> actor = pl.add_mesh(
| ... grid, style='wireframe', line_width=5, color='black'
| ... )
| >>> actor = pl.add_mesh(subset, color='grey')
| >>> pl.show()
|
| extract_cells_by_type(self, cell_types, progress_bar=False)
| Extract cells of a specified type.
|
| Given an input dataset and a list of cell types, produce an output
| dataset containing only cells of the specified type(s). Note that if
| the input dataset is homogeneous (e.g., all cells are of the same type)
| and the cell type is one of the cells specified, then the input dataset
| is shallow copied to the output.
|
| The type of output dataset is always the same as the input type. Since
| structured types of data (i.e., :class:`pyvista.ImageData`,
| :class:`pyvista.StructuredGrid`, :class`pyvista.RectilnearGrid`)
| are all composed of a cell of the same
| type, the output is either empty, or a shallow copy of the input.
| Unstructured data (:class:`pyvista.UnstructuredGrid`,
| :class:`pyvista.PolyData`) input may produce a subset of the input data
| (depending on the selected cell types).
|
| Parameters
| ----------
| cell_types : int | sequence[int]
| The cell types to extract. Must be a single or list of integer cell
| types. See :class:`pyvista.CellType`.
|
| progress_bar : bool, default: False
| Display a progress bar to indicate progress.
|
| Returns
| -------
| pyvista.DataSet
| Dataset with the extracted cells. Type is the same as the input.
|
| Notes
| -----
| Unlike :func:`pyvista.DataSetFilters.extract_cells` which always
| produces a :class:`pyvista.UnstructuredGrid` output, this filter
| produces the same output type as input type.
|
| Examples
| --------
| Create an unstructured grid with both hexahedral and tetrahedral
| cells and then extract each individual cell type.
|
| >>> import pyvista as pv
| >>> from pyvista import examples
| >>> beam = examples.load_hexbeam()
| >>> beam = beam.translate([1, 0, 0])
| >>> ugrid = beam + examples.load_tetbeam()
| >>> hex_cells = ugrid.extract_cells_by_type(pv.CellType.HEXAHEDRON)
| >>> tet_cells = ugrid.extract_cells_by_type(pv.CellType.TETRA)
| >>> pl = pv.Plotter(shape=(1, 2))
| >>> _ = pl.add_text('Extracted Hexahedron cells')
| >>> _ = pl.add_mesh(hex_cells, show_edges=True)
| >>> pl.subplot(0, 1)
| >>> _ = pl.add_text('Extracted Tetrahedron cells')
| >>> _ = pl.add_mesh(tet_cells, show_edges=True)
| >>> pl.show()
|
| extract_feature_edges(self, feature_angle=30.0, boundary_edges=True, non_manifold_edges=True, feature_edges=True, manifold_edges=True, clear_data=False, progress_bar=False)
| Extract edges from the surface of the mesh.
|
| If the given mesh is not PolyData, the external surface of the given
| mesh is extracted and used.
|
| From vtk documentation, the edges are one of the following:
|
| 1) Boundary (used by one polygon) or a line cell.
| 2) Non-manifold (used by three or more polygons).
| 3) Feature edges (edges used by two triangles and whose
| dihedral angle > feature_angle).
| 4) Manifold edges (edges used by exactly two polygons).
|
| Parameters
| ----------
| feature_angle : float, default: 30.0
| Feature angle (in degrees) used to detect sharp edges on
| the mesh. Used only when ``feature_edges=True``.
|
| boundary_edges : bool, default: True
| Extract the boundary edges.
|
| non_manifold_edges : bool, default: True
| Extract non-manifold edges.
|
| feature_edges : bool, default: True
| Extract edges exceeding ``feature_angle``.
|
| manifold_edges : bool, default: True
| Extract manifold edges.
|
| clear_data : bool, default: False
| Clear any point, cell, or field data. This is useful
| if wanting to strictly extract the edges.
|
| progress_bar : bool, default: False
| Display a progress bar to indicate progress.
|
| Returns
| -------
| pyvista.PolyData
| Extracted edges.
|
| Examples
| --------
| Extract the edges from an unstructured grid.
|
| >>> import pyvista
| >>> from pyvista import examples
| >>> hex_beam = pyvista.read(examples.hexbeamfile)
| >>> feat_edges = hex_beam.extract_feature_edges()
| >>> feat_edges.clear_data() # clear array data for plotting
| >>> feat_edges.plot(line_width=10)
|
| See the :ref:`extract_edges_example` for more examples using this filter.
|
| extract_geometry(self, extent: Optional[Sequence[float]] = None, progress_bar=False)
| Extract the outer surface of a volume or structured grid dataset.
|
| This will extract all 0D, 1D, and 2D cells producing the
| boundary faces of the dataset.
|
| .. note::
| This tends to be less efficient than :func:`extract_surface`.
|
| Parameters
| ----------
| extent : sequence[float], optional
| Specify a ``(xmin, xmax, ymin, ymax, zmin, zmax)`` bounding box to
| clip data.
|
| progress_bar : bool, default: False
| Display a progress bar to indicate progress.
|
| Returns
| -------
| pyvista.PolyData
| Surface of the dataset.
|
| Examples
| --------
| Extract the surface of a sample unstructured grid.
|
| >>> import pyvista
| >>> from pyvista import examples
| >>> hex_beam = pyvista.read(examples.hexbeamfile)
| >>> hex_beam.extract_geometry()
| PolyData (...)
| N Cells: 88
| N Points: 90
| N Strips: 0
| X Bounds: 0.000e+00, 1.000e+00
| Y Bounds: 0.000e+00, 1.000e+00
| Z Bounds: 0.000e+00, 5.000e+00
| N Arrays: 3
|
| See :ref:`surface_smoothing_example` for more examples using this filter.
|
| extract_largest(self, inplace=False, progress_bar=False)
| Extract largest connected set in mesh.
|
| Can be used to reduce residues obtained when generating an
| isosurface. Works only if residues are not connected (share
| at least one point with) the main component of the image.
|
| Parameters
| ----------
| inplace : bool, default: False
| Updates mesh in-place.
|
| progress_bar : bool, default: False
| Display a progress bar to indicate progress.
|
| Returns
| -------
| pyvista.DataSet
| Largest connected set in the dataset. Return type matches input.
|
| Examples
| --------
| Join two meshes together, extract the largest, and plot it.
|
| >>> import pyvista
| >>> mesh = pyvista.Sphere() + pyvista.Cube()
| >>> largest = mesh.extract_largest()
| >>> largest.point_data.clear()
| >>> largest.cell_data.clear()
| >>> largest.plot()
|
| See :ref:`volumetric_example` for more examples using this filter.
|
| extract_points(self, ind, adjacent_cells=True, include_cells=True, progress_bar=False)
| Return a subset of the grid (with cells) that contains any of the given point indices.
|
| Parameters
| ----------
| ind : sequence[int]
| Sequence of point indices to be extracted.
|
| adjacent_cells : bool, default: True
| If ``True``, extract the cells that contain at least one of
| the extracted points. If ``False``, extract the cells that
| contain exclusively points from the extracted points list.
|
| include_cells : bool, default: True
| Specifies if the cells shall be returned or not.
|
| progress_bar : bool, default: False
| Display a progress bar to indicate progress.
|
| Returns
| -------
| pyvista.UnstructuredGrid
| Subselected grid.
|
| Examples
| --------
| Extract all the points of a sphere with a Z coordinate greater than 0
|
| >>> import pyvista
| >>> sphere = pyvista.Sphere()
| >>> extracted = sphere.extract_points(sphere.points[:, 2] > 0)
| >>> extracted.clear_data() # clear for plotting
| >>> extracted.plot()
|
| extract_surface(self, pass_pointid=True, pass_cellid=True, nonlinear_subdivision=1, progress_bar=False)
| Extract surface mesh of the grid.
|
| Parameters
| ----------
| pass_pointid : bool, default: True
| Adds a point array ``"vtkOriginalPointIds"`` that
| idenfities which original points these surface points
| correspond to.
|
| pass_cellid : bool, default: True
| Adds a cell array ``"vtkOriginalCellIds"`` that
| idenfities which original cells these surface cells
| correspond to.
|
| nonlinear_subdivision : int, default: 1
| If the input is an unstructured grid with nonlinear faces,
| this parameter determines how many times the face is
| subdivided into linear faces.
|
| If 0, the output is the equivalent of its linear
| counterpart (and the midpoints determining the nonlinear
| interpolation are discarded). If 1 (the default), the
| nonlinear face is triangulated based on the midpoints. If
| greater than 1, the triangulated pieces are recursively
| subdivided to reach the desired subdivision. Setting the
| value to greater than 1 may cause some point data to not
| be passed even if no nonlinear faces exist. This option
| has no effect if the input is not an unstructured grid.
|
| progress_bar : bool, default: False
| Display a progress bar to indicate progress.
|
| Returns
| -------
| pyvista.PolyData
| Surface mesh of the grid.
|
| Examples
| --------
| Extract the surface of an UnstructuredGrid.
|
| >>> import pyvista
| >>> from pyvista import examples
| >>> grid = examples.load_hexbeam()
| >>> surf = grid.extract_surface()
| >>> type(surf)
| <class 'pyvista.core.pointset.PolyData'>
| >>> surf["vtkOriginalPointIds"]
| pyvista_ndarray([ 0, 2, 36, 27, 7, 8, 81, 1, 18, 4, 54, 3, 6, 45,
| 72, 5, 63, 9, 35, 44, 11, 16, 89, 17, 10, 26, 62, 13,
| 12, 53, 80, 15, 14, 71, 19, 37, 55, 20, 38, 56, 21, 39,
| 57, 22, 40, 58, 23, 41, 59, 24, 42, 60, 25, 43, 61, 28,
| 82, 29, 83, 30, 84, 31, 85, 32, 86, 33, 87, 34, 88, 46,
| 73, 47, 74, 48, 75, 49, 76, 50, 77, 51, 78, 52, 79, 64,
| 65, 66, 67, 68, 69, 70])
| >>> surf["vtkOriginalCellIds"]
| pyvista_ndarray([ 0, 0, 0, 1, 1, 1, 3, 3, 3, 2, 2, 2, 36, 36,
| 36, 37, 37, 37, 39, 39, 39, 38, 38, 38, 5, 5, 9, 9,
| 13, 13, 17, 17, 21, 21, 25, 25, 29, 29, 33, 33, 4, 4,
| 8, 8, 12, 12, 16, 16, 20, 20, 24, 24, 28, 28, 32, 32,
| 7, 7, 11, 11, 15, 15, 19, 19, 23, 23, 27, 27, 31, 31,
| 35, 35, 6, 6, 10, 10, 14, 14, 18, 18, 22, 22, 26, 26,
| 30, 30, 34, 34])
|
| Note that in the "vtkOriginalCellIds" array, the same original cells
| appears multiple times since this array represents the original cell of
| each surface cell extracted.
|
| See the :ref:`extract_surface_example` for more examples using this filter.
|
| glyph(self, orient=True, scale=True, factor=1.0, geom=None, indices=None, tolerance=None, absolute=False, clamping=False, rng=None, progress_bar=False)
| Copy a geometric representation (called a glyph) to the input dataset.
|
| The glyph may be oriented along the input vectors, and it may
| be scaled according to scalar data or vector
| magnitude. Passing a table of glyphs to choose from based on
| scalars or vector magnitudes is also supported. The arrays
| used for ``orient`` and ``scale`` must be either both point data
| or both cell data.
|
| Parameters
| ----------
| orient : bool | str, default: True
| If ``True``, use the active vectors array to orient the glyphs.
| If string, the vector array to use to orient the glyphs.
| If ``False``, the glyphs will not be orientated.
|
| scale : bool | str | sequence[float], default: True
| If ``True``, use the active scalars to scale the glyphs.
| If string, the scalar array to use to scale the glyphs.
| If ``False``, the glyphs will not be scaled.
|
| factor : float, default: 1.0
| Scale factor applied to scaling array.
|
| geom : vtk.vtkDataSet or tuple(vtk.vtkDataSet), optional
| The geometry to use for the glyph. If missing, an arrow glyph
| is used. If a sequence, the datasets inside define a table of
| geometries to choose from based on scalars or vectors. In this
| case a sequence of numbers of the same length must be passed as
| ``indices``. The values of the range (see ``rng``) affect lookup
| in the table.
|
| indices : sequence[float], optional
| Specifies the index of each glyph in the table for lookup in case
| ``geom`` is a sequence. If given, must be the same length as
| ``geom``. If missing, a default value of ``range(len(geom))`` is
| used. Indices are interpreted in terms of the scalar range
| (see ``rng``). Ignored if ``geom`` has length 1.
|
| tolerance : float, optional
| Specify tolerance in terms of fraction of bounding box length.
| Float value is between 0 and 1. Default is None. If ``absolute``
| is ``True`` then the tolerance can be an absolute distance.
| If ``None``, points merging as a preprocessing step is disabled.
|
| absolute : bool, default: False
| Control if ``tolerance`` is an absolute distance or a fraction.
|
| clamping : bool, default: False
| Turn on/off clamping of "scalar" values to range.
|
| rng : sequence[float], optional
| Set the range of values to be considered by the filter
| when scalars values are provided.
|
| progress_bar : bool, default: False
| Display a progress bar to indicate progress.
|
| Returns
| -------
| pyvista.PolyData
| Glyphs at either the cell centers or points.
|
| Examples
| --------
| Create arrow glyphs oriented by vectors and scaled by scalars.
| Factor parameter is used to reduce the size of the arrows.
|
| >>> import pyvista
| >>> from pyvista import examples
| >>> mesh = examples.load_random_hills()
| >>> arrows = mesh.glyph(
| ... scale="Normals", orient="Normals", tolerance=0.05
| ... )
| >>> pl = pyvista.Plotter()
| >>> actor = pl.add_mesh(arrows, color="black")
| >>> actor = pl.add_mesh(
| ... mesh,
| ... scalars="Elevation",
| ... cmap="terrain",
| ... show_scalar_bar=False,
| ... )
| >>> pl.show()
|
| See :ref:`glyph_example` and :ref:`glyph_table_example` for more
| examples using this filter.
|
| integrate_data(self, progress_bar=False)
| Integrate point and cell data.
|
| Area or volume is also provided in point data.
|
| This filter uses the VTK `vtkIntegrateAttributes
| <https://vtk.org/doc/nightly/html/classvtkIntegrateAttributes.html>`_
| and requires VTK v9.1.0 or newer.
|
| Parameters
| ----------
| progress_bar : bool, default: False
| Display a progress bar to indicate progress.
|
| Returns
| -------
| pyvista.UnstructuredGrid
| Mesh with 1 point and 1 vertex cell with integrated data in point
| and cell data.
|
| Examples
| --------
| Integrate data on a sphere mesh.
|
| >>> import pyvista
| >>> import numpy as np
| >>> sphere = pyvista.Sphere(
| ... theta_resolution=100, phi_resolution=100
| ... )
| >>> sphere.point_data["data"] = 2 * np.ones(sphere.n_points)
| >>> integrated = sphere.integrate_data()
|
| There is only 1 point and cell, so access the only value.
|
| >>> integrated["Area"][0]
| 3.14
| >>> integrated["data"][0]
| 6.28
|
| See the :ref:`integrate_example` for more examples using this filter.
|
| interpolate(self, target, sharpness=2.0, radius=1.0, strategy='null_value', null_value=0.0, n_points=None, pass_cell_data=True, pass_point_data=True, progress_bar=False)
| Interpolate values onto this mesh from a given dataset.
|
| The ``target`` dataset is typically a point cloud. Only point data from
| the ``target`` mesh will be interpolated onto points of this mesh. Whether
| preexisting point and cell data of this mesh are preserved in the
| output can be customized with the ``pass_point_data`` and
| ``pass_cell_data`` parameters.
|
| This uses a Gaussian interpolation kernel. Use the ``sharpness`` and
| ``radius`` parameters to adjust this kernel. You can also switch this
| kernel to use an N closest points approach.
|
| If the cell topology is more useful for interpolating, e.g. from a
| discretized FEM or CFD simulation, use
| :func:`pyvista.DataSetFilters.sample` instead.
|
| Parameters
| ----------
| target : pyvista.DataSet
| The vtk data object to sample from. Point and cell arrays from
| this object are interpolated onto this mesh.
|
| sharpness : float, default: 2.0
| Set the sharpness (i.e., falloff) of the Gaussian kernel. As the
| sharpness increases the effects of distant points are reduced.
|
| radius : float, optional
| Specify the radius within which the basis points must lie.
|
| strategy : str, default: "null_value"
| Specify a strategy to use when encountering a "null" point during
| the interpolation process. Null points occur when the local
| neighborhood (of nearby points to interpolate from) is empty. If
| the strategy is set to ``'mask_points'``, then an output array is
| created that marks points as being valid (=1) or null (invalid =0)
| (and the NullValue is set as well). If the strategy is set to
| ``'null_value'``, then the output data value(s) are set to the
| ``null_value`` (specified in the output point data). Finally, the
| strategy ``'closest_point'`` is to simply use the closest point to
| perform the interpolation.
|
| null_value : float, default: 0.0
| Specify the null point value. When a null point is encountered
| then all components of each null tuple are set to this value.
|
| n_points : int, optional
| If given, specifies the number of the closest points used to form
| the interpolation basis. This will invalidate the radius argument
| in favor of an N closest points approach. This typically has poorer
| results.
|
| pass_cell_data : bool, default: True
| Preserve input mesh's original cell data arrays.
|
| pass_point_data : bool, default: True
| Preserve input mesh's original point data arrays.
|
| progress_bar : bool, default: False
| Display a progress bar to indicate progress.
|
| Returns
| -------
| pyvista.DataSet
| Interpolated dataset. Return type matches input.
|
| See Also
| --------
| pyvista.DataSetFilters.sample
|
| Examples
| --------
| Interpolate the values of 5 points onto a sample plane.
|
| >>> import pyvista
| >>> import numpy as np
| >>> np.random.seed(7)
| >>> point_cloud = np.random.random((5, 3))
| >>> point_cloud[:, 2] = 0
| >>> point_cloud -= point_cloud.mean(0)
| >>> pdata = pyvista.PolyData(point_cloud)
| >>> pdata['values'] = np.random.random(5)
| >>> plane = pyvista.Plane()
| >>> plane.clear_data()
| >>> plane = plane.interpolate(pdata, sharpness=3)
| >>> pl = pyvista.Plotter()
| >>> _ = pl.add_mesh(
| ... pdata, render_points_as_spheres=True, point_size=50
| ... )
| >>> _ = pl.add_mesh(plane, style='wireframe', line_width=5)
| >>> pl.show()
|
| See :ref:`interpolate_example` for more examples using this filter.
|
| outline(self, generate_faces=False, progress_bar=False)
| Produce an outline of the full extent for the input dataset.
|
| Parameters
| ----------
| generate_faces : bool, default: False
| Generate solid faces for the box. This is disabled by default.
|
| progress_bar : bool, default: False
| Display a progress bar to indicate progress.
|
| Returns
| -------
| pyvista.PolyData
| Mesh containing an outline of the original dataset.
|
| Examples
| --------
| Generate and plot the outline of a sphere. This is
| effectively the ``(x, y, z)`` bounds of the mesh.
|
| >>> import pyvista
| >>> sphere = pyvista.Sphere()
| >>> outline = sphere.outline()
| >>> pyvista.plot([sphere, outline], line_width=5)
|
| See :ref:`common_filter_example` for more examples using this filter.
|
| outline_corners(self, factor=0.2, progress_bar=False)
| Produce an outline of the corners for the input dataset.
|
| Parameters
| ----------
| factor : float, default: 0.2
| Controls the relative size of the corners to the length of
| the corresponding bounds.
|
| progress_bar : bool, default: False
| Display a progress bar to indicate progress.
|
| Returns
| -------
| pyvista.PolyData
| Mesh containing outlined corners.
|
| Examples
| --------
| Generate and plot the corners of a sphere. This is
| effectively the ``(x, y, z)`` bounds of the mesh.
|
| >>> import pyvista
| >>> sphere = pyvista.Sphere()
| >>> corners = sphere.outline_corners(factor=0.1)
| >>> pyvista.plot([sphere, corners], line_width=5)
|
| partition(self, n_partitions, generate_global_id=False, as_composite=True)
| Break down input dataset into a requested number of partitions.
|
| Cells on boundaries are uniquely assigned to each partition without duplication.
|
| It uses a kdtree implementation that builds balances the cell
| centers among a requested number of partitions. The current implementation
| only supports power-of-2 target partition. If a non-power of two value
| is specified for ``n_partitions``, then the load balancing simply
| uses the power-of-two greater than the requested value
|
| For more details, see `vtkRedistributeDataSetFilter
| <https://vtk.org/doc/nightly/html/classvtkRedistributeDataSetFilter.html>`_.
|
| Parameters
| ----------
| n_partitions : int
| Specify the number of partitions to split the input dataset
| into. Current implementation results in a number of partitions equal
| to the power of 2 greater than or equal to the chosen value.
|
| generate_global_id : bool, default: False
| Generate global cell ids if ``None`` are present in the input. If
| global cell ids are present in the input then this flag is
| ignored.
|
| This is stored as ``"vtkGlobalCellIds"`` within the ``cell_data``
| of the output dataset(s).
|
| as_composite : bool, default: False
| Return the partitioned dataset as a :class:`pyvista.MultiBlock`.
|
| Returns
| -------
| pyvista.MultiBlock or pyvista.UnstructuredGrid
| UnStructuredGrid if ``as_composite=False`` and MultiBlock when ``True``.
|
| Examples
| --------
| Partition a simple ImageData into a :class:`pyvista.MultiBlock`
| containing each partition.
|
| >>> import pyvista as pv
| >>> grid = pv.ImageData(dimensions=(5, 5, 5))
| >>> out = grid.partition(4, as_composite=True)
| >>> out.plot(multi_colors=True, show_edges=True)
|
| Partition of the Stanford bunny.
|
| >>> from pyvista import examples
| >>> mesh = examples.download_bunny()
| >>> out = mesh.partition(4, as_composite=True)
| >>> out.plot(multi_colors=True, cpos='xy')
|
| plot_over_circular_arc(self, pointa, pointb, center, resolution=None, scalars=None, title=None, ylabel=None, figsize=None, figure=True, show=True, tolerance=None, fname=None, progress_bar=False)
| Sample a dataset along a circular arc and plot it.
|
| Plot the variables of interest in 2D where the X-axis is
| distance from Point A and the Y-axis is the variable of
| interest. Note that this filter returns ``None``.
|
| Parameters
| ----------
| pointa : sequence[float]
| Location in ``[x, y, z]``.
|
| pointb : sequence[float]
| Location in ``[x, y, z]``.
|
| center : sequence[float]
| Location in ``[x, y, z]``.
|
| resolution : int, optional
| Number of pieces to divide the circular arc into. Defaults
| to number of cells in the input mesh. Must be a positive
| integer.
|
| scalars : str, optional
| The string name of the variable in the input dataset to
| probe. The active scalar is used by default.
|
| title : str, optional
| The string title of the ``matplotlib`` figure.
|
| ylabel : str, optional
| The string label of the Y-axis. Defaults to the variable name.
|
| figsize : tuple(int), optional
| The size of the new figure.
|
| figure : bool, default: True
| Flag on whether or not to create a new figure.
|
| show : bool, default: True
| Shows the ``matplotlib`` figure when ``True``.
|
| tolerance : float, optional
| Tolerance used to compute whether a point in the source is
| in a cell of the input. If not given, tolerance is
| automatically generated.
|
| fname : str, optional
| Save the figure this file name when set.
|
| progress_bar : bool, default: False
| Display a progress bar to indicate progress.
|
| Examples
| --------
| Sample a dataset along a high resolution circular arc and plot.
|
| >>> from pyvista import examples
| >>> mesh = examples.load_uniform()
| >>> a = [mesh.bounds[0], mesh.bounds[2], mesh.bounds[5]]
| >>> b = [mesh.bounds[1], mesh.bounds[2], mesh.bounds[4]]
| >>> center = [mesh.bounds[0], mesh.bounds[2], mesh.bounds[4]]
| >>> mesh.plot_over_circular_arc(
| ... a, b, center, resolution=1000, show=False
| ... ) # doctest:+SKIP
|
| plot_over_circular_arc_normal(self, center, resolution=None, normal=None, polar=None, angle=None, scalars=None, title=None, ylabel=None, figsize=None, figure=True, show=True, tolerance=None, fname=None, progress_bar=False)
| Sample a dataset along a resolution circular arc defined by a normal and polar vector and plot it.
|
| Plot the variables of interest in 2D where the X-axis is
| distance from Point A and the Y-axis is the variable of
| interest. Note that this filter returns ``None``.
|
| Parameters
| ----------
| center : sequence[int]
| Location in ``[x, y, z]``.
|
| resolution : int, optional
| Number of pieces to divide circular arc into. Defaults to
| number of cells in the input mesh. Must be a positive
| integer.
|
| normal : sequence[float], optional
| The normal vector to the plane of the arc. By default it
| points in the positive Z direction.
|
| polar : sequence[float], optional
| Starting point of the arc in polar coordinates. By
| default it is the unit vector in the positive x direction.
|
| angle : float, optional
| Arc length (in degrees), beginning at the polar vector. The
| direction is counterclockwise. By default it is 360.
|
| scalars : str, optional
| The string name of the variable in the input dataset to
| probe. The active scalar is used by default.
|
| title : str, optional
| The string title of the `matplotlib` figure.
|
| ylabel : str, optional
| The string label of the Y-axis. Defaults to variable name.
|
| figsize : tuple(int), optional
| The size of the new figure.
|
| figure : bool, optional
| Flag on whether or not to create a new figure.
|
| show : bool, default: True
| Shows the matplotlib figure.
|
| tolerance : float, optional
| Tolerance used to compute whether a point in the source is
| in a cell of the input. If not given, tolerance is
| automatically generated.
|
| fname : str, optional
| Save the figure this file name when set.
|
| progress_bar : bool, default: False
| Display a progress bar to indicate progress.
|
| Examples
| --------
| Sample a dataset along a high resolution circular arc and plot.
|
| >>> from pyvista import examples
| >>> mesh = examples.load_uniform()
| >>> normal = normal = [0, 0, 1]
| >>> polar = [0, 9, 0]
| >>> angle = 90
| >>> center = [mesh.bounds[0], mesh.bounds[2], mesh.bounds[4]]
| >>> mesh.plot_over_circular_arc_normal(
| ... center, polar=polar, angle=angle
| ... ) # doctest:+SKIP
|
| plot_over_line(self, pointa, pointb, resolution=None, scalars=None, title=None, ylabel=None, figsize=None, figure=True, show=True, tolerance=None, fname=None, progress_bar=False)
| Sample a dataset along a high resolution line and plot.
|
| Plot the variables of interest in 2D using matplotlib where the
| X-axis is distance from Point A and the Y-axis is the variable
| of interest. Note that this filter returns ``None``.
|
| Parameters
| ----------
| pointa : sequence[float]
| Location in ``[x, y, z]``.
|
| pointb : sequence[float]
| Location in ``[x, y, z]``.
|
| resolution : int, optional
| Number of pieces to divide line into. Defaults to number of cells
| in the input mesh. Must be a positive integer.
|
| scalars : str, optional
| The string name of the variable in the input dataset to probe. The
| active scalar is used by default.
|
| title : str, optional
| The string title of the matplotlib figure.
|
| ylabel : str, optional
| The string label of the Y-axis. Defaults to variable name.
|
| figsize : tuple(int), optional
| The size of the new figure.
|
| figure : bool, default: True
| Flag on whether or not to create a new figure.
|
| show : bool, default: True
| Shows the matplotlib figure.
|
| tolerance : float, optional
| Tolerance used to compute whether a point in the source is in a
| cell of the input. If not given, tolerance is automatically generated.
|
| fname : str, optional
| Save the figure this file name when set.
|
| progress_bar : bool, default: False
| Display a progress bar to indicate progress.
|
| Examples
| --------
| See the :ref:`plot_over_line_example` example.
|
| point_data_to_cell_data(self, pass_point_data=False, progress_bar=False)
| Transform point data into cell data.
|
| Point data are specified per node and cell data specified within cells.
| Optionally, the input point data can be passed through to the output.
|
| See also: :func:`pyvista.DataSetFilters.cell_data_to_point_data`
|
| Parameters
| ----------
| pass_point_data : bool, default: False
| If enabled, pass the input point data through to the output.
|
| progress_bar : bool, default: False
| Display a progress bar to indicate progress.
|
| Returns
| -------
| pyvista.DataSet
| Dataset with the point data transformed into cell data.
| Return type matches input.
|
| Examples
| --------
| Color cells by their z coordinates. First, create point
| scalars based on z-coordinates of a sample sphere mesh. Then
| convert this point data to cell data. Use a low resolution
| sphere for emphasis of cell valued data.
|
| First, plot these values as point values to show the
| difference between point and cell data.
|
| >>> import pyvista
| >>> sphere = pyvista.Sphere(theta_resolution=10, phi_resolution=10)
| >>> sphere['Z Coordinates'] = sphere.points[:, 2]
| >>> sphere.plot()
|
| Now, convert these values to cell data and then plot it.
|
| >>> import pyvista
| >>> sphere = pyvista.Sphere(theta_resolution=10, phi_resolution=10)
| >>> sphere['Z Coordinates'] = sphere.points[:, 2]
| >>> sphere = sphere.point_data_to_cell_data()
| >>> sphere.plot()
|
| probe(self, points, tolerance=None, pass_cell_data=True, pass_point_data=True, categorical=False, progress_bar=False, locator=None)
| Sample data values at specified point locations.
|
| .. deprecated:: 0.41.0
| `probe` will be removed in a future version. Use
| :func:`pyvista.DataSetFilters.sample` instead.
| If using `mesh1.probe(mesh2)`, use `mesh2.sample(mesh1)`.
|
| This uses :class:`vtkProbeFilter`.
|
| Parameters
| ----------
| points : pyvista.DataSet
| The points to probe values on to. This should be a PyVista mesh
| or something :func:`wrap` can handle.
|
| tolerance : float, optional
| Tolerance used to compute whether a point in the source is
| in a cell of the input. If not given, tolerance is
| automatically generated.
|
| pass_cell_data : bool, default: True
| Preserve source mesh's original cell data arrays.
|
| pass_point_data : bool, default: True
| Preserve source mesh's original point data arrays.
|
| categorical : bool, default: False
| Control whether the source point data is to be treated as
| categorical. If the data is categorical, then the resultant data
| will be determined by a nearest neighbor interpolation scheme.
|
| progress_bar : bool, default: False
| Display a progress bar to indicate progress.
|
| locator : vtkAbstractCellLocator, optional
| Prototype cell locator to perform the ``FindCell()``
| operation.
|
| Returns
| -------
| pyvista.DataSet
| Dataset containing the probed data.
|
| Examples
| --------
| Probe the active scalars in ``grid`` at the points in ``mesh``.
|
| >>> import pyvista as pv
| >>> from pyvista import examples
| >>> mesh = pv.Sphere(center=(4.5, 4.5, 4.5), radius=4.5)
| >>> grid = examples.load_uniform()
| >>> result = grid.probe(mesh) # doctest:+SKIP
| >>> 'Spatial Point Data' in result.point_data # doctest:+SKIP
| True
|
| ptc(self, pass_point_data=False, progress_bar=False, **kwargs)
| Transform point data into cell data.
|
| Point data are specified per node and cell data specified
| within cells. Optionally, the input point data can be passed
| through to the output.
|
| This method is an alias for
| :func:`pyvista.DataSetFilters.point_data_to_cell_data`.
|
| Parameters
| ----------
| pass_point_data : bool, default: False
| If enabled, pass the input point data through to the output.
|
| progress_bar : bool, default: False
| Display a progress bar to indicate progress.
|
| **kwargs : dict, optional
| Deprecated keyword argument ``pass_point_arrays``.
|
| Returns
| -------
| pyvista.DataSet
| Dataset with the point data transformed into cell data.
| Return type matches input.
|
| reflect(self, normal, point=None, inplace=False, transform_all_input_vectors=False, progress_bar=False)
| Reflect a dataset across a plane.
|
| Parameters
| ----------
| normal : array_like[float]
| Normal direction for reflection.
|
| point : array_like[float]
| Point which, along with ``normal``, defines the reflection
| plane. If not specified, this is the origin.
|
| inplace : bool, default: False
| When ``True``, modifies the dataset inplace.
|
| transform_all_input_vectors : bool, default: False
| When ``True``, all input vectors are transformed. Otherwise,
| only the points, normals and active vectors are transformed.
|
| progress_bar : bool, default: False
| Display a progress bar to indicate progress.
|
| Returns
| -------
| pyvista.DataSet
| Reflected dataset. Return type matches input.
|
| Examples
| --------
| >>> from pyvista import examples
| >>> mesh = examples.load_airplane()
| >>> mesh = mesh.reflect((0, 0, 1), point=(0, 0, -100))
| >>> mesh.plot(show_edges=True)
|
| See the :ref:`ref_reflect_example` for more examples using this filter.
|
| sample(self, target, tolerance=None, pass_cell_data=True, pass_point_data=True, categorical=False, progress_bar=False, locator=None, pass_field_data=True, mark_blank=True)
| Resample array data from a passed mesh onto this mesh.
|
| For `mesh1.sample(mesh2)`, the arrays from `mesh2` are sampled onto
| the points of `mesh1`. This function interpolates within an
| enclosing cell. This contrasts with
| :function`pyvista.DataSetFilters.interpolate` that uses a distance
| weighting for nearby points. If there is cell topology, `sample` is
| usually preferred.
|
| The point data 'vtkValidPointMask' stores whether the point could be sampled
| with a value of 1 meaning successful sampling. And a value of 0 means
| unsuccessful.
|
| This uses :class:`vtk.vtkResampleWithDataSet`.
|
| Parameters
| ----------
| target : pyvista.DataSet
| The vtk data object to sample from - point and cell arrays from
| this object are sampled onto the nodes of the ``dataset`` mesh.
|
| tolerance : float, optional
| Tolerance used to compute whether a point in the source is
| in a cell of the input. If not given, tolerance is
| automatically generated.
|
| pass_cell_data : bool, default: True
| Preserve source mesh's original cell data arrays.
|
| pass_point_data : bool, default: True
| Preserve source mesh's original point data arrays.
|
| categorical : bool, default: False
| Control whether the source point data is to be treated as
| categorical. If the data is categorical, then the resultant data
| will be determined by a nearest neighbor interpolation scheme.
|
| progress_bar : bool, default: False
| Display a progress bar to indicate progress.
|
| locator : vtkAbstractCellLocator or str, optional
| Prototype cell locator to perform the ``FindCell()``
| operation. Default uses the DataSet ``FindCell`` method.
| Valid strings with mapping to vtk cell locators are
|
| * 'cell' - vtkCellLocator
| * 'cell_tree' - vtkCellTreeLocator
| * 'obb_tree' - vtkOBBTree
| * 'static_cell' - vtkStaticCellLocator
|
| pass_field_data : bool, default: True
| Preserve source mesh's original field data arrays.
|
| mark_blank : bool, default: True
| Whether to mark blank points and cells in "vtkGhostType".
|
| Returns
| -------
| pyvista.DataSet
| Dataset containing resampled data.
|
| See Also
| --------
| pyvista.DataSetFilters.interpolate
|
| Examples
| --------
| Resample data from another dataset onto a sphere.
|
| >>> import pyvista as pv
| >>> from pyvista import examples
| >>> mesh = pv.Sphere(center=(4.5, 4.5, 4.5), radius=4.5)
| >>> data_to_probe = examples.load_uniform()
| >>> result = mesh.sample(data_to_probe)
| >>> result.plot(scalars="Spatial Point Data")
|
| If sampling from a set of points represented by a ``(n, 3)``
| shaped ``numpy.ndarray``, they need to be converted to a
| PyVista DataSet, e.g. :class:`pyvista.PolyData`, first.
|
| >>> import numpy as np
| >>> points = np.array([[1.5, 5.0, 6.2], [6.7, 4.2, 8.0]])
| >>> mesh = pv.PolyData(points)
| >>> result = mesh.sample(data_to_probe)
| >>> result["Spatial Point Data"]
| pyvista_ndarray([ 46.5 , 225.12])
|
| See :ref:`resampling_example` for more examples using this filter.
|
| sample_over_circular_arc(self, pointa, pointb, center, resolution=None, tolerance=None, progress_bar=False)
| Sample a dataset over a circular arc.
|
| Parameters
| ----------
| pointa : sequence[float]
| Location in ``[x, y, z]``.
|
| pointb : sequence[float]
| Location in ``[x, y, z]``.
|
| center : sequence[float]
| Location in ``[x, y, z]``.
|
| resolution : int, optional
| Number of pieces to divide circular arc into. Defaults to
| number of cells in the input mesh. Must be a positive
| integer.
|
| tolerance : float, optional
| Tolerance used to compute whether a point in the source is
| in a cell of the input. If not given, tolerance is
| automatically generated.
|
| progress_bar : bool, default: False
| Display a progress bar to indicate progress.
|
| Returns
| -------
| pyvista.PolyData
| Arc containing the sampled data.
|
| Examples
| --------
| Sample a dataset over a circular arc and plot it.
|
| >>> import pyvista
| >>> from pyvista import examples
| >>> uniform = examples.load_uniform()
| >>> uniform["height"] = uniform.points[:, 2]
| >>> pointa = [
| ... uniform.bounds[1],
| ... uniform.bounds[2],
| ... uniform.bounds[5],
| ... ]
| >>> pointb = [
| ... uniform.bounds[1],
| ... uniform.bounds[3],
| ... uniform.bounds[4],
| ... ]
| >>> center = [
| ... uniform.bounds[1],
| ... uniform.bounds[2],
| ... uniform.bounds[4],
| ... ]
| >>> sampled_arc = uniform.sample_over_circular_arc(
| ... pointa, pointb, center
| ... )
| >>> pl = pyvista.Plotter()
| >>> _ = pl.add_mesh(uniform, style='wireframe')
| >>> _ = pl.add_mesh(sampled_arc, line_width=10)
| >>> pl.show_axes()
| >>> pl.show()
|
| sample_over_circular_arc_normal(self, center, resolution=None, normal=None, polar=None, angle=None, tolerance=None, progress_bar=False)
| Sample a dataset over a circular arc defined by a normal and polar vector and plot it.
|
| The number of segments composing the polyline is controlled by
| setting the object resolution.
|
| Parameters
| ----------
| center : sequence[float]
| Location in ``[x, y, z]``.
|
| resolution : int, optional
| Number of pieces to divide circular arc into. Defaults to
| number of cells in the input mesh. Must be a positive
| integer.
|
| normal : sequence[float], optional
| The normal vector to the plane of the arc. By default it
| points in the positive Z direction.
|
| polar : sequence[float], optional
| Starting point of the arc in polar coordinates. By
| default it is the unit vector in the positive x direction.
|
| angle : float, optional
| Arc length (in degrees), beginning at the polar vector. The
| direction is counterclockwise. By default it is 360.
|
| tolerance : float, optional
| Tolerance used to compute whether a point in the source is
| in a cell of the input. If not given, tolerance is
| automatically generated.
|
| progress_bar : bool, default: False
| Display a progress bar to indicate progress.
|
| Returns
| -------
| pyvista.PolyData
| Sampled Dataset.
|
| Examples
| --------
| Sample a dataset over a circular arc.
|
| >>> import pyvista
| >>> from pyvista import examples
| >>> uniform = examples.load_uniform()
| >>> uniform["height"] = uniform.points[:, 2]
| >>> normal = [0, 0, 1]
| >>> polar = [0, 9, 0]
| >>> center = [
| ... uniform.bounds[1],
| ... uniform.bounds[2],
| ... uniform.bounds[5],
| ... ]
| >>> arc = uniform.sample_over_circular_arc_normal(
| ... center, normal=normal, polar=polar
| ... )
| >>> pl = pyvista.Plotter()
| >>> _ = pl.add_mesh(uniform, style='wireframe')
| >>> _ = pl.add_mesh(arc, line_width=10)
| >>> pl.show_axes()
| >>> pl.show()
|
| sample_over_line(self, pointa, pointb, resolution=None, tolerance=None, progress_bar=False)
| Sample a dataset onto a line.
|
| Parameters
| ----------
| pointa : sequence[float]
| Location in ``[x, y, z]``.
|
| pointb : sequence[float]
| Location in ``[x, y, z]``.
|
| resolution : int, optional
| Number of pieces to divide line into. Defaults to number of cells
| in the input mesh. Must be a positive integer.
|
| tolerance : float, optional
| Tolerance used to compute whether a point in the source is in a
| cell of the input. If not given, tolerance is automatically generated.
|
| progress_bar : bool, default: False
| Display a progress bar to indicate progress.
|
| Returns
| -------
| pyvista.PolyData
| Line object with sampled data from dataset.
|
| Examples
| --------
| Sample over a plane that is interpolating a point cloud.
|
| >>> import pyvista
| >>> import numpy as np
| >>> np.random.seed(12)
| >>> point_cloud = np.random.random((5, 3))
| >>> point_cloud[:, 2] = 0
| >>> point_cloud -= point_cloud.mean(0)
| >>> pdata = pyvista.PolyData(point_cloud)
| >>> pdata['values'] = np.random.random(5)
| >>> plane = pyvista.Plane()
| >>> plane.clear_data()
| >>> plane = plane.interpolate(pdata, sharpness=3.5)
| >>> sample = plane.sample_over_line((-0.5, -0.5, 0), (0.5, 0.5, 0))
| >>> pl = pyvista.Plotter()
| >>> _ = pl.add_mesh(
| ... pdata, render_points_as_spheres=True, point_size=50
| ... )
| >>> _ = pl.add_mesh(sample, scalars='values', line_width=10)
| >>> _ = pl.add_mesh(plane, scalars='values', style='wireframe')
| >>> pl.show()
|
| sample_over_multiple_lines(self, points, tolerance=None, progress_bar=False)
| Sample a dataset onto a multiple lines.
|
| Parameters
| ----------
| points : array_like[float]
| List of points defining multiple lines.
|
| tolerance : float, optional
| Tolerance used to compute whether a point in the source is in a
| cell of the input. If not given, tolerance is automatically generated.
|
| progress_bar : bool, default: False
| Display a progress bar to indicate progress.
|
| Returns
| -------
| pyvista.PolyData
| Line object with sampled data from dataset.
|
| Examples
| --------
| Sample over a plane that is interpolating a point cloud.
|
| >>> import pyvista
| >>> import numpy as np
| >>> np.random.seed(12)
| >>> point_cloud = np.random.random((5, 3))
| >>> point_cloud[:, 2] = 0
| >>> point_cloud -= point_cloud.mean(0)
| >>> pdata = pyvista.PolyData(point_cloud)
| >>> pdata['values'] = np.random.random(5)
| >>> plane = pyvista.Plane()
| >>> plane.clear_data()
| >>> plane = plane.interpolate(pdata, sharpness=3.5)
| >>> sample = plane.sample_over_multiple_lines(
| ... [[-0.5, -0.5, 0], [0.5, -0.5, 0], [0.5, 0.5, 0]]
| ... )
| >>> pl = pyvista.Plotter()
| >>> _ = pl.add_mesh(
| ... pdata, render_points_as_spheres=True, point_size=50
| ... )
| >>> _ = pl.add_mesh(sample, scalars='values', line_width=10)
| >>> _ = pl.add_mesh(plane, scalars='values', style='wireframe')
| >>> pl.show()
|
| select_enclosed_points(self, surface, tolerance=0.001, inside_out=False, check_surface=True, progress_bar=False)
| Mark points as to whether they are inside a closed surface.
|
| This evaluates all the input points to determine whether they are in an
| enclosed surface. The filter produces a (0,1) mask
| (in the form of a vtkDataArray) that indicates whether points are
| outside (mask value=0) or inside (mask value=1) a provided surface.
| (The name of the output vtkDataArray is ``"SelectedPoints"``.)
|
| This filter produces and output data array, but does not modify the
| input dataset. If you wish to extract cells or poinrs, various
| threshold filters are available (i.e., threshold the output array).
|
| .. warning::
| The filter assumes that the surface is closed and
| manifold. A boolean flag can be set to force the filter to
| first check whether this is true. If ``False`` and not manifold,
| an error will be raised.
|
| Parameters
| ----------
| surface : pyvista.PolyData
| Set the surface to be used to test for containment. This must be a
| :class:`pyvista.PolyData` object.
|
| tolerance : float, default: 0.001
| The tolerance on the intersection. The tolerance is expressed as a
| fraction of the bounding box of the enclosing surface.
|
| inside_out : bool, default: False
| By default, points inside the surface are marked inside or sent
| to the output. If ``inside_out`` is ``True``, then the points
| outside the surface are marked inside.
|
| check_surface : bool, default: True
| Specify whether to check the surface for closure. When ``True``, the
| algorithm first checks to see if the surface is closed and
| manifold. If the surface is not closed and manifold, a runtime
| error is raised.
|
| progress_bar : bool, default: False
| Display a progress bar to indicate progress.
|
| Returns
| -------
| pyvista.PolyData
| Mesh containing the ``point_data['SelectedPoints']`` array.
|
| Examples
| --------
| Determine which points on a plane are inside a manifold sphere
| surface mesh. Extract these points using the
| :func:`DataSetFilters.extract_points` filter and then plot them.
|
| >>> import pyvista
| >>> sphere = pyvista.Sphere()
| >>> plane = pyvista.Plane()
| >>> selected = plane.select_enclosed_points(sphere)
| >>> pts = plane.extract_points(
| ... selected['SelectedPoints'].view(bool),
| ... adjacent_cells=False,
| ... )
| >>> pl = pyvista.Plotter()
| >>> _ = pl.add_mesh(sphere, style='wireframe')
| >>> _ = pl.add_points(pts, color='r')
| >>> pl.show()
|
| separate_cells(self)
| Return a copy of the dataset with separated cells with no shared points.
|
| This method may be useful when datasets have scalars that need to be
| associated to each point of each cell rather than either each cell or
| just the points of the dataset.
|
| Returns
| -------
| pyvista.UnstructuredGrid
| UnstructuredGrid with isolated cells.
|
| Examples
| --------
| Load the example hex beam and separate its cells. This increases the
| total number of points in the dataset since points are no longer
| shared.
|
| >>> from pyvista import examples
| >>> grid = examples.load_hexbeam()
| >>> grid.n_points
| 99
| >>> sep_grid = grid.separate_cells()
| >>> sep_grid.n_points
| 320
|
| See the :ref:`point_cell_scalars_example` for a more detailed example
| using this filter.
|
| shrink(self, shrink_factor=1.0, progress_bar=False)
| Shrink the individual faces of a mesh.
|
| This filter shrinks the individual faces of a mesh rather than
| scaling the entire mesh.
|
| Parameters
| ----------
| shrink_factor : float, default: 1.0
| Fraction of shrink for each cell. Default does not modify the
| faces.
|
| progress_bar : bool, default: False
| Display a progress bar to indicate progress.
|
| Returns
| -------
| pyvista.DataSet
| Dataset with shrunk faces. Return type matches input.
|
| Examples
| --------
| First, plot the original cube.
|
| >>> import pyvista
| >>> mesh = pyvista.Cube()
| >>> mesh.plot(show_edges=True, line_width=5)
|
| Now, plot the mesh with shrunk faces.
|
| >>> shrunk = mesh.shrink(0.5)
| >>> shrunk.clear_data() # cleans up plot
| >>> shrunk.plot(show_edges=True, line_width=5)
|
| slice(self, normal='x', origin=None, generate_triangles=False, contour=False, progress_bar=False)
| Slice a dataset by a plane at the specified origin and normal vector orientation.
|
| If no origin is specified, the center of the input dataset will be used.
|
| Parameters
| ----------
| normal : sequence[float] | str, default: 'x'
| Length 3 tuple for the normal vector direction. Can also be
| specified as a string conventional direction such as ``'x'`` for
| ``(1, 0, 0)`` or ``'-x'`` for ``(-1, 0, 0)``, etc.
|
| origin : sequence[float], optional
| The center ``(x, y, z)`` coordinate of the plane on which
| the slice occurs.
|
| generate_triangles : bool, default: False
| If this is enabled (``False`` by default), the output will
| be triangles. Otherwise the output will be the intersection
| polygons.
|
| contour : bool, default: False
| If ``True``, apply a ``contour`` filter after slicing.
|
| progress_bar : bool, default: False
| Display a progress bar to indicate progress.
|
| Returns
| -------
| pyvista.PolyData
| Sliced dataset.
|
| Examples
| --------
| Slice the surface of a sphere.
|
| >>> import pyvista
| >>> sphere = pyvista.Sphere()
| >>> slice_x = sphere.slice(normal='x')
| >>> slice_y = sphere.slice(normal='y')
| >>> slice_z = sphere.slice(normal='z')
| >>> slices = slice_x + slice_y + slice_z
| >>> slices.plot(line_width=5)
|
| See :ref:`slice_example` for more examples using this filter.
|
| slice_along_axis(self, n=5, axis='x', tolerance=None, generate_triangles=False, contour=False, bounds=None, center=None, progress_bar=False)
| Create many slices of the input dataset along a specified axis.
|
| Parameters
| ----------
| n : int, default: 5
| The number of slices to create.
|
| axis : str | int, default: 'x'
| The axis to generate the slices along. Perpendicular to the
| slices. Can be string name (``'x'``, ``'y'``, or ``'z'``) or
| axis index (``0``, ``1``, or ``2``).
|
| tolerance : float, optional
| The tolerance to the edge of the dataset bounds to create
| the slices. The ``n`` slices are placed equidistantly with
| an absolute padding of ``tolerance`` inside each side of the
| ``bounds`` along the specified axis. Defaults to 1% of the
| ``bounds`` along the specified axis.
|
| generate_triangles : bool, default: False
| When ``True``, the output will be triangles. Otherwise the output
| will be the intersection polygons.
|
| contour : bool, default: False
| If ``True``, apply a ``contour`` filter after slicing.
|
| bounds : sequence[float], optional
| A 6-length sequence overriding the bounds of the mesh.
| The bounds along the specified axis define the extent
| where slices are taken.
|
| center : sequence[float], optional
| A 3-length sequence specifying the position of the line
| along which slices are taken. Defaults to the center of
| the mesh.
|
| progress_bar : bool, default: False
| Display a progress bar to indicate progress.
|
| Returns
| -------
| pyvista.PolyData
| Sliced dataset.
|
| Examples
| --------
| Slice the random hills dataset in the X direction.
|
| >>> from pyvista import examples
| >>> hills = examples.load_random_hills()
| >>> slices = hills.slice_along_axis(n=10)
| >>> slices.plot(line_width=5)
|
| Slice the random hills dataset in the Z direction.
|
| >>> from pyvista import examples
| >>> hills = examples.load_random_hills()
| >>> slices = hills.slice_along_axis(n=10, axis='z')
| >>> slices.plot(line_width=5)
|
| See :ref:`slice_example` for more examples using this filter.
|
| slice_along_line(self, line, generate_triangles=False, contour=False, progress_bar=False)
| Slice a dataset using a polyline/spline as the path.
|
| This also works for lines generated with :func:`pyvista.Line`.
|
| Parameters
| ----------
| line : pyvista.PolyData
| A PolyData object containing one single PolyLine cell.
|
| generate_triangles : bool, default: False
| When ``True``, the output will be triangles. Otherwise the output
| will be the intersection polygons.
|
| contour : bool, default: False
| If ``True``, apply a ``contour`` filter after slicing.
|
| progress_bar : bool, default: False
| Display a progress bar to indicate progress.
|
| Returns
| -------
| pyvista.PolyData
| Sliced dataset.
|
| Examples
| --------
| Slice the random hills dataset along a circular arc.
|
| >>> import numpy as np
| >>> import pyvista
| >>> from pyvista import examples
| >>> hills = examples.load_random_hills()
| >>> center = np.array(hills.center)
| >>> point_a = center + np.array([5, 0, 0])
| >>> point_b = center + np.array([-5, 0, 0])
| >>> arc = pyvista.CircularArc(
| ... point_a, point_b, center, resolution=100
| ... )
| >>> line_slice = hills.slice_along_line(arc)
|
| Plot the circular arc and the hills mesh.
|
| >>> pl = pyvista.Plotter()
| >>> _ = pl.add_mesh(hills, smooth_shading=True, style='wireframe')
| >>> _ = pl.add_mesh(
| ... line_slice,
| ... line_width=10,
| ... render_lines_as_tubes=True,
| ... color='k',
| ... )
| >>> _ = pl.add_mesh(arc, line_width=10, color='grey')
| >>> pl.show()
|
| See :ref:`slice_example` for more examples using this filter.
|
| slice_implicit(self, implicit_function, generate_triangles=False, contour=False, progress_bar=False)
| Slice a dataset by a VTK implicit function.
|
| Parameters
| ----------
| implicit_function : vtk.vtkImplicitFunction
| Specify the implicit function to perform the cutting.
|
| generate_triangles : bool, default: False
| If this is enabled (``False`` by default), the output will
| be triangles. Otherwise the output will be the intersection
| polygons. If the cutting function is not a plane, the
| output will be 3D polygons, which might be nice to look at
| but hard to compute with downstream.
|
| contour : bool, default: False
| If ``True``, apply a ``contour`` filter after slicing.
|
| progress_bar : bool, default: False
| Display a progress bar to indicate progress.
|
| Returns
| -------
| pyvista.PolyData
| Sliced dataset.
|
| Examples
| --------
| Slice the surface of a sphere.
|
| >>> import pyvista as pv
| >>> import vtk
| >>> sphere = vtk.vtkSphere()
| >>> sphere.SetRadius(10)
| >>> mesh = pv.Wavelet()
| >>> slice = mesh.slice_implicit(sphere)
| >>> slice.plot(show_edges=True, line_width=5)
|
| >>> sphere = vtk.vtkCylinder()
| >>> sphere.SetRadius(10)
| >>> mesh = pv.Wavelet()
| >>> slice = mesh.slice_implicit(sphere)
| >>> slice.plot(show_edges=True, line_width=5)
|
| slice_orthogonal(self, x=None, y=None, z=None, generate_triangles=False, contour=False, progress_bar=False)
| Create three orthogonal slices through the dataset on the three cartesian planes.
|
| Yields a MutliBlock dataset of the three slices.
|
| Parameters
| ----------
| x : float, optional
| The X location of the YZ slice.
|
| y : float, optional
| The Y location of the XZ slice.
|
| z : float, optional
| The Z location of the XY slice.
|
| generate_triangles : bool, default: False
| When ``True``, the output will be triangles. Otherwise the output
| will be the intersection polygons.
|
| contour : bool, default: False
| If ``True``, apply a ``contour`` filter after slicing.
|
| progress_bar : bool, default: False
| Display a progress bar to indicate progress.
|
| Returns
| -------
| pyvista.PolyData
| Sliced dataset.
|
| Examples
| --------
| Slice the random hills dataset with three orthogonal planes.
|
| >>> from pyvista import examples
| >>> hills = examples.load_random_hills()
| >>> slices = hills.slice_orthogonal(contour=False)
| >>> slices.plot(line_width=5)
|
| See :ref:`slice_example` for more examples using this filter.
|
| split_bodies(self, label=False, progress_bar=False)
| Find, label, and split connected bodies/volumes.
|
| This splits different connected bodies into blocks in a
| :class:`pyvista.MultiBlock` dataset.
|
| Parameters
| ----------
| label : bool, default: False
| A flag on whether to keep the ID arrays given by the
| ``connectivity`` filter.
|
| progress_bar : bool, default: False
| Display a progress bar to indicate progress.
|
| Returns
| -------
| pyvista.MultiBlock
| MultiBlock with a split bodies.
|
| Examples
| --------
| Split a uniform grid thresholded to be non-connected.
|
| >>> from pyvista import examples
| >>> dataset = examples.load_uniform()
| >>> _ = dataset.set_active_scalars('Spatial Cell Data')
| >>> threshed = dataset.threshold_percent([0.15, 0.50], invert=True)
| >>> bodies = threshed.split_bodies()
| >>> len(bodies)
| 2
|
| See :ref:`split_vol_ref` for more examples using this filter.
|
| streamlines(self, vectors=None, source_center=None, source_radius=None, n_points=100, start_position=None, return_source=False, pointa=None, pointb=None, progress_bar=False, **kwargs)
| Integrate a vector field to generate streamlines.
|
| The default behavior uses a sphere as the source - set its
| location and radius via the ``source_center`` and
| ``source_radius`` keyword arguments. ``n_points`` defines the
| number of starting points on the sphere surface.
| Alternatively, a line source can be used by specifying
| ``pointa`` and ``pointb``. ``n_points`` again defines the
| number of points on the line.
|
| You can retrieve the source by specifying
| ``return_source=True``.
|
| Optional keyword parameters from
| :func:`pyvista.DataSetFilters.streamlines_from_source` can be
| used here to control the generation of streamlines.
|
| Parameters
| ----------
| vectors : str, optional
| The string name of the active vector field to integrate across.
|
| source_center : sequence[float], optional
| Length 3 tuple of floats defining the center of the source
| particles. Defaults to the center of the dataset.
|
| source_radius : float, optional
| Float radius of the source particle cloud. Defaults to one-tenth of
| the diagonal of the dataset's spatial extent.
|
| n_points : int, default: 100
| Number of particles present in source sphere or line.
|
| start_position : sequence[float], optional
| A single point. This will override the sphere point source.
|
| return_source : bool, default: False
| Return the source particles as :class:`pyvista.PolyData` as well as the
| streamlines. This will be the second value returned if ``True``.
|
| pointa, pointb : sequence[float], optional
| The coordinates of a start and end point for a line source. This
| will override the sphere and start_position point source.
|
| progress_bar : bool, default: False
| Display a progress bar to indicate progress.
|
| **kwargs : dict, optional
| See :func:`pyvista.DataSetFilters.streamlines_from_source`.
|
| Returns
| -------
| streamlines : pyvista.PolyData
| This produces polylines as the output, with each cell
| (i.e., polyline) representing a streamline. The attribute values
| associated with each streamline are stored in the cell data, whereas
| those associated with streamline-points are stored in the point data.
|
| source : pyvista.PolyData
| The points of the source are the seed points for the streamlines.
| Only returned if ``return_source=True``.
|
| Examples
| --------
| See the :ref:`streamlines_example` example.
|
| streamlines_evenly_spaced_2D(self, vectors=None, start_position=None, integrator_type=2, step_length=0.5, step_unit='cl', max_steps=2000, terminal_speed=1e-12, interpolator_type='point', separating_distance=10, separating_distance_ratio=0.5, closed_loop_maximum_distance=0.5, loop_angle=20, minimum_number_of_loop_points=4, compute_vorticity=True, progress_bar=False)
| Generate evenly spaced streamlines on a 2D dataset.
|
| This filter only supports datasets that lie on the xy plane, i.e. ``z=0``.
| Particular care must be used to choose a `separating_distance`
| that do not result in too much memory being utilized. The
| default unit is cell length.
|
| Parameters
| ----------
| vectors : str, optional
| The string name of the active vector field to integrate across.
|
| start_position : sequence[float], optional
| The seed point for generating evenly spaced streamlines.
| If not supplied, a random position in the dataset is chosen.
|
| integrator_type : {2, 4}, default: 2
| The integrator type to be used for streamline generation.
| The default is Runge-Kutta2. The recognized solvers are:
| RUNGE_KUTTA2 (``2``) and RUNGE_KUTTA4 (``4``).
|
| step_length : float, default: 0.5
| Constant Step size used for line integration, expressed in length
| units or cell length units (see ``step_unit`` parameter).
|
| step_unit : {'cl', 'l'}, default: "cl"
| Uniform integration step unit. The valid unit is now limited to
| only LENGTH_UNIT (``'l'``) and CELL_LENGTH_UNIT (``'cl'``).
| Default is CELL_LENGTH_UNIT.
|
| max_steps : int, default: 2000
| Maximum number of steps for integrating a streamline.
|
| terminal_speed : float, default: 1e-12
| Terminal speed value, below which integration is terminated.
|
| interpolator_type : str, optional
| Set the type of the velocity field interpolator to locate cells
| during streamline integration either by points or cells.
| The cell locator is more robust then the point locator. Options
| are ``'point'`` or ``'cell'`` (abbreviations of ``'p'`` and ``'c'``
| are also supported).
|
| separating_distance : float, default: 10
| The distance between streamlines expressed in ``step_unit``.
|
| separating_distance_ratio : float, default: 0.5
| Streamline integration is stopped if streamlines are closer than
| ``SeparatingDistance*SeparatingDistanceRatio`` to other streamlines.
|
| closed_loop_maximum_distance : float, default: 0.5
| The distance between points on a streamline to determine a
| closed loop.
|
| loop_angle : float, default: 20
| The maximum angle in degrees between points to determine a closed loop.
|
| minimum_number_of_loop_points : int, default: 4
| The minimum number of points before which a closed loop will
| be determined.
|
| compute_vorticity : bool, default: True
| Vorticity computation at streamline points. Necessary for generating
| proper stream-ribbons using the ``vtkRibbonFilter``.
|
| progress_bar : bool, default: False
| Display a progress bar to indicate progress.
|
| Returns
| -------
| pyvista.PolyData
| This produces polylines as the output, with each cell
| (i.e., polyline) representing a streamline. The attribute
| values associated with each streamline are stored in the
| cell data, whereas those associated with streamline-points
| are stored in the point data.
|
| Examples
| --------
| Plot evenly spaced streamlines for cylinder in a crossflow.
| This dataset is a multiblock dataset, and the fluid velocity is in the
| first block.
|
| >>> import pyvista
| >>> from pyvista import examples
| >>> mesh = examples.download_cylinder_crossflow()
| >>> streams = mesh[0].streamlines_evenly_spaced_2D(
| ... start_position=(4, 0.1, 0.0),
| ... separating_distance=3,
| ... separating_distance_ratio=0.2,
| ... )
| >>> plotter = pyvista.Plotter()
| >>> _ = plotter.add_mesh(
| ... streams.tube(radius=0.02), scalars="vorticity_mag"
| ... )
| >>> plotter.view_xy()
| >>> plotter.show()
|
| See :ref:`2d_streamlines_example` for more examples using this filter.
|
| streamlines_from_source(self, source, vectors=None, integrator_type=45, integration_direction='both', surface_streamlines=False, initial_step_length=0.5, step_unit='cl', min_step_length=0.01, max_step_length=1.0, max_steps=2000, terminal_speed=1e-12, max_error=1e-06, max_time=None, compute_vorticity=True, rotation_scale=1.0, interpolator_type='point', progress_bar=False)
| Generate streamlines of vectors from the points of a source mesh.
|
| The integration is performed using a specified integrator, by default
| Runge-Kutta2. This supports integration through any type of dataset.
| If the dataset contains 2D cells like polygons or triangles and the
| ``surface_streamlines`` parameter is used, the integration is constrained
| to lie on the surface defined by 2D cells.
|
| Parameters
| ----------
| source : pyvista.DataSet
| The points of the source provide the starting points of the
| streamlines. This will override both sphere and line sources.
|
| vectors : str, optional
| The string name of the active vector field to integrate across.
|
| integrator_type : {45, 2, 4}, default: 45
| The integrator type to be used for streamline generation.
| The default is Runge-Kutta45. The recognized solvers are:
| RUNGE_KUTTA2 (``2``), RUNGE_KUTTA4 (``4``), and RUNGE_KUTTA45
| (``45``). Options are ``2``, ``4``, or ``45``.
|
| integration_direction : str, default: "both"
| Specify whether the streamline is integrated in the upstream or
| downstream directions (or both). Options are ``'both'``,
| ``'backward'``, or ``'forward'``.
|
| surface_streamlines : bool, default: False
| Compute streamlines on a surface.
|
| initial_step_length : float, default: 0.5
| Initial step size used for line integration, expressed ib length
| unitsL or cell length units (see ``step_unit`` parameter).
| either the starting size for an adaptive integrator, e.g., RK45, or
| the constant / fixed size for non-adaptive ones, i.e., RK2 and RK4).
|
| step_unit : {'cl', 'l'}, default: "cl"
| Uniform integration step unit. The valid unit is now limited to
| only LENGTH_UNIT (``'l'``) and CELL_LENGTH_UNIT (``'cl'``).
| Default is CELL_LENGTH_UNIT.
|
| min_step_length : float, default: 0.01
| Minimum step size used for line integration, expressed in length or
| cell length units. Only valid for an adaptive integrator, e.g., RK45.
|
| max_step_length : float, default: 1.0
| Maximum step size used for line integration, expressed in length or
| cell length units. Only valid for an adaptive integrator, e.g., RK45.
|
| max_steps : int, default: 2000
| Maximum number of steps for integrating a streamline.
|
| terminal_speed : float, default: 1e-12
| Terminal speed value, below which integration is terminated.
|
| max_error : float, 1e-6
| Maximum error tolerated throughout streamline integration.
|
| max_time : float, optional
| Specify the maximum length of a streamline expressed in LENGTH_UNIT.
|
| compute_vorticity : bool, default: True
| Vorticity computation at streamline points. Necessary for generating
| proper stream-ribbons using the ``vtkRibbonFilter``.
|
| rotation_scale : float, default: 1.0
| This can be used to scale the rate with which the streamribbons
| twist.
|
| interpolator_type : str, default: "point"
| Set the type of the velocity field interpolator to locate cells
| during streamline integration either by points or cells.
| The cell locator is more robust then the point locator. Options
| are ``'point'`` or ``'cell'`` (abbreviations of ``'p'`` and ``'c'``
| are also supported).
|
| progress_bar : bool, default: False
| Display a progress bar to indicate progress.
|
| Returns
| -------
| pyvista.PolyData
| Streamlines. This produces polylines as the output, with
| each cell (i.e., polyline) representing a streamline. The
| attribute values associated with each streamline are
| stored in the cell data, whereas those associated with
| streamline-points are stored in the point data.
|
| Examples
| --------
| See the :ref:`streamlines_example` example.
|
| surface_indices(self, progress_bar=False)
| Return the surface indices of a grid.
|
| Parameters
| ----------
| progress_bar : bool, default: False
| Display a progress bar to indicate progress.
|
| Returns
| -------
| numpy.ndarray
| Indices of the surface points.
|
| Examples
| --------
| Return the first 10 surface indices of an UnstructuredGrid.
|
| >>> from pyvista import examples
| >>> grid = examples.load_hexbeam()
| >>> ind = grid.surface_indices()
| >>> ind[:10] # doctest:+SKIP
| pyvista_ndarray([ 0, 2, 36, 27, 7, 8, 81, 1, 18, 4])
|
| tessellate(self, max_n_subdivide=3, merge_points=True, progress_bar=False)
| Tessellate a mesh.
|
| This filter approximates nonlinear FEM-like elements with linear
| simplices. The output mesh will have geometry and any fields specified
| as attributes in the input mesh's point data. The attribute's copy
| flags are honored, except for normals.
|
| For more details see `vtkTessellatorFilter <https://vtk.org/doc/nightly/html/classvtkTessellatorFilter.html#details>`_.
|
| Parameters
| ----------
| max_n_subdivide : int, default: 3
| Maximum number of subdivisions.
|
| merge_points : bool, default: True
| The adaptive tessellation will output vertices that are not shared among cells,
| even where they should be. This can be corrected to some extent.
|
| progress_bar : bool, default: False
| Display a progress bar to indicate progress.
|
| Returns
| -------
| pyvista.DataSet
| Dataset with tessellated mesh. Return type matches input.
|
| Examples
| --------
| First, plot the high order FEM-like elements.
|
| >>> import pyvista
| >>> import numpy as np
| >>> points = np.array(
| ... [
| ... [0.0, 0.0, 0.0],
| ... [2.0, 0.0, 0.0],
| ... [1.0, 2.0, 0.0],
| ... [1.0, 0.5, 0.0],
| ... [1.5, 1.5, 0.0],
| ... [0.5, 1.5, 0.0],
| ... ]
| ... )
| >>> cells = np.array([6, 0, 1, 2, 3, 4, 5])
| >>> cell_types = np.array([69])
| >>> mesh = pyvista.UnstructuredGrid(cells, cell_types, points)
| >>> mesh.plot(show_edges=True, line_width=5)
|
| Now, plot the tessellated mesh.
|
| >>> tessellated = mesh.tessellate()
| >>> tessellated.clear_data() # cleans up plot
| >>> tessellated.plot(show_edges=True, line_width=5)
|
| texture_map_to_plane(self, origin=None, point_u=None, point_v=None, inplace=False, name='Texture Coordinates', use_bounds=False, progress_bar=False)
| Texture map this dataset to a user defined plane.
|
| This is often used to define a plane to texture map an image
| to this dataset. The plane defines the spatial reference and
| extent of that image.
|
| Parameters
| ----------
| origin : sequence[float], optional
| Length 3 iterable of floats defining the XYZ coordinates of the
| bottom left corner of the plane.
|
| point_u : sequence[float], optional
| Length 3 iterable of floats defining the XYZ coordinates of the
| bottom right corner of the plane.
|
| point_v : sequence[float], optional
| Length 3 iterable of floats defining the XYZ coordinates of the
| top left corner of the plane.
|
| inplace : bool, default: False
| If ``True``, the new texture coordinates will be added to this
| dataset. If ``False``, a new dataset is returned with the texture
| coordinates.
|
| name : str, default: "Texture Coordinates"
| The string name to give the new texture coordinates if applying
| the filter inplace.
|
| use_bounds : bool, default: False
| Use the bounds to set the mapping plane by default (bottom plane
| of the bounding box).
|
| progress_bar : bool, default: False
| Display a progress bar to indicate progress.
|
| Returns
| -------
| pyvista.DataSet
| Original dataset with texture coordinates if
| ``inplace=True``, otherwise a copied dataset.
|
| Examples
| --------
| See :ref:`ref_topo_map_example`
|
| texture_map_to_sphere(self, center=None, prevent_seam=True, inplace=False, name='Texture Coordinates', progress_bar=False)
| Texture map this dataset to a user defined sphere.
|
| This is often used to define a sphere to texture map an image
| to this dataset. The sphere defines the spatial reference and
| extent of that image.
|
| Parameters
| ----------
| center : sequence[float], optional
| Length 3 iterable of floats defining the XYZ coordinates of the
| center of the sphere. If ``None``, this will be automatically
| calculated.
|
| prevent_seam : bool, default: True
| Control how the texture coordinates are generated. If
| set, the s-coordinate ranges from 0 to 1 and 1 to 0
| corresponding to the theta angle variation between 0 to
| 180 and 180 to 0 degrees. Otherwise, the s-coordinate
| ranges from 0 to 1 between 0 to 360 degrees.
|
| inplace : bool, default: False
| If ``True``, the new texture coordinates will be added to
| the dataset inplace. If ``False`` (default), a new dataset
| is returned with the texture coordinates.
|
| name : str, default: "Texture Coordinates"
| The string name to give the new texture coordinates if applying
| the filter inplace.
|
| progress_bar : bool, default: False
| Display a progress bar to indicate progress.
|
| Returns
| -------
| pyvista.DataSet
| Dataset containing the texture mapped to a sphere. Return
| type matches input.
|
| Examples
| --------
| See :ref:`ref_texture_example`.
|
| threshold(self, value=None, scalars=None, invert=False, continuous=False, preference='cell', all_scalars=False, component_mode='all', component=0, method='upper', progress_bar=False)
| Apply a ``vtkThreshold`` filter to the input dataset.
|
| This filter will apply a ``vtkThreshold`` filter to the input
| dataset and return the resulting object. This extracts cells
| where the scalar value in each cell satisfies the threshold
| criterion. If ``scalars`` is ``None``, the input's active
| scalars array is used.
|
| .. warning::
| Thresholding is inherently a cell operation, even though it can use
| associated point data for determining whether to keep a cell. In
| other words, whether or not a given point is included after
| thresholding depends on whether that point is part of a cell that
| is kept after thresholding.
|
| Please also note the default ``preference`` choice for CELL data
| over POINT data. This is contrary to most other places in PyVista's
| API where the preference typically defaults to POINT data. We chose
| to prefer CELL data here so that if thresholding by a named array
| that exists for both the POINT and CELL data, this filter will
| default to the CELL data array while performing the CELL-wise
| operation.
|
| Parameters
| ----------
| value : float | sequence[float], optional
| Single value or ``(min, max)`` to be used for the data threshold. If
| a sequence, then length must be 2. If no value is specified, the
| non-NaN data range will be used to remove any NaN values.
| Please reference the ``method`` parameter for how single values
| are handled.
|
| scalars : str, optional
| Name of scalars to threshold on. Defaults to currently active scalars.
|
| invert : bool, default: False
| Invert the threshold results. That is, cells that would have been
| in the output with this option off are excluded, while cells that
| would have been excluded from the output are included.
|
| continuous : bool, default: False
| When True, the continuous interval [minimum cell scalar,
| maximum cell scalar] will be used to intersect the threshold bound,
| rather than the set of discrete scalar values from the vertices.
|
| preference : str, default: 'cell'
| When ``scalars`` is specified, this is the preferred array
| type to search for in the dataset. Must be either
| ``'point'`` or ``'cell'``. Throughout PyVista, the preference
| is typically ``'point'`` but since the threshold filter is a
| cell-wise operation, we prefer cell data for thresholding
| operations.
|
| all_scalars : bool, default: False
| If using scalars from point data, all
| points in a cell must satisfy the threshold when this
| value is ``True``. When ``False``, any point of the cell
| with a scalar value satisfying the threshold criterion
| will extract the cell. Has no effect when using cell data.
|
| component_mode : {'selected', 'all', 'any'}
| The method to satisfy the criteria for the threshold of
| multicomponent scalars. 'selected' (default)
| uses only the ``component``. 'all' requires all
| components to meet criteria. 'any' is when
| any component satisfies the criteria.
|
| component : int, default: 0
| When using ``component_mode='selected'``, this sets
| which component to threshold on.
|
| method : str, default: 'upper'
| Set the threshold method for single-values, defining which
| threshold bounds to use. If the ``value`` is a range, this
| parameter will be ignored, extracting data between the two
| values. For single values, ``'lower'`` will extract data
| lower than the ``value``. ``'upper'`` will extract data
| larger than the ``value``.
|
| progress_bar : bool, default: False
| Display a progress bar to indicate progress.
|
| Returns
| -------
| pyvista.UnstructuredGrid
| Dataset containing geometry that meets the threshold requirements.
|
| Examples
| --------
| >>> import pyvista as pv
| >>> import numpy as np
| >>> volume = np.zeros([10, 10, 10])
| >>> volume[:3] = 1
| >>> vol = pv.wrap(volume)
| >>> threshed = vol.threshold(0.1)
| >>> threshed
| UnstructuredGrid (...)
| N Cells: 243
| N Points: 400
| X Bounds: 0.000e+00, 3.000e+00
| Y Bounds: 0.000e+00, 9.000e+00
| Z Bounds: 0.000e+00, 9.000e+00
| N Arrays: 1
|
| Apply the threshold filter to Perlin noise. First generate
| the structured grid.
|
| >>> import pyvista as pv
| >>> noise = pv.perlin_noise(0.1, (1, 1, 1), (0, 0, 0))
| >>> grid = pv.sample_function(
| ... noise, [0, 1.0, -0, 1.0, 0, 1.0], dim=(20, 20, 20)
| ... )
| >>> grid.plot(
| ... cmap='gist_earth_r',
| ... show_scalar_bar=True,
| ... show_edges=False,
| ... )
|
| Next, apply the threshold.
|
| >>> import pyvista as pv
| >>> noise = pv.perlin_noise(0.1, (1, 1, 1), (0, 0, 0))
| >>> grid = pv.sample_function(
| ... noise, [0, 1.0, -0, 1.0, 0, 1.0], dim=(20, 20, 20)
| ... )
| >>> threshed = grid.threshold(value=0.02)
| >>> threshed.plot(
| ... cmap='gist_earth_r',
| ... show_scalar_bar=False,
| ... show_edges=True,
| ... )
|
| See :ref:`common_filter_example` for more examples using this filter.
|
| threshold_percent(self, percent=0.5, scalars=None, invert=False, continuous=False, preference='cell', method='upper', progress_bar=False)
| Threshold the dataset by a percentage of its range on the active scalars array.
|
| .. warning::
| Thresholding is inherently a cell operation, even though it can use
| associated point data for determining whether to keep a cell. In
| other words, whether or not a given point is included after
| thresholding depends on whether that point is part of a cell that
| is kept after thresholding.
|
| Parameters
| ----------
| percent : float | sequence[float], optional
| The percentage in the range ``(0, 1)`` to threshold. If value is
| out of 0 to 1 range, then it will be divided by 100 and checked to
| be in that range.
|
| scalars : str, optional
| Name of scalars to threshold on. Defaults to currently active scalars.
|
| invert : bool, default: False
| Invert the threshold results. That is, cells that would have been
| in the output with this option off are excluded, while cells that
| would have been excluded from the output are included.
|
| continuous : bool, default: False
| When True, the continuous interval [minimum cell scalar,
| maximum cell scalar] will be used to intersect the threshold bound,
| rather than the set of discrete scalar values from the vertices.
|
| preference : str, default: 'cell'
| When ``scalars`` is specified, this is the preferred array
| type to search for in the dataset. Must be either
| ``'point'`` or ``'cell'``. Throughout PyVista, the preference
| is typically ``'point'`` but since the threshold filter is a
| cell-wise operation, we prefer cell data for thresholding
| operations.
|
| method : str, default: 'upper'
| Set the threshold method for single-values, defining which
| threshold bounds to use. If the ``value`` is a range, this
| parameter will be ignored, extracting data between the two
| values. For single values, ``'lower'`` will extract data
| lower than the ``value``. ``'upper'`` will extract data
| larger than the ``value``.
|
| progress_bar : bool, default: False
| Display a progress bar to indicate progress.
|
| Returns
| -------
| pyvista.UnstructuredGrid
| Dataset containing geometry that meets the threshold requirements.
|
| Examples
| --------
| Apply a 50% threshold filter.
|
| >>> import pyvista
| >>> noise = pyvista.perlin_noise(0.1, (2, 2, 2), (0, 0, 0))
| >>> grid = pyvista.sample_function(
| ... noise, [0, 1.0, -0, 1.0, 0, 1.0], dim=(30, 30, 30)
| ... )
| >>> threshed = grid.threshold_percent(0.5)
| >>> threshed.plot(
| ... cmap='gist_earth_r',
| ... show_scalar_bar=False,
| ... show_edges=True,
| ... )
|
| Apply a 80% threshold filter.
|
| >>> threshed = grid.threshold_percent(0.8)
| >>> threshed.plot(
| ... cmap='gist_earth_r',
| ... show_scalar_bar=False,
| ... show_edges=True,
| ... )
|
| See :ref:`common_filter_example` for more examples using a similar filter.
|
| transform(self: vtkmodules.vtkCommonDataModel.vtkDataSet, trans: Union[vtkmodules.vtkCommonMath.vtkMatrix4x4, vtkmodules.vtkCommonTransforms.vtkTransform, numpy.ndarray], transform_all_input_vectors=False, inplace=True, progress_bar=False)
| Transform this mesh with a 4x4 transform.
|
| .. warning::
| When using ``transform_all_input_vectors=True``, there is
| no distinction in VTK between vectors and arrays with
| three components. This may be an issue if you have scalar
| data with three components (e.g. RGB data). This will be
| improperly transformed as if it was vector data rather
| than scalar data. One possible (albeit ugly) workaround
| is to store the three components as separate scalar
| arrays.
|
| .. warning::
| In general, transformations give non-integer results. This
| method converts integer-typed vector data to float before
| performing the transformation. This applies to the points
| array, as well as any vector-valued data that is affected
| by the transformation. To prevent subtle bugs arising from
| in-place transformations truncating the result to integers,
| this conversion always applies to the input mesh.
|
| Parameters
| ----------
| trans : vtk.vtkMatrix4x4, vtk.vtkTransform, or numpy.ndarray
| Accepts a vtk transformation object or a 4x4
| transformation matrix.
|
| transform_all_input_vectors : bool, default: False
| When ``True``, all arrays with three components are
| transformed. Otherwise, only the normals and vectors are
| transformed. See the warning for more details.
|
| inplace : bool, default: False
| When ``True``, modifies the dataset inplace.
|
| progress_bar : bool, default: False
| Display a progress bar to indicate progress.
|
| Returns
| -------
| pyvista.DataSet
| Transformed dataset. Return type matches input unless
| input dataset is a :class:`pyvista.ImageData`, in which
| case the output datatype is a :class:`pyvista.StructuredGrid`.
|
| Examples
| --------
| Translate a mesh by ``(50, 100, 200)``.
|
| >>> import numpy as np
| >>> from pyvista import examples
| >>> mesh = examples.load_airplane()
|
| Here a 4x4 :class:`numpy.ndarray` is used, but
| ``vtk.vtkMatrix4x4`` and ``vtk.vtkTransform`` are also
| accepted.
|
| >>> transform_matrix = np.array(
| ... [
| ... [1, 0, 0, 50],
| ... [0, 1, 0, 100],
| ... [0, 0, 1, 200],
| ... [0, 0, 0, 1],
| ... ]
| ... )
| >>> transformed = mesh.transform(transform_matrix)
| >>> transformed.plot(show_edges=True)
|
| warp_by_scalar(self, scalars=None, factor=1.0, normal=None, inplace=False, progress_bar=False, **kwargs)
| Warp the dataset's points by a point data scalars array's values.
|
| This modifies point coordinates by moving points along point
| normals by the scalar amount times the scale factor.
|
| Parameters
| ----------
| scalars : str, optional
| Name of scalars to warp by. Defaults to currently active scalars.
|
| factor : float, default: 1.0
| A scaling factor to increase the scaling effect. Alias
| ``scale_factor`` also accepted - if present, overrides ``factor``.
|
| normal : sequence, optional
| User specified normal. If given, data normals will be
| ignored and the given normal will be used to project the
| warp.
|
| inplace : bool, default: False
| If ``True``, the points of the given dataset will be updated.
|
| progress_bar : bool, default: False
| Display a progress bar to indicate progress.
|
| **kwargs : dict, optional
| Accepts ``scale_factor`` instead of ``factor``.
|
| Returns
| -------
| pyvista.DataSet
| Warped Dataset. Return type matches input.
|
| Examples
| --------
| First, plot the unwarped mesh.
|
| >>> from pyvista import examples
| >>> mesh = examples.download_st_helens()
| >>> mesh.plot(cmap='gist_earth', show_scalar_bar=False)
|
| Now, warp the mesh by the ``'Elevation'`` scalars.
|
| >>> warped = mesh.warp_by_scalar('Elevation')
| >>> warped.plot(cmap='gist_earth', show_scalar_bar=False)
|
| See :ref:`surface_normal_example` for more examples using this filter.
|
| warp_by_vector(self, vectors=None, factor=1.0, inplace=False, progress_bar=False)
| Warp the dataset's points by a point data vectors array's values.
|
| This modifies point coordinates by moving points along point
| vectors by the local vector times the scale factor.
|
| A classical application of this transform is to visualize
| eigenmodes in mechanics.
|
| Parameters
| ----------
| vectors : str, optional
| Name of vector to warp by. Defaults to currently active vector.
|
| factor : float, default: 1.0
| A scaling factor that multiplies the vectors to warp by. Can
| be used to enhance the warping effect.
|
| inplace : bool, default: False
| If ``True``, the function will update the mesh in-place.
|
| progress_bar : bool, default: False
| Display a progress bar to indicate progress.
|
| Returns
| -------
| pyvista.PolyData
| The warped mesh resulting from the operation.
|
| Examples
| --------
| Warp a sphere by vectors.
|
| >>> import pyvista as pv
| >>> from pyvista import examples
| >>> sphere = examples.load_sphere_vectors()
| >>> warped = sphere.warp_by_vector()
| >>> pl = pv.Plotter(shape=(1, 2))
| >>> pl.subplot(0, 0)
| >>> actor = pl.add_text("Before warp")
| >>> actor = pl.add_mesh(sphere, color='white')
| >>> pl.subplot(0, 1)
| >>> actor = pl.add_text("After warp")
| >>> actor = pl.add_mesh(warped, color='white')
| >>> pl.show()
|
| See :ref:`warp_by_vectors_example` and :ref:`eigenmodes_example` for
| more examples using this filter.
|
| ----------------------------------------------------------------------
| Data descriptors inherited from pyvista.core.filters.data_set.DataSetFilters:
|
| __weakref__
| list of weak references to the object (if defined)
|
| ----------------------------------------------------------------------
| Methods inherited from pyvista.core.dataobject.DataObject:
|
| __eq__(self, other)
| Test equivalency between data objects.
|
| __getstate__(self)
| Support pickle by serializing the VTK object data to something which can be pickled natively.
|
| The format of the serialized VTK object data depends on `pyvista.PICKLE_FORMAT` (case-insensitive).
| - If `pyvista.PICKLE_FORMAT == 'xml'`, the data is serialized as an XML-formatted string.
| - If `pyvista.PICKLE_FORMAT == 'legacy'`, the data is serialized to bytes in VTK's binary format.
|
| __setstate__(self, state)
| Support unpickle.
|
| add_field_data(self, array: numpy.ndarray, name: str, deep=True)
| Add field data.
|
| Use field data when size of the data you wish to associate
| with the dataset does not match the number of points or cells
| of the dataset.
|
| Parameters
| ----------
| array : sequence
| Array of data to add to the dataset as a field array.
|
| name : str
| Name to assign the field array.
|
| deep : bool, default: True
| Perform a deep copy of the data when adding it to the
| dataset.
|
| Examples
| --------
| Add field data to a PolyData dataset.
|
| >>> import pyvista
| >>> import numpy as np
| >>> mesh = pyvista.Sphere()
| >>> mesh.add_field_data(np.arange(10), 'my-field-data')
| >>> mesh['my-field-data']
| pyvista_ndarray([0, 1, 2, 3, 4, 5, 6, 7, 8, 9])
|
| Add field data to a ImageData dataset.
|
| >>> mesh = pyvista.ImageData(dimensions=(2, 2, 1))
| >>> mesh.add_field_data(
| ... ['I could', 'write', 'notes', 'here'], 'my-field-data'
| ... )
| >>> mesh['my-field-data']
| pyvista_ndarray(['I could', 'write', 'notes', 'here'], dtype='<U7')
|
| Add field data to a MultiBlock dataset.
|
| >>> blocks = pyvista.MultiBlock()
| >>> blocks.append(pyvista.Sphere())
| >>> blocks["cube"] = pyvista.Cube(center=(0, 0, -1))
| >>> blocks.add_field_data([1, 2, 3], 'my-field-data')
| >>> blocks.field_data['my-field-data']
| pyvista_ndarray([1, 2, 3])
|
| clear_field_data(self)
| Remove all field data.
|
| Examples
| --------
| Add field data to a PolyData dataset and then remove it.
|
| >>> import pyvista
| >>> mesh = pyvista.Sphere()
| >>> mesh.field_data['my-field-data'] = range(10)
| >>> len(mesh.field_data)
| 1
| >>> mesh.clear_field_data()
| >>> len(mesh.field_data)
| 0
|
| copy(self, deep=True)
| Return a copy of the object.
|
| Parameters
| ----------
| deep : bool, default: True
| When ``True`` makes a full copy of the object. When
| ``False``, performs a shallow copy where the points, cell,
| and data arrays are references to the original object.
|
| Returns
| -------
| pyvista.DataSet
| Deep or shallow copy of the input. Type is identical to
| the input.
|
| Examples
| --------
| Create and make a deep copy of a PolyData object.
|
| >>> import pyvista
| >>> mesh_a = pyvista.Sphere()
| >>> mesh_b = mesh_a.copy()
| >>> mesh_a == mesh_b
| True
|
| copy_attributes(self, dataset: vtkmodules.vtkCommonDataModel.vtkDataSet)
| Copy the data attributes of the input dataset object.
|
| Parameters
| ----------
| dataset : pyvista.DataSet
| Dataset to copy the data attributes from.
|
| Examples
| --------
| >>> import pyvista as pv
| >>> source = pv.ImageData(dimensions=(10, 10, 5))
| >>> source = source.compute_cell_sizes()
| >>> target = pv.ImageData(dimensions=(10, 10, 5))
| >>> target.copy_attributes(source)
| >>> target.plot(scalars='Volume', show_edges=True)
|
| copy_structure(self, dataset: vtkmodules.vtkCommonDataModel.vtkDataSet)
| Copy the structure (geometry and topology) of the input dataset object.
|
| Parameters
| ----------
| dataset : vtk.vtkDataSet
| Dataset to copy the geometry and topology from.
|
| Examples
| --------
| >>> import pyvista as pv
| >>> source = pv.ImageData(dimensions=(10, 10, 5))
| >>> target = pv.ImageData()
| >>> target.copy_structure(source)
| >>> target.plot(show_edges=True)
|
| deep_copy(self, to_copy: vtkmodules.vtkCommonDataModel.vtkDataObject) -> vtkmodules.vtkCommonDataModel.vtkDataObject
| Overwrite this data object with another data object as a deep copy.
|
| Parameters
| ----------
| to_copy : pyvista.DataObject or vtk.vtkDataObject
| Data object to perform a deep copy from.
|
| head(self, display=True, html=None)
| Return the header stats of this dataset.
|
| If in IPython, this will be formatted to HTML. Otherwise
| returns a console friendly string.
|
| Parameters
| ----------
| display : bool, default: True
| Display this header in iPython.
|
| html : bool, optional
| Generate the output as HTML.
|
| Returns
| -------
| str
| Header statistics.
|
| ----------------------------------------------------------------------
| Readonly properties inherited from pyvista.core.dataobject.DataObject:
|
| actual_memory_size
| Return the actual size of the dataset object.
|
| Returns
| -------
| int
| The actual size of the dataset object in kibibytes (1024
| bytes).
|
| Examples
| --------
| >>> from pyvista import examples
| >>> mesh = examples.load_airplane()
| >>> mesh.actual_memory_size # doctest:+SKIP
| 93
|
| field_data
| Return FieldData as DataSetAttributes.
|
| Use field data when size of the data you wish to associate
| with the dataset does not match the number of points or cells
| of the dataset.
|
| Returns
| -------
| DataSetAttributes
| FieldData as DataSetAttributes.
|
| Examples
| --------
| Add field data to a PolyData dataset and then return it.
|
| >>> import pyvista
| >>> import numpy as np
| >>> mesh = pyvista.Sphere()
| >>> mesh.field_data['my-field-data'] = np.arange(10)
| >>> mesh.field_data['my-field-data']
| pyvista_ndarray([0, 1, 2, 3, 4, 5, 6, 7, 8, 9])
|
| memory_address
| Get address of the underlying VTK C++ object.
|
| Returns
| -------
| str
| Memory address formatted as ``'Addr=%p'``.
|
| Examples
| --------
| >>> import pyvista
| >>> mesh = pyvista.Sphere()
| >>> mesh.memory_address
| 'Addr=...'
|
| ----------------------------------------------------------------------
| Data and other attributes inherited from pyvista.core.dataobject.DataObject:
|
| __hash__ = None
plotter = pv.Plotter()
plotter.add_mesh(region, show_edges=True)
plotter.add_axes()
plotter.view_xz()
plotter.show()
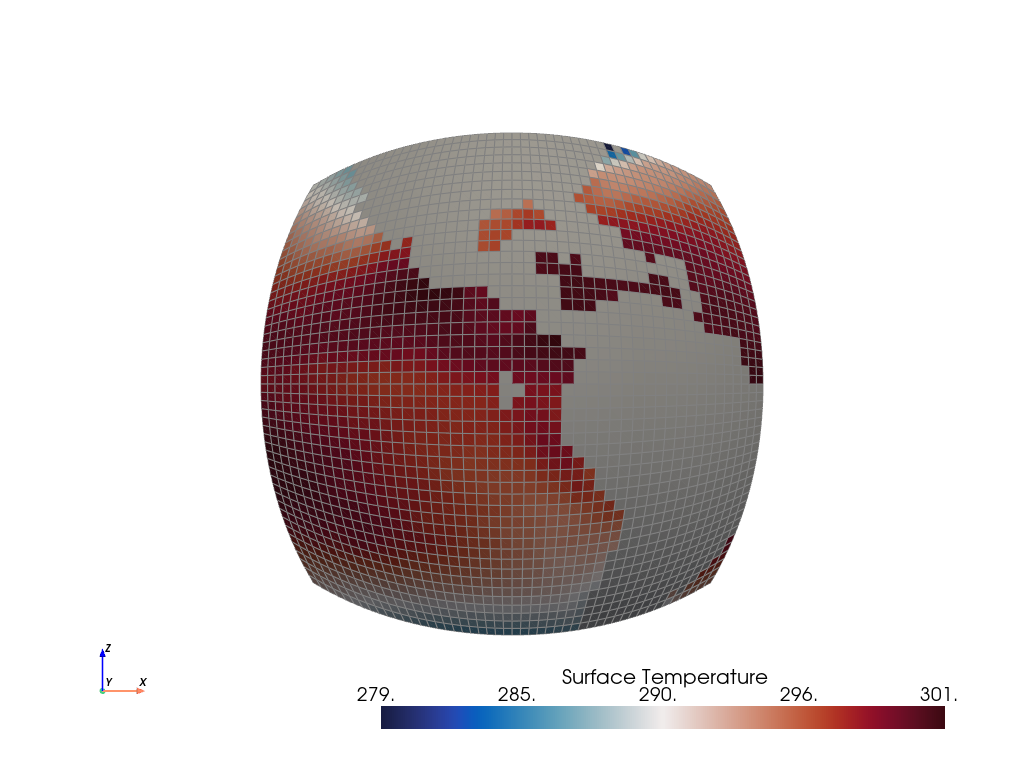
Let’s check what kind of array does region have.
print(region.array_names)
['Surface Temperature', 'gvCRS', 'gvRadius', 'gvName', 'vtkOriginalPointIds', 'vtkOriginalCellIds']
You could perhaps then play with the preference kwarg of the bbox.enclosed method to see the impact on the end result.
However, let’s geo-locate the region by also rendering a texture mapped base layer in addition to some coastlines:
plotter = gv.GeoPlotter()
plotter.add_mesh(region, show_edges=True)
plotter.add_coastlines()
plotter.add_base_layer(texture=gv.natural_earth_hypsometric())
plotter.view_xz()
plotter.show_axes()
plotter.show()
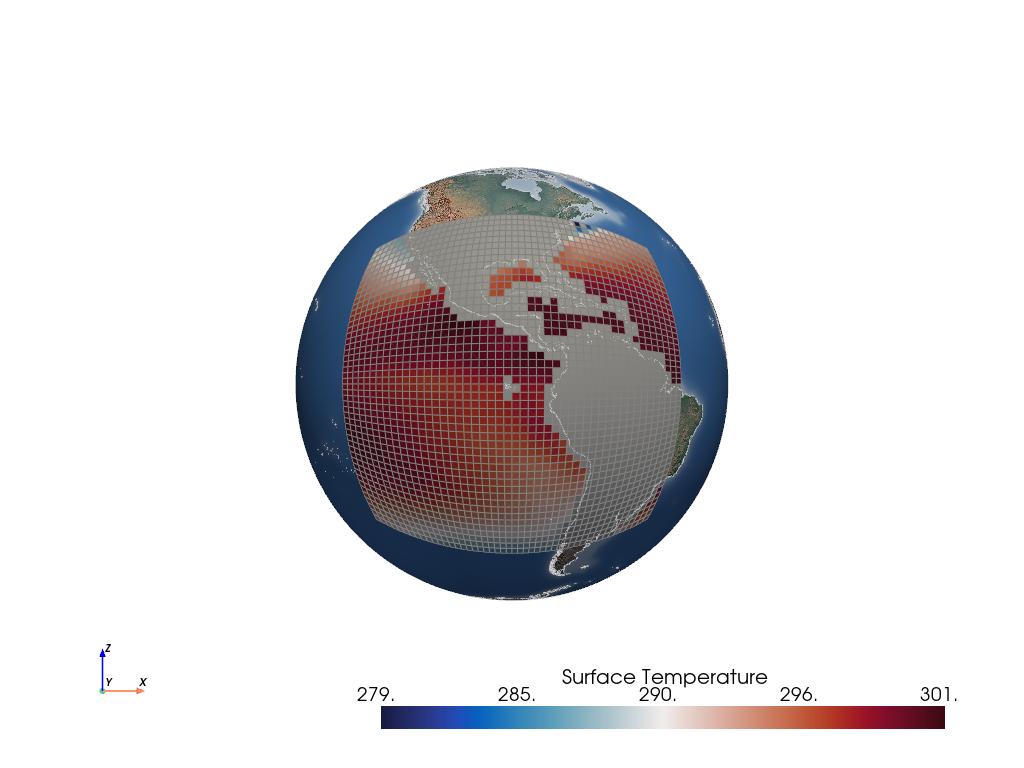
GeoVista has its own Plotter class, GeoPlotter. It is a customized class that inherits from PyVista’s Plotter class and provides practical methods for geoscience such as add_coastlines and add_base_layer.
help(gv.GeoPlotter)
Help on class GeoPlotter in module geovista.geoplotter:
class GeoPlotter(GeoPlotterBase, pyvista.plotting.plotter.Plotter)
| GeoPlotter(*args, **kwargs)
|
| A geospatial aware plotter.
|
| See :class:`geovista.geoplotter.GeoPlotterBase` and
| :class:`pyvista.Plotter`.
|
| Notes
| -----
| .. versionadded:: 0.1.0
|
| Method resolution order:
| GeoPlotter
| GeoPlotterBase
| pyvista.plotting.plotter.Plotter
| pyvista.plotting.plotter.BasePlotter
| pyvista.plotting.picking.PickingHelper
| pyvista.plotting.picking.PickingMethods
| pyvista.plotting.picking.PickingInterface
| pyvista.plotting.widgets.WidgetHelper
| builtins.object
|
| Methods inherited from GeoPlotterBase:
|
| __init__(self, *args: 'Any | None', **kwargs: 'Any | None')
| Create geospatial aware plotter.
|
| Parameters
| ----------
| crs : str or CRS, optional
| The target CRS to render geolocated meshes added to the plotter.
| **kwargs : dict, optional
| See :class:`pyvista.Plotter` for further details.
|
| Notes
| -----
| .. versionadded:: 0.1.0
|
| add_base_layer(self, mesh: 'pv.PolyData | None' = None, **kwargs: 'Any | None') -> 'vtk.vtkActor'
| Generate a cubed-sphere base layer mesh and add to the plotter scene.
|
| Optionally, a `mesh` may be provided, which better fits the
| geometry of the surface mesh.
|
| Parameters
| ----------
| mesh : PolyData, optional
| Use the provided mesh as the base layer.
| radius : float, optional
| The radius of the spherical mesh to generate as the base layer. Defaults
| to :data:`geovista.common.RADIUS`.
| resolution : str, optional
| The resolution of the cubed-sphere to generate as the base layer,
| which may be either ``c48``, ``c96`` or ``c192``. Defaults to
| :data:`geovista.samples.LFRIC_RESOLUTION`. Alternatively, generate a
| regular grid using a format of ``rN``, where ``N`` is the number of cells
| in latitude, and ``N * 1.5`` cells in longitude. When adding a base layer
| to a projection, the default is to use a regular grid with resolution
| :data:`REGULAR_RESOLUTION`.
| zlevel : int, default=-1
| The z-axis level. Used in combination with the `zscale` to offset the
| `radius` by a proportional amount i.e., ``radius * zlevel * zscale``.
| zscale : float, optional
| The proportional multiplier for z-axis `zlevel`. Defaults to
| :data:`geovista.common.ZLEVEL_SCALE`.
| **kwargs : dict, optional
| See :meth:`pyvista.Plotter.add_mesh`.
|
| Returns
| -------
| vtkActor
| The rendered actor added to the plotter scene.
|
| Notes
| -----
| .. versionadded:: 0.1.0
|
| add_coastlines(self, resolution: 'str | None' = None, radius: 'float | None' = None, zlevel: 'int | None' = None, zscale: 'float | None' = None, rtol: 'float | None' = None, atol: 'float | None' = None, **kwargs: 'Any | None') -> 'vtk.vtkActor'
| Generate coastlines and add to the plotter scene.
|
| Parameters
| ----------
| resolution : str, optional
| The resolution of the Natural Earth coastlines, which may be either
| ``110m``, ``50m``, or ``10m``. Defaults to
| :data:`geovista.common.COASTLINES_RESOLUTION`.
| radius : float, optional
| The radius of the sphere. Defaults to :data:`geovista.common.RADIUS`.
| zlevel : int, default=1
| The z-axis level. Used in combination with the `zscale` to offset the
| `radius` by a proportional amount i.e., ``radius * zlevel * zscale``.
| zscale : float, optional
| The proportional multiplier for z-axis `zlevel`. Defaults to
| :data:`geovista.common.ZLEVEL_SCALE`.
| rtol : float, optional
| The relative tolerance for values close to longitudinal
| :func:`geovista.common.wrap` base + period.
| atol : float, optional
| The absolute tolerance for values close to longitudinal
| :func:`geovista.common.wrap` base + period.
| **kwargs : dict, optional
| See :meth:`pyvista.Plotter.add_mesh`.
|
| Returns
| -------
| vtkActor
| The rendered actor added to the plotter scene.
|
| Notes
| -----
| .. versionadded:: 0.1.0
|
| add_graticule(self, lon_start: 'float | None' = None, lon_stop: 'float | None' = None, lon_step: 'float | None' = None, lat_start: 'float | None' = None, lat_step: 'float | None' = None, lat_stop: 'float | None' = None, poles_parallel: 'bool | None' = None, poles_label: 'bool | None' = None, show_labels: 'bool | None' = None, radius: 'float | None' = None, zlevel: 'int | None' = None, zscale: 'float | None' = None, mesh_args: 'dict[Any, Any] | None' = None, point_labels_args: 'dict[Any, Any] | None' = None) -> 'None'
| Generate a graticule and add to the plotter scene.
|
| This involves generating lines of constant latitude (parallels) and
| lines of constant longitude (meridians), which together form the graticule.
|
| Parameters
| ----------
| lon_start : float, optional
| The first line of longitude (degrees). The graticule will include this
| meridian. Defaults to :data:`geovista.gridlines.LONGITUDE_START`.
| lon_stop : float, optional
| The last line of longitude (degrees). The graticule will include this
| meridian when it is a multiple of ``lon_step``. Also see
| ``closed_interval``. Defaults to :data:`geovista.gridlines.LONGITUDE_STOP`.
| lon_step : float, optional
| The delta (degrees) between neighbouring meridians. Defaults to
| :data:`geovista.gridlines.LONGITUDE_STEP`.
| lat_start : float, optional
| The first line of latitude (degrees). The graticule will include this
| parallel. Also see `poles_parallel`. Defaults to
| :data:`geovista.gridlines.LATITUDE_START`.
| lat_stop : float, optional
| The last line of latitude (degrees). The graticule will include this
| parallel when it is a multiple of ``lat_step``. Defaults to
| :data:`geovista.gridlines.LATITUDE_STOP`.
| lat_step : float, optional
| The delta (degrees) between neighbouring parallels. Defaults to
| :data:`geovista.gridlines.LATITUDE_STEP`.
| poles_parallel : bool, optional
| Whether to create a line of latitude at the north/south poles. Defaults to
| :data:`geovista.gridlines.LATITUDE_POLES_PARALLEL`.
| poles_label : bool, optional
| Whether to create a single north/south pole label. Only applies when
| ``poles_parallel=False``. Defaults to
| :data:`geovista.gridlines.LATITUDE_POLES_LABEL`.
| show_labels : bool, optional
| Whether to render the labels of the parallels and meridians. Defaults to
| :data:`GRATICULE_SHOW_LABELS`.
| radius : float, optional
| The radius of the sphere. Defaults to :data:`geovista.common.RADIUS`.
| zlevel : int, optional
| The z-axis level. Used in combination with the `zscale` to offset the
| `radius` by a proportional amount i.e., ``radius * zlevel * zscale``.
| Defaults to :data:`geovista.gridlines.GRATICULE_ZLEVEL`
| zscale : float, optional
| The proportional multiplier for z-axis `zlevel`. Defaults to
| :data:`geovista.common.ZLEVEL_SCALE`.
| mesh_args : dict, optional
| Arguments to pass through to :meth:`pyvista.Plotter.add_mesh`.
| point_labels_args : dict, optional
| Arguments to pass through to :meth:`pyvista.Plotter.add_point_labels`.
|
| Notes
| -----
| .. versionadded:: 0.3.0
|
| add_meridian(self, lon: 'float', lat_step: 'float | None' = None, n_samples: 'int | None' = None, show_labels: 'bool | None' = None, radius: 'float | None' = None, zlevel: 'int | None' = None, zscale: 'float | None' = None, mesh_args: 'dict[Any, Any] | None' = None, point_labels_args: 'dict[Any, Any] | None' = None) -> 'None'
| Generate a line of constant longitude and add to the plotter scene.
|
| Parameters
| ----------
| lon : float
| The constant line of longitude (degrees) to generate.
| lat_step : float, optional
| The delta (degrees) between neighbouring parallels. Defaults to
| :data:`geovista.gridlines.LATITUDE_STEP`.
| n_samples : int, optional
| The number of points in a single line of longitude. Defaults to
| :data:`geovista.gridlines.LONGITUDE_N_SAMPLES`.
| show_labels : bool, optional
| Whether to render the meridian label. Defaults to
| :data:`GRATICULE_SHOW_LABELS`.
| radius : float, optional
| The radius of the sphere. Defaults to :data:`geovista.common.RADIUS`.
| zlevel : int, optional
| The z-axis level. Used in combination with the `zscale` to offset the
| `radius` by a proportional amount i.e., ``radius * zlevel * zscale``.
| Defaults to :data:`geovista.gridlines.GRATICULE_ZLEVEL`
| zscale : float, optional
| The proportional multiplier for z-axis `zlevel`. Defaults to
| :data:`geovista.common.ZLEVEL_SCALE`.
| mesh_args : dict, optional
| Arguments to pass through to :meth:`pyvista.Plotter.add_mesh`.
| point_labels_args : dict, optional
| Arguments to pass through to :meth:`pyvista.Plotter.add_point_labels`.
|
| Notes
| -----
| .. versionadded:: 0.3.0
|
| add_meridians(self, start: 'float | None' = None, stop: 'float | None' = None, step: 'float | None' = None, lat_step: 'float | None' = None, n_samples: 'int | None' = None, show_labels: 'bool | None' = None, radius: 'float | None' = None, zlevel: 'int | None' = None, zscale: 'float | None' = None, mesh_args: 'dict[Any, Any] | None' = None, point_labels_args: 'dict[Any, Any] | None' = None) -> 'None'
| Generate lines of constant longitude and add to the plotter scene.
|
| Parameters
| ----------
| start : float, optional
| The first line of longitude (degrees). The graticule will include this
| meridian. Defaults to :data:`geovista.gridlines.LONGITUDE_START`.
| stop : float, optional
| The last line of longitude (degrees). The graticule will include this
| meridian when it is a multiple of ``step``. Also see ``closed_interval``.
| Defaults to :data:`geovista.gridlines.LONGITUDE_STOP`.
| step : float, optional
| The delta (degrees) between neighbouring meridians. Defaults to
| :data:`geovista.gridlines.LONGITUDE_STEP`.
| lat_step : float, optional
| The delta (degrees) between neighbouring parallels. Defaults to
| :data:`geovista.gridlines.LATITUDE_STEP`.
| n_samples : int, optional
| The number of points in a single line of longitude. Defaults to
| :data:`geovista.gridlines.LONGITUDE_N_SAMPLES`.
| show_labels : bool, optional
| Whether to render the labels of the meridians. Defaults to
| :data:`GRATICULE_SHOW_LABELS`.
| radius : float, optional
| The radius of the sphere. Defaults to :data:`geovista.common.RADIUS`.
| zlevel : int, optional
| The z-axis level. Used in combination with the `zscale` to offset the
| `radius` by a proportional amount i.e., ``radius * zlevel * zscale``.
| Defaults to :data:`geovista.gridlines.GRATICULE_ZLEVEL`
| zscale : float, optional
| The proportional multiplier for z-axis `zlevel`. Defaults to
| :data:`geovista.common.ZLEVEL_SCALE`.
| mesh_args : dict, optional
| Arguments to pass through to :meth:`pyvista.Plotter.add_mesh`.
| point_labels_args : dict, optional
| Arguments to pass through to :meth:`pyvista.Plotter.add_point_labels`.
|
| Notes
| -----
| .. versionadded:: 0.3.0
|
| add_mesh(self, mesh: 'Any', **kwargs: 'Any | None')
| Add the ``mesh`` to the plotter scene.
|
| See :meth:`pyvista.Plotter.add_mesh`.
|
| Parameters
| ----------
| mesh : PolyData
| The mesh to add to the plotter.
| rtol : float, optional
| The relative tolerance for values close to longitudinal
| :func:`geovista.common.wrap` base + period.
| atol : float, optional
| The absolute tolerance for values close to longitudinal
| :func:`geovista.common.wrap` base + period.
| radius : float, optional
| The radius of the sphere. Defaults to :data:`geovista.common.RADIUS`.
| zlevel : int or ArrayLike, default=0
| The z-axis level. Used in combination with the `zscale` to offset the
| `radius`/vertical by a proportional amount e.g.,
| ``radius * zlevel * zscale``. If `zlevel` is not a scalar, then its shape
| must match or broadcast with the shape of the ``mesh.points``.
| zscale : float, optional
| The proportional multiplier for z-axis `zlevel`. Defaults to
| :data:`geovista.common.ZLEVEL_SCALE`.
| **kwargs : dict, optional
| See :meth:`pyvista.Plotter.add_mesh`.
|
| Returns
| -------
| vtkActor
| The rendered actor added to the plotter scene.
|
| Notes
| -----
| .. versionadded:: 0.1.0
|
| add_parallel(self, lat: 'float', lon_step: 'float | None' = None, n_samples: 'int | None' = None, poles_parallel: 'bool | None' = None, show_labels: 'bool | None' = None, radius: 'float | None' = None, zlevel: 'int | None' = None, zscale: 'float | None' = None, mesh_args: 'dict[Any, Any] | None' = None, point_labels_args: 'dict[Any, Any] | None' = None) -> 'None'
| Generate a line of constant latitude and add to the plotter scene.
|
| Parameters
| ----------
| lat : float
| The constant line of latitude (degrees) to generate.
| lon_step : float, optional
| The delta (degrees) between neighbouring meridians. Defaults to
| :data:`geovista.gridlines.LONGITUDE_STEP`.
| n_samples : int, optional
| The number of points in a single line of latitude. Defaults to
| :data:`geovista.gridlines.LATITUDE_N_SAMPLES`.
| poles_parallel : bool, optional
| Whether to create a line of latitude at the north/south poles. Defaults to
| :data:`geovista.gridlines.LATITUDE_POLES_PARALLEL`.
| show_labels : bool, optional
| Whether to render the parallel label. Defaults to
| :data:`GRATICULE_SHOW_LABELS`.
| radius : float, optional
| The radius of the sphere. Defaults to :data:`geovista.common.RADIUS`.
| zlevel : int, optional
| The z-axis level. Used in combination with the `zscale` to offset the
| `radius` by a proportional amount i.e., ``radius * zlevel * zscale``.
| Defaults to :data:`geovista.gridlines.GRATICULE_ZLEVEL`
| zscale : float, optional
| The proportional multiplier for z-axis `zlevel`. Defaults to
| :data:`geovista.common.ZLEVEL_SCALE`.
| mesh_args : dict, optional
| Arguments to pass through to :meth:`pyvista.Plotter.add_mesh`.
| point_labels_args : dict, optional
| Arguments to pass through to :meth:`pyvista.Plotter.add_point_labels`.
|
| Notes
| -----
| .. versionadded:: 0.3.0
|
| add_parallels(self, start: 'float | None' = None, stop: 'float | None' = None, step: 'float | None' = None, lon_step: 'float | None' = None, n_samples: 'int | None' = None, poles_parallel: 'bool | None' = None, poles_label: 'bool | None' = None, show_labels: 'bool | None' = None, radius: 'float | None' = None, zlevel: 'int | None' = None, zscale: 'float | None' = None, mesh_args: 'dict[Any, Any] | None' = None, point_labels_args: 'dict[Any, Any] | None' = None) -> 'None'
| Generate lines of constant latitude and add to the plotter scene.
|
| Parameters
| ----------
| start : float, optional
| The first line of latitude (degrees). The graticule will include this
| parallel. Also see ``poles_parallel``. Defaults to
| :data:`geovista.gridlines.LATITUDE_START`.
| stop : float, optional
| The last line of latitude (degrees). The graticule will include this
| parallel when it is a multiple of ``step``. Also see ``poles_parallel`.
| Defaults to :data:`geovista.gridlines.LATITUDE_STOP`.
| step : float, optional
| The delta (degrees) between neighbouring parallels. Defaults to
| :data:`geovista.gridlines.LATITUDE_STEP`.
| lon_step : float, optional
| The delta (degrees) between neighbouring meridians. Defaults to
| :data:`geovista.gridlines.LONGITUDE_STEP`.
| n_samples : int, optional
| The number of points in a single line of latitude. Defaults to
| :data:`geovista.gridlines.LATITUDE_N_SAMPLES`.
| poles_parallel : bool, optional
| Whether to create a line of latitude at the north/south poles. Defaults to
| :data:`geovista.gridlines.LATITUDE_POLES_PARALLEL`.
| poles_label : bool, optional
| Whether to create a single north/south pole label. Only applies when
| ``poles_parallel=False``. Defaults to
| :data:`geovista.gridlines.LATITUDE_POLES_LABEL`.
| show_labels : bool, optional
| Whether to render the labels of the parallels. Defaults to
| :data:`GRATICULE_SHOW_LABELS`.
| radius : float, optional
| The radius of the sphere. Defaults to :data:`geovista.common.RADIUS`.
| zlevel : int, optional
| The z-axis level. Used in combination with the `zscale` to offset the
| `radius` by a proportional amount i.e., ``radius * zlevel * zscale``.
| Defaults to :data:`geovista.gridlines.GRATICULE_ZLEVEL`
| zscale : float, optional
| The proportional multiplier for z-axis `zlevel`. Defaults to
| :data:`geovista.common.ZLEVEL_SCALE`.
| mesh_args : dict, optional
| Arguments to pass through to :meth:`pyvista.Plotter.add_mesh`.
| point_labels_args : dict, optional
| Arguments to pass through to :meth:`pyvista.Plotter.add_point_labels`.
|
| Notes
| -----
| .. versionadded:: 0.3.0
|
| ----------------------------------------------------------------------
| Data descriptors inherited from GeoPlotterBase:
|
| __dict__
| dictionary for instance variables (if defined)
|
| __weakref__
| list of weak references to the object (if defined)
|
| ----------------------------------------------------------------------
| Methods inherited from pyvista.plotting.plotter.Plotter:
|
| add_cursor(self, bounds=(-1.0, 1.0, -1.0, 1.0, -1.0, 1.0), focal_point=(0.0, 0.0, 0.0), color=None)
| Add a cursor of a PyVista or VTK dataset to the scene.
|
| Parameters
| ----------
| bounds : sequence[float], default: (-1.0, 1.0, -1.0, 1.0, -1.0, 1.0)
| Specify the bounds in the format of:
|
| - ``(xmin, xmax, ymin, ymax, zmin, zmax)``
|
| focal_point : sequence[float], default: (0.0, 0.0, 0.0)
| The focal point of the cursor.
|
| color : ColorLike, optional
| Either a string, RGB sequence, or hex color string. For one
| of the following.
|
| * ``color='white'``
| * ``color='w'``
| * ``color=[1.0, 1.0, 1.0]``
| * ``color='#FFFFFF'``
|
| Returns
| -------
| vtk.vtkActor
| VTK actor of the 2D cursor.
|
| Examples
| --------
| >>> import pyvista
| >>> sphere = pyvista.Sphere()
| >>> plotter = pyvista.Plotter()
| >>> _ = plotter.add_mesh(sphere)
| >>> _ = plotter.add_cursor()
| >>> plotter.show()
|
| add_title(self, title, font_size=18, color=None, font=None, shadow=False)
| Add text to the top center of the plot.
|
| This is merely a convenience method that calls ``add_text``
| with ``position='upper_edge'``.
|
| Parameters
| ----------
| title : str
| The text to add the rendering.
|
| font_size : float, default: 18
| Sets the size of the title font.
|
| color : ColorLike, optional
| Either a string, rgb list, or hex color string. Defaults
| to white or the value of the global theme if set. For
| example:
|
| * ``color='white'``
| * ``color='w'``
| * ``color=[1.0, 1.0, 1.0]``
| * ``color='#FFFFFF'``
|
| font : str, optional
| Font name may be ``'courier'``, ``'times'``, or ``'arial'``.
|
| shadow : bool, default: False
| Adds a black shadow to the text.
|
| Returns
| -------
| vtk.vtkTextActor
| Text actor added to plot.
|
| Examples
| --------
| >>> import pyvista
| >>> pl = pyvista.Plotter()
| >>> pl.background_color = 'grey'
| >>> actor = pl.add_title(
| ... 'Plot Title', font='courier', color='k', font_size=40
| ... )
| >>> pl.show()
|
| show(self, title=None, window_size=None, interactive=True, auto_close=None, interactive_update=False, full_screen=None, screenshot=False, return_img=False, cpos=None, jupyter_backend=None, return_viewer=False, return_cpos=None, before_close_callback=None, **kwargs)
| Display the plotting window.
|
| Parameters
| ----------
| title : str, optional
| Title of plotting window. Defaults to
| :attr:`pyvista.global_theme.title <pyvista.plotting.themes.Theme.title>`.
|
| window_size : list, optional
| Window size in pixels. Defaults to
| :attr:`pyvista.global_theme.window_size <pyvista.plotting.themes.Theme.window_size>`.
|
| interactive : bool, optional
| Enabled by default. Allows user to pan and move figure.
| Defaults to
| :attr:`pyvista.global_theme.interactive <pyvista.plotting.themes.Theme.interactive>`.
|
| auto_close : bool, optional
| Exits plotting session when user closes the window when
| interactive is ``True``. Defaults to
| :attr:`pyvista.global_theme.auto_close <pyvista.plotting.themes.Theme.auto_close>`.
|
| interactive_update : bool, default: False
| Allows user to non-blocking draw, user should call
| :func:`Plotter.update` in each iteration.
|
| full_screen : bool, optional
| Opens window in full screen. When enabled, ignores
| ``window_size``. Defaults to
| :attr:`pyvista.global_theme.full_screen <pyvista.plotting.themes.Theme.full_screen>`.
|
| screenshot : str | pathlib.Path | io.BytesIO | bool, default: False
| Take a screenshot of the initial state of the plot. If a string,
| it specifies the path to which the screenshot is saved. If
| ``True``, the screenshot is returned as an array. For interactive
| screenshots it's recommended to first call ``show()`` with
| ``auto_close=False`` to set the scene, then save the screenshot in
| a separate call to ``show()`` or :func:`Plotter.screenshot`.
| See also the ``before_close_callback`` parameter for an
| alternative.
|
| return_img : bool, default: False
| Returns a numpy array representing the last image along
| with the camera position.
|
| cpos : sequence[sequence[float]], optional
| The camera position. You can also set this with
| :attr:`Plotter.camera_position`.
|
| jupyter_backend : str, optional
| Jupyter notebook plotting backend to use. One of the
| following:
|
| * ``'none'`` : Do not display in the notebook.
| * ``'static'`` : Display a static figure.
| * ``'trame'`` : Display a dynamic figure with Trame.
|
| This can also be set globally with
| :func:`pyvista.set_jupyter_backend`.
|
| A dictionary ``jupyter_kwargs`` can also be passed to further
| configure how the backend displays.
|
| return_viewer : bool, default: False
| Return the jupyterlab viewer, scene, or display object when
| plotting with Jupyter notebook. When ``False`` and within a Jupyter
| environment, the scene will be immediately shown within the
| notebook. Set this to ``True`` to return the scene instead.
|
| return_cpos : bool, optional
| Return the last camera position from the render window
| when enabled. Default based on theme setting. See
| :attr:`pyvista.plotting.themes.Theme.return_cpos`.
|
| before_close_callback : Callable, optional
| Callback that is called before the plotter is closed.
| The function takes a single parameter, which is the plotter object
| before it closes. An example of use is to capture a screenshot after
| interaction::
|
| def fun(plotter):
| plotter.screenshot('file.png')
|
| **kwargs : dict, optional
| Developer keyword arguments.
|
| Returns
| -------
| cpos : list
| List of camera position, focal point, and view up.
| Returned only when ``return_cpos=True`` or set in the
| default global or plot theme.
|
| image : np.ndarray
| Numpy array of the last image when either ``return_img=True``
| or ``screenshot=True`` is set. Optionally contains alpha
| values. Sized:
|
| * [Window height x Window width x 3] if the theme sets
| ``transparent_background=False``.
| * [Window height x Window width x 4] if the theme sets
| ``transparent_background=True``.
|
| widget : ipywidgets.Widget
| IPython widget when ``return_viewer=True``.
|
| Notes
| -----
| Please use the ``q``-key to close the plotter as some
| operating systems (namely Windows) will experience issues
| saving a screenshot if the exit button in the GUI is pressed.
|
| Examples
| --------
| Simply show the plot of a mesh.
|
| >>> import pyvista as pv
| >>> pl = pv.Plotter()
| >>> _ = pl.add_mesh(pv.Cube())
| >>> pl.show()
|
| Take a screenshot interactively. Screenshot will be of the
| first image shown, so use the first call with
| ``auto_close=False`` to set the scene before taking the
| screenshot.
|
| >>> pl = pv.Plotter()
| >>> _ = pl.add_mesh(pv.Cube())
| >>> pl.show(auto_close=False) # doctest:+SKIP
| >>> pl.show(screenshot='my_image.png') # doctest:+SKIP
|
| Obtain the camera position when using ``show``.
|
| >>> pl = pv.Plotter()
| >>> _ = pl.add_mesh(pv.Sphere())
| >>> pl.show(return_cpos=True) # doctest:+SKIP
| [(2.223005211686484, -0.3126909484828709, 2.4686209867735065),
| (0.0, 0.0, 0.0),
| (-0.6839951597283509, -0.47207319712073137, 0.5561452310578585)]
|
| ----------------------------------------------------------------------
| Readonly properties inherited from pyvista.plotting.plotter.Plotter:
|
| meshes
| Return plotter meshes.
|
| Returns
| -------
| List[Union[pyvista.DataSet, PyVista.MultiBlock]]
| List of mesh objects such as pv.PolyData, pv.UnstructuredGrid, etc.
|
| ----------------------------------------------------------------------
| Data and other attributes inherited from pyvista.plotting.plotter.Plotter:
|
| last_update_time = 1713216392.787595
|
| ----------------------------------------------------------------------
| Methods inherited from pyvista.plotting.plotter.BasePlotter:
|
| __del__(self)
| Delete the plotter.
|
| __new__(cls, *args, **kwargs)
|
| add_actor(self, actor, reset_camera=False, name=None, culling=False, pickable=True, render=True, remove_existing_actor=True)
| Add an actor to render window.
|
| Creates an actor if input is a mapper.
|
| Parameters
| ----------
| actor : vtk.vtkActor | vtk.vtkMapper | pyvista.Actor
| The actor to be added. Can be either ``vtkActor`` or ``vtkMapper``.
|
| reset_camera : bool, default: False
| Resets the camera when ``True``.
|
| name : str, optional
| Name to assign to the actor. Defaults to the memory address.
|
| culling : str, default: False
| Does not render faces that are culled. Options are
| ``'front'`` or ``'back'``. This can be helpful for dense
| surface meshes, especially when edges are visible, but can
| cause flat meshes to be partially displayed.
|
| pickable : bool, default: True
| Whether to allow this actor to be pickable within the
| render window.
|
| render : bool, default: True
| If the render window is being shown, trigger a render
| after adding the actor.
|
| remove_existing_actor : bool, default: True
| Removes any existing actor if the named actor ``name`` is already
| present.
|
| Returns
| -------
| actor : vtk.vtkActor or pyvista.Actor
| The actor.
|
| actor_properties : vtk.Properties
| Actor properties.
|
| add_arrows(self, cent, direction, mag=1, **kwargs)
| Add arrows to the plotter.
|
| Parameters
| ----------
| cent : np.ndarray
| Array of centers.
|
| direction : np.ndarray
| Array of direction vectors.
|
| mag : float, optional
| Amount to scale the direction vectors.
|
| **kwargs : dict, optional
| See :func:`pyvista.Plotter.add_mesh` for optional
| keyword arguments.
|
| Returns
| -------
| pyvista.Actor
| Actor of the arrows.
|
| Examples
| --------
| Plot a random field of vectors and save a screenshot of it.
|
| >>> import numpy as np
| >>> import pyvista
| >>> cent = np.random.random((10, 3))
| >>> direction = np.random.random((10, 3))
| >>> plotter = pyvista.Plotter()
| >>> _ = plotter.add_arrows(cent, direction, mag=2)
| >>> plotter.show()
|
| add_axes(self, interactive=None, line_width=2, color=None, x_color=None, y_color=None, z_color=None, xlabel='X', ylabel='Y', zlabel='Z', labels_off=False, box=None, box_args=None, viewport=(0, 0, 0.2, 0.2), marker_args=None, **kwargs)
| Add an interactive axes widget in the bottom left corner.
|
| Parameters
| ----------
| interactive : bool, optional
| Enable this orientation widget to be moved by the user.
|
| line_width : int, default: 2
| The width of the marker lines.
|
| color : ColorLike, optional
| Color of the labels.
|
| x_color : ColorLike, optional
| Color used for the x axis arrow. Defaults to theme axes parameters.
|
| y_color : ColorLike, optional
| Color used for the y axis arrow. Defaults to theme axes parameters.
|
| z_color : ColorLike, optional
| Color used for the z axis arrow. Defaults to theme axes parameters.
|
| xlabel : str, default: "X"
| Text used for the x axis.
|
| ylabel : str, default: "Y"
| Text used for the y axis.
|
| zlabel : str, default: "Z"
| Text used for the z axis.
|
| labels_off : bool, default: false
| Enable or disable the text labels for the axes.
|
| box : bool, optional
| Show a box orientation marker. Use ``box_args`` to adjust.
| See :func:`pyvista.create_axes_orientation_box` for details.
|
| box_args : dict, optional
| Parameters for the orientation box widget when
| ``box=True``. See the parameters of
| :func:`pyvista.create_axes_orientation_box`.
|
| viewport : sequence[float], default: (0, 0, 0.2, 0.2)
| Viewport ``(xstart, ystart, xend, yend)`` of the widget.
|
| marker_args : dict, optional
| Marker arguments.
|
| .. deprecated:: 0.37.0
| Use ``**kwargs`` for passing parameters for the orientation
| marker widget. See the parameters of
| :func:`pyvista.create_axes_marker`.
|
| **kwargs : dict, optional
| Used for passing parameters for the orientation marker
| widget. See the parameters of :func:`pyvista.create_axes_marker`.
|
| Returns
| -------
| vtk.vtkAxesActor
| Axes actor.
|
| Examples
| --------
| Show axes without labels and with thick lines.
|
| >>> import pyvista
| >>> pl = pyvista.Plotter()
| >>> actor = pl.add_mesh(pyvista.Box(), show_edges=True)
| >>> _ = pl.add_axes(line_width=5, labels_off=True)
| >>> pl.show()
|
| Use the axes orientation widget instead of the default arrows.
|
| >>> pl = pyvista.Plotter()
| >>> actor = pl.add_mesh(pyvista.Sphere())
| >>> _ = pl.add_axes(box=True)
| >>> pl.show()
|
| Specify more parameters for the axes marker.
|
| >>> import pyvista
| >>> pl = pyvista.Plotter()
| >>> actor = pl.add_mesh(pyvista.Box(), show_edges=True)
| >>> _ = pl.add_axes(
| ... line_width=5,
| ... cone_radius=0.6,
| ... shaft_length=0.7,
| ... tip_length=0.3,
| ... ambient=0.5,
| ... label_size=(0.4, 0.16),
| ... )
| >>> pl.show()
|
| add_axes_at_origin(self, x_color=None, y_color=None, z_color=None, xlabel='X', ylabel='Y', zlabel='Z', line_width=2, labels_off=False)
| Add axes actor at origin.
|
| Parameters
| ----------
| x_color : ColorLike, optional
| The color of the x axes arrow.
|
| y_color : ColorLike, optional
| The color of the y axes arrow.
|
| z_color : ColorLike, optional
| The color of the z axes arrow.
|
| xlabel : str, default: "X"
| The label of the x axes arrow.
|
| ylabel : str, default: "Y"
| The label of the y axes arrow.
|
| zlabel : str, default: "Z"
| The label of the z axes arrow.
|
| line_width : int, default: 2
| Width of the arrows.
|
| labels_off : bool, default: False
| Disables the label text when ``True``.
|
| Returns
| -------
| vtk.vtkAxesActor
| Actor of the axes.
|
| Examples
| --------
| >>> import pyvista
| >>> pl = pyvista.Plotter()
| >>> _ = pl.add_mesh(pyvista.Sphere(center=(2, 0, 0)), color='r')
| >>> _ = pl.add_mesh(pyvista.Sphere(center=(0, 2, 0)), color='g')
| >>> _ = pl.add_mesh(pyvista.Sphere(center=(0, 0, 2)), color='b')
| >>> _ = pl.add_axes_at_origin()
| >>> pl.show()
|
| add_background_image(self, image_path, scale=1.0, auto_resize=True, as_global=True)
| Add a background image to a plot.
|
| Parameters
| ----------
| image_path : str
| Path to an image file.
|
| scale : float, default: 1.0
| Scale the image larger or smaller relative to the size of
| the window. For example, a scale size of 2 will make the
| largest dimension of the image twice as large as the
| largest dimension of the render window.
|
| auto_resize : bool, default: True
| Resize the background when the render window changes size.
|
| as_global : bool, default: True
| When multiple render windows are present, setting
| ``as_global=False`` will cause the background to only
| appear in one window.
|
| Examples
| --------
| >>> import pyvista
| >>> from pyvista import examples
| >>> plotter = pyvista.Plotter()
| >>> actor = plotter.add_mesh(pyvista.Sphere())
| >>> plotter.add_background_image(examples.mapfile)
| >>> plotter.show()
|
| add_blurring(self)
| Add blurring.
|
| This can be added several times to increase the degree of blurring.
|
| Examples
| --------
| Add two blurring passes to the plotter and show it.
|
| >>> import pyvista as pv
| >>> pl = pv.Plotter()
| >>> _ = pl.add_mesh(pv.Sphere(), show_edges=True)
| >>> pl.add_blurring()
| >>> pl.add_blurring()
| >>> pl.show()
|
| See :ref:`blur_example` for a full example using this method.
|
| add_bounding_box(self, color='grey', corner_factor=0.5, line_width=None, opacity=1.0, render_lines_as_tubes=False, lighting=None, reset_camera=None, outline=True, culling='front')
| Add an unlabeled and unticked box at the boundaries of plot.
|
| Useful for when wanting to plot outer grids while still
| retaining all edges of the boundary.
|
| Parameters
| ----------
| color : ColorLike, default: "grey"
| Color of all labels and axis titles. Default white.
| Either a string, rgb sequence, or hex color string. For
| example:
|
| * ``color='white'``
| * ``color='w'``
| * ``color=[1.0, 1.0, 1.0]``
| * ``color='#FFFFFF'``
|
| corner_factor : float, default: 0.5
| This is the factor along each axis to draw the default
| box. Default is 0.5 to show the full box.
|
| line_width : float, optional
| Thickness of lines.
|
| opacity : float, default: 1.0
| Opacity of mesh. Should be between 0 and 1.
|
| render_lines_as_tubes : bool, default: False
| Show lines as thick tubes rather than flat lines. Control
| the width with ``line_width``.
|
| lighting : bool, optional
| Enable or disable directional lighting for this actor.
|
| reset_camera : bool, optional
| Reset camera position when ``True`` to include all actors.
|
| outline : bool, default: True
| Default is ``True``. when ``False``, a box with faces is
| shown with the specified culling.
|
| culling : str, default: "front"
| Does not render faces on the bounding box that are culled. Options
| are ``'front'`` or ``'back'``.
|
| Returns
| -------
| vtk.vtkActor
| VTK actor of the bounding box.
|
| Examples
| --------
| >>> import pyvista
| >>> pl = pyvista.Plotter()
| >>> _ = pl.add_mesh(pyvista.Sphere())
| >>> _ = pl.add_bounding_box(line_width=5, color='black')
| >>> pl.show()
|
| add_chart(self, chart, *charts)
| Add a chart to this renderer.
|
| Parameters
| ----------
| chart : Chart
| Chart to add to renderer.
|
| *charts : Chart
| Charts to add to renderer.
|
| Examples
| --------
| >>> import pyvista
| >>> chart = pyvista.Chart2D()
| >>> _ = chart.plot(range(10), range(10))
| >>> pl = pyvista.Plotter()
| >>> pl.add_chart(chart)
| >>> pl.show()
|
| add_composite(self, dataset, color=None, style=None, scalars=None, clim=None, show_edges=None, edge_color=None, point_size=None, line_width=None, opacity=1.0, flip_scalars=False, lighting=None, n_colors=256, interpolate_before_map=True, cmap=None, label=None, reset_camera=None, scalar_bar_args=None, show_scalar_bar=None, multi_colors=False, name=None, render_points_as_spheres=None, render_lines_as_tubes=None, smooth_shading=None, split_sharp_edges=None, ambient=None, diffuse=None, specular=None, specular_power=None, nan_color=None, nan_opacity=1.0, culling=None, rgb=None, categories=None, below_color=None, above_color=None, annotations=None, pickable=True, preference='point', log_scale=False, pbr=None, metallic=None, roughness=None, render=True, component=None, color_missing_with_nan=False, copy_mesh=False, show_vertices=None, **kwargs)
| Add a composite dataset to the plotter.
|
| Parameters
| ----------
| dataset : pyvista.MultiBlock
| A :class:`pyvista.MultiBlock` dataset.
|
| color : ColorLike, default: :attr:`pyvista.plotting.themes.Theme.color`
| Use to make the entire mesh have a single solid color.
| Either a string, RGB list, or hex color string. For example:
| ``color='white'``, ``color='w'``, ``color=[1.0, 1.0, 1.0]``, or
| ``color='#FFFFFF'``. Color will be overridden if scalars are
| specified. To color each element of the composite dataset
| individually, you will need to iteratively call ``add_mesh`` for
| each sub-dataset.
|
| style : str, default: 'wireframe'
| Visualization style of the mesh. One of the following:
| ``style='surface'``, ``style='wireframe'``, ``style='points'``.
| Defaults to ``'surface'``. Note that ``'wireframe'`` only shows a
| wireframe of the outer geometry.
|
| scalars : str, optional
| Scalars used to "color" the points or cells of the dataset.
| Accepts only a string name of an array that is present on the
| composite dataset.
|
| clim : sequence[float], optional
| Two item color bar range for scalars. Defaults to minimum and
| maximum of scalars array. Example: ``[-1, 2]``. ``rng`` is
| also an accepted alias for this.
|
| show_edges : bool, default: :attr:`pyvista.global_theme.show_edges <pyvista.plotting.themes.Theme.show_edges>`
| Shows the edges of a mesh. Does not apply to a wireframe
| representation.
|
| edge_color : ColorLike, default: :attr:`pyvista.global_theme.edge_color <pyvista.plotting.themes.Theme.edge_color>`
| The solid color to give the edges when ``show_edges=True``.
| Either a string, RGB list, or hex color string.
|
| Defaults to :attr:`pyvista.global_theme.edge_color
| <pyvista.plotting.themes.Theme.edge_color>`.
|
| point_size : float, default: 5.0
| Point size of any points in the dataset plotted. Also
| applicable when style='points'. Default ``5.0``.
|
| line_width : float, optional
| Thickness of lines. Only valid for wireframe and surface
| representations.
|
| opacity : float, default: 1.0
| Opacity of the mesh. A single float value that will be applied
| globally opacity of the mesh and uniformly
| applied everywhere - should be between 0 and 1.
|
| flip_scalars : bool, default: False
| Flip direction of cmap. Most colormaps allow ``*_r``
| suffix to do this as well.
|
| lighting : bool, default: True
| Enable or disable view direction lighting.
|
| n_colors : int, default: 256
| Number of colors to use when displaying scalars. The scalar bar
| will also have this many colors.
|
| interpolate_before_map : bool, default: True
| Enabling makes for a smoother scalars display. When ``False``,
| OpenGL will interpolate the mapped colors which can result in
| showing colors that are not present in the color map.
|
| cmap : str | list, | pyvista.LookupTable, default: :attr:`pyvista.plotting.themes.Theme.cmap`
| If a string, this is the name of the ``matplotlib`` colormap to use
| when mapping the ``scalars``. See available Matplotlib colormaps.
| Only applicable for when displaying ``scalars``.
| ``colormap`` is also an accepted alias
| for this. If ``colorcet`` or ``cmocean`` are installed, their
| colormaps can be specified by name.
|
| You can also specify a list of colors to override an existing
| colormap with a custom one. For example, to create a three color
| colormap you might specify ``['green', 'red', 'blue']``.
|
| This parameter also accepts a :class:`pyvista.LookupTable`. If this
| is set, all parameters controlling the color map like ``n_colors``
| will be ignored.
|
| label : str, optional
| String label to use when adding a legend to the scene with
| :func:`pyvista.Plotter.add_legend`.
|
| reset_camera : bool, optional
| Reset the camera after adding this mesh to the scene. The default
| setting is ``None``, where the camera is only reset if this plotter
| has already been shown. If ``False``, the camera is not reset
| regardless of the state of the ``Plotter``. When ``True``, the
| camera is always reset.
|
| scalar_bar_args : dict, optional
| Dictionary of keyword arguments to pass when adding the
| scalar bar to the scene. For options, see
| :func:`pyvista.Plotter.add_scalar_bar`.
|
| show_scalar_bar : bool
| If ``False``, a scalar bar will not be added to the
| scene. Defaults to ``True`` unless ``rgba=True``.
|
| multi_colors : bool, default: False
| Color each block by a solid color using matplotlib's color cycler.
|
| name : str, optional
| The name for the added mesh/actor so that it can be easily
| updated. If an actor of this name already exists in the
| rendering window, it will be replaced by the new actor.
|
| render_points_as_spheres : bool, default: False
| Render points as spheres rather than dots.
|
| render_lines_as_tubes : bool, default: False
| Show lines as thick tubes rather than flat lines. Control
| the width with ``line_width``.
|
| smooth_shading : bool, default: :attr`pyvista.plotting.themes.Theme.smooth_shading`
| Enable smooth shading when ``True`` using the Phong shading
| algorithm. When ``False``, uses flat shading. Automatically
| enabled when ``pbr=True``. See :ref:`shading_example`.
|
| split_sharp_edges : bool, default: False
| Split sharp edges exceeding 30 degrees when plotting with smooth
| shading. Control the angle with the optional keyword argument
| ``feature_angle``. By default this is ``False`` unless overridden
| by the global or plotter theme. Note that enabling this will
| create a copy of the input mesh within the plotter. See
| :ref:`shading_example`.
|
| ambient : float, default: 0.0
| When lighting is enabled, this is the amount of light in
| the range of 0 to 1 (default 0.0) that reaches the actor
| when not directed at the light source emitted from the
| viewer.
|
| diffuse : float, default: 1.0
| The diffuse lighting coefficient.
|
| specular : float, default: 0.0
| The specular lighting coefficient.
|
| specular_power : float, default: 1.0
| The specular power. Between 0.0 and 128.0.
|
| nan_color : ColorLike, default: :attr:`pyvista.plotting.themes.Theme.nan_color`
| The color to use for all ``NaN`` values in the plotted
| scalar array.
|
| nan_opacity : float, default: 1.0
| Opacity of ``NaN`` values. Should be between 0 and 1.
|
| culling : str, bool, default: False
| Does not render faces that are culled. This can be helpful for
| dense surface meshes, especially when edges are visible, but can
| cause flat meshes to be partially displayed. One of the following:
|
| * ``True`` - Enable backface culling
| * ``"b"`` - Enable backface culling
| * ``"back"`` - Enable backface culling
| * ``"backface"`` - Enable backface culling
| * ``"f"`` - Enable frontface culling
| * ``"front"`` - Enable frontface culling
| * ``"frontface"`` - Enable frontface culling
| * ``False`` - Disable both backface and frontface culling
|
| rgb : bool, default: False
| If an 2 dimensional array is passed as the scalars, plot
| those values as RGB(A) colors. ``rgba`` is also an
| accepted alias for this. Opacity (the A) is optional. If
| a scalars array ending with ``"_rgba"`` is passed, the default
| becomes ``True``. This can be overridden by setting this
| parameter to ``False``.
|
| categories : bool, optional
| If set to ``True``, then the number of unique values in
| the scalar array will be used as the ``n_colors``
| argument.
|
| .. deprecated:: 0.39.0
| This keyword argument is no longer used. Instead, use
| ``n_colors``.
|
| below_color : ColorLike, optional
| Solid color for values below the scalars range
| (``clim``). This will automatically set the scalar bar
| ``below_label`` to ``'below'``.
|
| above_color : ColorLike, optional
| Solid color for values below the scalars range
| (``clim``). This will automatically set the scalar bar
| ``above_label`` to ``'above'``.
|
| annotations : dict, optional
| Pass a dictionary of annotations. Keys are the float
| values in the scalars range to annotate on the scalar bar
| and the values are the string annotations.
|
| pickable : bool, default: True
| Set whether this actor is pickable.
|
| preference : str, default: 'point'
| For each block, when ``block.n_points == block.n_cells`` and
| setting scalars, this parameter sets how the scalars will be mapped
| to the mesh. For example, when ``'point'`` the scalars will be
| associated with the mesh points if available. Can be either
| ``'point'`` or ``'cell'``.
|
| log_scale : bool, default: False
| Use log scale when mapping data to colors. Scalars less
| than zero are mapped to the smallest representable
| positive float.
|
| pbr : bool, default: False
| Enable physics based rendering (PBR) if the mesh is
| ``PolyData``. Use the ``color`` argument to set the base
| color.
|
| metallic : float, default: 0.0
| Usually this value is either 0 or 1 for a real material
| but any value in between is valid. This parameter is only
| used by PBR interpolation.
|
| roughness : float, default: 0.5
| This value has to be between 0 (glossy) and 1 (rough). A
| glossy material has reflections and a high specular
| part. This parameter is only used by PBR
| interpolation.
|
| render : bool, default: True
| Force a render when ``True``.
|
| component : int, optional
| Set component of vector valued scalars to plot. Must be
| nonnegative, if supplied. If ``None``, the magnitude of
| the vector is plotted.
|
| color_missing_with_nan : bool, default: False
| Color any missing values with the ``nan_color``. This is useful
| when not all blocks of the composite dataset have the specified
| ``scalars``.
|
| copy_mesh : bool, default: False
| If ``True``, a copy of the mesh will be made before adding it to
| the plotter. This is useful if e.g. you would like to add the same
| mesh to a plotter multiple times and display different
| scalars. Setting ``copy_mesh`` to ``False`` is necessary if you
| would like to update the mesh after adding it to the plotter and
| have these updates rendered, e.g. by changing the active scalars or
| through an interactive widget.
|
| show_vertices : bool, optional
| When ``style`` is not ``'points'``, render the external surface
| vertices. The following optional keyword arguments may be used to
| control the style of the vertices:
|
| * ``vertex_color`` - The color of the vertices
| * ``vertex_style`` - Change style to ``'points_gaussian'``
| * ``vertex_opacity`` - Control the opacity of the vertices
|
| **kwargs : dict, optional
| Optional keyword arguments.
|
| Returns
| -------
| pyvista.Actor
| Actor of the composite dataset.
|
| pyvista.CompositePolyDataMapper
| Composite PolyData mapper.
|
| Examples
| --------
| Add a sphere and a cube as a multiblock dataset to a plotter and then
| change the visibility and color of the blocks.
|
| Note index ``1`` and ``2`` are used to access the individual blocks of
| the composite dataset. This is because the :class:`pyvista.MultiBlock`
| is the root node of the "tree" and is index ``0``. This allows you to
| access individual blocks or the entire composite dataset itself in the
| case of multiple nested composite datasets.
|
| >>> import pyvista as pv
| >>> dataset = pv.MultiBlock(
| ... [pv.Cube(), pv.Sphere(center=(0, 0, 1))]
| ... )
| >>> pl = pv.Plotter()
| >>> actor, mapper = pl.add_composite(dataset)
| >>> mapper.block_attr[1].color = 'b'
| >>> mapper.block_attr[1].opacity = 0.5
| >>> mapper.block_attr[2].color = 'r'
| >>> pl.show()
|
| add_floor(self, face='-z', i_resolution=10, j_resolution=10, color=None, line_width=None, opacity=1.0, show_edges=False, lighting=False, edge_color=None, reset_camera=None, pad=0.0, offset=0.0, pickable=False, store_floor_kwargs=True)
| Show a floor mesh.
|
| This generates planes at the boundaries of the scene to behave
| like floors or walls.
|
| Parameters
| ----------
| face : str, default: "-z"
| The face at which to place the plane. Options are
| (``'-z'``, ``'-y'``, ``'-x'``, ``'+z'``, ``'+y'``, and
| ``'+z'``). Where the ``-/+`` sign indicates on which side of
| the axis the plane will lie. For example, ``'-z'`` would
| generate a floor on the XY-plane and the bottom of the
| scene (minimum z).
|
| i_resolution : int, default: 10
| Number of points on the plane in the i direction.
|
| j_resolution : int, default: 10
| Number of points on the plane in the j direction.
|
| color : ColorLike, optional
| Color of all labels and axis titles. Default gray.
| Either a string, rgb list, or hex color string.
|
| line_width : int, optional
| Thickness of the edges. Only if ``show_edges`` is
| ``True``.
|
| opacity : float, default: 1.0
| The opacity of the generated surface.
|
| show_edges : bool, default: False
| Flag on whether to show the mesh edges for tiling.
|
| line_width : float, default: False
| Thickness of lines. Only valid for wireframe and surface
| representations.
|
| lighting : bool, default: False
| Enable or disable view direction lighting.
|
| edge_color : ColorLike, optional
| Color of the edges of the mesh.
|
| reset_camera : bool, optional
| Resets the camera when ``True`` after adding the floor.
|
| pad : float, default: 0.0
| Percentage padding between 0 and 1.
|
| offset : float, default: 0.0
| Percentage offset along plane normal.
|
| pickable : bool, default: false
| Make this floor actor pickable in the renderer.
|
| store_floor_kwargs : bool, default: True
| Stores the keyword arguments used when adding this floor.
| Useful when updating the bounds and regenerating the
| floor.
|
| Returns
| -------
| vtk.vtkActor
| VTK actor of the floor.
|
| Examples
| --------
| Add a floor below a sphere and plot it.
|
| >>> import pyvista
| >>> pl = pyvista.Plotter()
| >>> actor = pl.add_mesh(pyvista.Sphere())
| >>> actor = pl.add_floor()
| >>> pl.show()
|
| add_key_event(self, key, callback)
| Add a function to callback when the given key is pressed.
|
| These are non-unique - thus a key could map to many callback
| functions. The callback function must not have any arguments.
|
| Parameters
| ----------
| key : str
| The key to trigger the event.
|
| callback : callable
| A callable that takes no arguments (keyword arguments are allowed).
|
| add_legend(self, labels=None, bcolor=(0.5, 0.5, 0.5), border=False, size=(0.2, 0.2), name=None, loc='upper right', face='triangle')
| Add a legend to render window.
|
| Entries must be a list containing one string and color entry for each
| item.
|
| Parameters
| ----------
| labels : list, optional
| When set to ``None``, uses existing labels as specified by
|
| - :func:`add_mesh <Plotter.add_mesh>`
| - :func:`add_lines <Plotter.add_lines>`
| - :func:`add_points <Plotter.add_points>`
|
| List containing one entry for each item to be added to the
| legend. Each entry must contain two strings, [label,
| color], where label is the name of the item to add, and
| color is the color of the label to add.
|
| bcolor : ColorLike, default: (0.5, 0.5, 0.5)
| Background color, either a three item 0 to 1 RGB color
| list, or a matplotlib color string (e.g. ``'w'`` or ``'white'``
| for a white color). If None, legend background is
| disabled.
|
| border : bool, default: False
| Controls if there will be a border around the legend.
| Default False.
|
| size : sequence[float], default: (0.2, 0.2)
| Two float sequence, each float between 0 and 1. For example
| ``(0.1, 0.1)`` would make the legend 10% the size of the
| entire figure window.
|
| name : str, optional
| The name for the added actor so that it can be easily
| updated. If an actor of this name already exists in the
| rendering window, it will be replaced by the new actor.
|
| loc : str, default: "upper right"
| Location string. One of the following:
|
| * ``'upper right'``
| * ``'upper left'``
| * ``'lower left'``
| * ``'lower right'``
| * ``'center left'``
| * ``'center right'``
| * ``'lower center'``
| * ``'upper center'``
| * ``'center'``
|
| face : str | pyvista.PolyData | NoneType, default: "triangle"
| Face shape of legend face. One of the following:
|
| * None: ``None``
| * Line: ``"-"`` or ``"line"``
| * Triangle: ``"^"`` or ``'triangle'``
| * Circle: ``"o"`` or ``'circle'``
| * Rectangle: ``"r"`` or ``'rectangle'``
| * Custom: :class:`pyvista.PolyData`
|
| Passing ``None`` removes the legend face. A custom face can be
| created using :class:`pyvista.PolyData`. This will be rendered
| from the XY plane.
|
| Returns
| -------
| vtk.vtkLegendBoxActor
| Actor for the legend.
|
| Examples
| --------
| Create a legend by labeling the meshes when using ``add_mesh``
|
| >>> import pyvista
| >>> from pyvista import examples
| >>> sphere = pyvista.Sphere(center=(0, 0, 1))
| >>> cube = pyvista.Cube()
| >>> plotter = pyvista.Plotter()
| >>> _ = plotter.add_mesh(
| ... sphere, 'grey', smooth_shading=True, label='Sphere'
| ... )
| >>> _ = plotter.add_mesh(cube, 'r', label='Cube')
| >>> _ = plotter.add_legend(bcolor='w', face=None)
| >>> plotter.show()
|
| Alternatively provide labels in the plotter.
|
| >>> plotter = pyvista.Plotter()
| >>> _ = plotter.add_mesh(sphere, 'grey', smooth_shading=True)
| >>> _ = plotter.add_mesh(cube, 'r')
| >>> legend_entries = []
| >>> legend_entries.append(['My Mesh', 'w'])
| >>> legend_entries.append(['My Other Mesh', 'k'])
| >>> _ = plotter.add_legend(legend_entries)
| >>> plotter.show()
|
| add_legend_scale(self, corner_offset_factor=2.0, bottom_border_offset=30, top_border_offset=30, left_border_offset=30, right_border_offset=30, bottom_axis_visibility=True, top_axis_visibility=True, left_axis_visibility=True, right_axis_visibility=True, legend_visibility=True, xy_label_mode=False, render=True, color=None, font_size_factor=0.6, label_size_factor=1.0, label_format=None, number_minor_ticks=0, tick_length=5, minor_tick_length=3, show_ticks=True, tick_label_offset=2)
| Annotate the render window with scale and distance information.
|
| Its basic goal is to provide an indication of the scale of the scene.
| Four axes surrounding the render window indicate (in a variety of ways)
| the scale of what the camera is viewing. An option also exists for
| displaying a scale legend.
|
| Parameters
| ----------
| corner_offset_factor : float, default: 2.0
| The corner offset value.
|
| bottom_border_offset : int, default: 30
| Bottom border offset. Recommended value ``50``.
|
| top_border_offset : int, default: 30
| Top border offset. Recommended value ``50``.
|
| left_border_offset : int, default: 30
| Left border offset. Recommended value ``100``.
|
| right_border_offset : int, default: 30
| Right border offset. Recommended value ``100``.
|
| bottom_axis_visibility : bool, default: True
| Whether the bottom axis is visible.
|
| top_axis_visibility : bool, default: True
| Whether the top axis is visible.
|
| left_axis_visibility : bool, default: True
| Whether the left axis is visible.
|
| right_axis_visibility : bool, default: True
| Whether the right axis is visible.
|
| legend_visibility : bool, default: True
| Whether the legend scale is visible.
|
| xy_label_mode : bool, default: False
| The axes can be programmed either to display distance scales
| or x-y coordinate values. By default,
| the scales display a distance. However, if you know that the
| view is down the z-axis, the scales can be programmed to display
| x-y coordinate values.
|
| render : bool, default: True
| Whether to render when the actor is added.
|
| color : ColorLike, optional
| Either a string, rgb list, or hex color string for tick text
| and tick line colors.
|
| .. warning::
| The axis labels tend to be either white or black.
|
| font_size_factor : float, default: 0.6
| Factor to scale font size overall.
|
| label_size_factor : float, default: 1.0
| Factor to scale label size relative to title size.
|
| label_format : str, optional
| A printf style format for labels, e.g. ``'%E'``.
| See :ref:`old-string-formatting`.
|
| number_minor_ticks : int, default: 0
| Number of minor ticks between major ticks.
|
| tick_length : int, default: 5
| Length of ticks in pixels.
|
| minor_tick_length : int, default: 3
| Length of minor ticks in pixels.
|
| show_ticks : bool, default: True
| Whether to show the ticks.
|
| tick_label_offset : int, default: 2
| Offset between tick and label in pixels.
|
| Returns
| -------
| vtk.vtkActor
| The actor for the added ``vtkLegendScaleActor``.
|
| Warnings
| --------
| Please be aware that the axes and scale values are subject to perspective
| effects. The distances are computed in the focal plane of the camera. When
| there are large view angles (i.e., perspective projection), the computed
| distances may provide users the wrong sense of scale. These effects are not
| present when parallel projection is enabled.
|
| Examples
| --------
| >>> import pyvista as pv
| >>> cone = pv.Cone(height=2.0, radius=0.5)
| >>> pl = pv.Plotter()
| >>> _ = pl.add_mesh(cone)
| >>> _ = pl.add_legend_scale()
| >>> pl.show()
|
| add_light(self, light, only_active=False)
| Add a Light to the scene.
|
| Parameters
| ----------
| light : Light or vtkLight
| The light to be added.
|
| only_active : bool, default: False
| If ``True``, only add the light to the active
| renderer. The default is that every renderer adds the
| light. To add the light to an arbitrary renderer, see
| :func:`pyvista.Renderer.add_light`.
|
| Examples
| --------
| Create a plotter that we initialize with no lights, and add a
| cube and a single headlight to it.
|
| >>> import pyvista as pv
| >>> plotter = pv.Plotter(lighting='none')
| >>> _ = plotter.add_mesh(pv.Cube())
| >>> light = pv.Light(color='cyan', light_type='headlight')
| >>> plotter.add_light(light)
| >>> plotter.show()
|
| add_lines(self, lines, color='w', width=5, label=None, name=None, connected=False)
| Add lines to the plotting object.
|
| Parameters
| ----------
| lines : np.ndarray
| Points representing line segments. For example, two line
| segments would be represented as ``np.array([[0, 1, 0],
| [1, 0, 0], [1, 1, 0], [2, 0, 0]])``.
|
| color : ColorLike, default: 'w'
| Either a string, rgb list, or hex color string. For example:
|
| * ``color='white'``
| * ``color='w'``
| * ``color=[1.0, 1.0, 1.0]``
| * ``color='#FFFFFF'``
|
| width : float, default: 5
| Thickness of lines.
|
| label : str, default: None
| String label to use when adding a legend to the scene with
| :func:`pyvista.Plotter.add_legend`.
|
| name : str, default: None
| The name for the added actor so that it can be easily updated.
| If an actor of this name already exists in the rendering window, it
| will be replaced by the new actor.
|
| connected : bool, default: False
| Treat ``lines`` as points representing a series of *connected* lines.
| For example, two connected line segments would be represented as
| ``np.array([[0, 0, 0], [1, 0, 0], [1, 1, 0]])``. If ``False``, an *even*
| number of points must be passed to ``lines``, and the lines need not be
| connected.
|
|
| Returns
| -------
| vtk.vtkActor
| Lines actor.
|
| Examples
| --------
| Plot two lines.
|
| >>> import numpy as np
| >>> import pyvista
| >>> pl = pyvista.Plotter()
| >>> points = np.array([[0, 1, 0], [1, 0, 0], [1, 1, 0], [2, 0, 0]])
| >>> actor = pl.add_lines(points, color='purple', width=3)
| >>> pl.camera_position = 'xy'
| >>> pl.show()
|
| Adding lines with ``connected=True`` will add a series of connected
| line segments.
|
| >>> pl = pyvista.Plotter()
| >>> points = np.array([[0, 1, 0], [1, 0, 0], [1, 1, 0], [2, 0, 0]])
| >>> actor = pl.add_lines(
| ... points, color='purple', width=3, connected=True
| ... )
| >>> pl.camera_position = 'xy'
| >>> pl.show()
|
| add_on_render_callback(self, callback, render_event=False)
| Add a method to be called post-render.
|
| Parameters
| ----------
| callback : callable
| The callback method to run post-render. This takes a single
| argument which is the plotter object.
|
| render_event : bool, default: False
| If ``True``, associate with all VTK RenderEvents. Otherwise, the
| callback is only handled on a successful ``render()`` from the
| PyVista plotter directly.
|
| add_orientation_widget(self, actor, interactive=None, color=None, opacity=1.0, viewport=None)
| Use the given actor in an orientation marker widget.
|
| Color and opacity are only valid arguments if a mesh is passed.
|
| Parameters
| ----------
| actor : vtk.vtkActor | pyvista.DataSet
| The mesh or actor to use as the marker.
|
| interactive : bool, optional
| Control if the orientation widget is interactive. By
| default uses the value from
| :attr:`pyvista.global_theme.interactive
| <pyvista.plotting.themes.Theme.interactive>`.
|
| color : ColorLike, optional
| The color of the actor. This only applies if ``actor`` is
| a :class:`pyvista.DataSet`.
|
| opacity : int | float, default: 1.0
| Opacity of the marker.
|
| viewport : sequence[float], optional
| Viewport ``(xstart, ystart, xend, yend)`` of the widget.
|
| Returns
| -------
| vtk.vtkOrientationMarkerWidget
| Orientation marker widget.
|
| Examples
| --------
| Use an Arrow as the orientation widget.
|
| >>> import pyvista
| >>> pl = pyvista.Plotter()
| >>> actor = pl.add_mesh(pyvista.Cube(), show_edges=True)
| >>> actor = pl.add_orientation_widget(pyvista.Arrow(), color='r')
| >>> pl.show()
|
| add_point_labels(self, points, labels, italic=False, bold=True, font_size=None, text_color=None, font_family=None, shadow=False, show_points=True, point_color=None, point_size=None, name=None, shape_color='grey', shape='rounded_rect', fill_shape=True, margin=3, shape_opacity=1.0, pickable=False, render_points_as_spheres=False, tolerance=0.001, reset_camera=None, always_visible=False, render=True)
| Create a point actor with one label from list labels assigned to each point.
|
| Parameters
| ----------
| points : sequence | pyvista.DataSet | vtk.vtkAlgorithm
| An ``n x 3`` sequence points or :class:`pyvista.DataSet` with
| points or mesh-producing algorithm.
|
| labels : list | str
| List of labels. Must be the same length as points. If a
| string name is given with a :class:`pyvista.DataSet` input for
| points, then these are fetched.
|
| italic : bool, default: False
| Italicises title and bar labels.
|
| bold : bool, default: True
| Bolds title and bar labels.
|
| font_size : float, optional
| Sets the size of the title font.
|
| text_color : ColorLike, optional
| Color of text. Either a string, RGB sequence, or hex color string.
|
| * ``text_color='white'``
| * ``text_color='w'``
| * ``text_color=[1.0, 1.0, 1.0]``
| * ``text_color='#FFFFFF'``
|
| font_family : str, optional
| Font family. Must be either ``'courier'``, ``'times'``,
| or ``'arial``.
|
| shadow : bool, default: False
| Adds a black shadow to the text.
|
| show_points : bool, default: True
| Controls if points are visible.
|
| point_color : ColorLike, optional
| Either a string, rgb list, or hex color string. One of
| the following.
|
| * ``point_color='white'``
| * ``point_color='w'``
| * ``point_color=[1.0, 1.0, 1.0]``
| * ``point_color='#FFFFFF'``
|
| point_size : float, optional
| Size of points if visible.
|
| name : str, optional
| The name for the added actor so that it can be easily
| updated. If an actor of this name already exists in the
| rendering window, it will be replaced by the new actor.
|
| shape_color : ColorLike, default: "grey"
| Color of shape (if visible). Either a string, rgb
| sequence, or hex color string.
|
| shape : str, default: "rounded_rect"
| The string name of the shape to use. Options are ``'rect'`` or
| ``'rounded_rect'``. If you want no shape, pass ``None``.
|
| fill_shape : bool, default: True
| Fill the shape with the ``shape_color``. Outlines if ``False``.
|
| margin : int, default: 3
| The size of the margin on the label background shape.
|
| shape_opacity : float, default: 1.0
| The opacity of the shape in the range of ``[0, 1]``.
|
| pickable : bool, default: False
| Set whether this actor is pickable.
|
| render_points_as_spheres : bool, default: False
| Render points as spheres rather than dots.
|
| tolerance : float, default: 0.001
| A tolerance to use to determine whether a point label is
| visible. A tolerance is usually required because the
| conversion from world space to display space during
| rendering introduces numerical round-off.
|
| reset_camera : bool, optional
| Reset the camera after adding the points to the scene.
|
| always_visible : bool, default: False
| Skip adding the visibility filter.
|
| render : bool, default: True
| Force a render when ``True``.
|
| Returns
| -------
| vtk.vtkActor2D
| VTK label actor. Can be used to change properties of the labels.
|
| Examples
| --------
| >>> import numpy as np
| >>> import pyvista
| >>> pl = pyvista.Plotter()
| >>> points = np.array(
| ... [[0.0, 0.0, 0.0], [1.0, 1.0, 0.0], [2.0, 0.0, 0.0]]
| ... )
| >>> labels = ['Point A', 'Point B', 'Point C']
| >>> actor = pl.add_point_labels(
| ... points,
| ... labels,
| ... italic=True,
| ... font_size=20,
| ... point_color='red',
| ... point_size=20,
| ... render_points_as_spheres=True,
| ... always_visible=True,
| ... shadow=True,
| ... )
| >>> pl.camera_position = 'xy'
| >>> pl.show()
|
| add_point_scalar_labels(self, points, labels, fmt=None, preamble='', **kwargs)
| Label the points from a dataset with the values of their scalars.
|
| Wrapper for :func:`pyvista.Plotter.add_point_labels`.
|
| Parameters
| ----------
| points : sequence[float] | np.ndarray | pyvista.DataSet
| An ``n x 3`` numpy.ndarray or pyvista dataset with points.
|
| labels : list | str
| List of scalars of labels. Must be the same length as points. If a
| string name is given with a :class:`pyvista.DataSet` input for
| points, then these are fetched.
|
| fmt : str, optional
| String formatter used to format numerical data.
|
| preamble : str, default: ""
| Text before the start of each label.
|
| **kwargs : dict, optional
| Keyword arguments passed to
| :func:`pyvista.Plotter.add_point_labels`.
|
| Returns
| -------
| vtk.vtkActor2D
| VTK label actor. Can be used to change properties of the labels.
|
| add_points(self, points, style='points', **kwargs)
| Add points to a mesh.
|
| Parameters
| ----------
| points : numpy.ndarray or pyvista.DataSet
| Array of points or the points from a pyvista object.
|
| style : str, default: 'points'
| Visualization style of the mesh. One of the following:
| ``style='points'``, ``style='points_gaussian'``.
| ``'points_gaussian'`` can be controlled with the ``emissive`` and
| ``render_points_as_spheres`` options.
|
| **kwargs : dict, optional
| See :func:`pyvista.Plotter.add_mesh` for optional
| keyword arguments.
|
| Returns
| -------
| pyvista.Actor
| Actor of the mesh.
|
| Examples
| --------
| Add a numpy array of points to a mesh.
|
| >>> import numpy as np
| >>> import pyvista
| >>> points = np.random.random((10, 3))
| >>> pl = pyvista.Plotter()
| >>> actor = pl.add_points(
| ... points, render_points_as_spheres=True, point_size=100.0
| ... )
| >>> pl.show()
|
| Plot using the ``'points_gaussian'`` style
|
| >>> points = np.random.random((10, 3))
| >>> pl = pyvista.Plotter()
| >>> actor = pl.add_points(points, style='points_gaussian')
| >>> pl.show()
|
| add_ruler(self, pointa, pointb, flip_range=False, number_labels=5, show_labels=True, font_size_factor=0.6, label_size_factor=1.0, label_format=None, title='Distance', number_minor_ticks=0, tick_length=5, minor_tick_length=3, show_ticks=True, tick_label_offset=2, label_color=None, tick_color=None)
| Add ruler.
|
| The ruler is a 2D object that is not occluded by 3D objects.
| To avoid issues with perspective, it is recommended to use
| parallel projection, i.e. :func:`Plotter.enable_parallel_projection`,
| and place the ruler orthogonal to the viewing direction.
|
| The title and labels are placed to the right of ruler moving from
| ``pointa`` to ``pointb``. Use ``flip_range`` to flip the ``0`` location,
| if needed.
|
| Since the ruler is placed in an overlay on the viewing scene, the camera
| does not automatically reset to include the ruler in the view.
|
| Parameters
| ----------
| pointa : sequence[float]
| Starting point for ruler.
|
| pointb : sequence[float]
| Ending point for ruler.
|
| flip_range : bool, default: False
| If ``True``, the distance range goes from ``pointb`` to ``pointa``.
|
| number_labels : int, default: 5
| Number of labels to place on ruler.
|
| show_labels : bool, default: True
| Whether to show labels.
|
| font_size_factor : float, default: 0.6
| Factor to scale font size overall.
|
| label_size_factor : float, default: 1.0
| Factor to scale label size relative to title size.
|
| label_format : str, optional
| A printf style format for labels, e.g. '%E'.
|
| title : str, default: "Distance"
| The title to display.
|
| number_minor_ticks : int, default: 0
| Number of minor ticks between major ticks.
|
| tick_length : int, default: 5
| Length of ticks in pixels.
|
| minor_tick_length : int, default: 3
| Length of minor ticks in pixels.
|
| show_ticks : bool, default: True
| Whether to show the ticks.
|
| tick_label_offset : int, default: 2
| Offset between tick and label in pixels.
|
| label_color : ColorLike, optional
| Either a string, rgb list, or hex color string for
| label and title colors.
|
| .. warning::
| This is either white or black.
|
| tick_color : ColorLike, optional
| Either a string, rgb list, or hex color string for
| tick line colors.
|
| Returns
| -------
| vtk.vtkActor
| VTK actor of the ruler.
|
| Examples
| --------
| >>> import pyvista as pv
| >>> cone = pv.Cone(height=2.0, radius=0.5)
| >>> plotter = pv.Plotter()
| >>> _ = plotter.add_mesh(cone)
|
| Measure x direction of cone and place ruler slightly below.
|
| >>> _ = plotter.add_ruler(
| ... pointa=[cone.bounds[0], cone.bounds[2] - 0.1, 0.0],
| ... pointb=[cone.bounds[1], cone.bounds[2] - 0.1, 0.0],
| ... title="X Distance",
| ... )
|
| Measure y direction of cone and place ruler slightly to left.
| The title and labels are placed to the right of the ruler when
| traveling from ``pointa`` to ``pointb``.
|
| >>> _ = plotter.add_ruler(
| ... pointa=[cone.bounds[0] - 0.1, cone.bounds[3], 0.0],
| ... pointb=[cone.bounds[0] - 0.1, cone.bounds[2], 0.0],
| ... flip_range=True,
| ... title="Y Distance",
| ... )
| >>> plotter.enable_parallel_projection()
| >>> plotter.view_xy()
| >>> plotter.show()
|
| add_scalar_bar(self, title='', mapper=None, n_labels=5, italic=False, bold=False, title_font_size=None, label_font_size=None, color=None, font_family=None, shadow=False, width=None, height=None, position_x=None, position_y=None, vertical=None, interactive=None, fmt=None, use_opacity=True, outline=False, nan_annotation=False, below_label=None, above_label=None, background_color=None, n_colors=None, fill=False, render=False, theme=None)
| Create scalar bar using the ranges as set by the last input mesh.
|
| Parameters
| ----------
| title : str, default: ""
| Title of the scalar bar. Default is rendered as an empty title.
|
| mapper : vtkMapper, optional
| Mapper used for the scalar bar. Defaults to the last
| mapper created by the plotter.
|
| n_labels : int, default: 5
| Number of labels to use for the scalar bar.
|
| italic : bool, default: False
| Italicises title and bar labels.
|
| bold : bool, default: False
| Bolds title and bar labels.
|
| title_font_size : float, optional
| Sets the size of the title font. Defaults to ``None`` and is sized
| according to :attr:`pyvista.plotting.themes.Theme.font`.
|
| label_font_size : float, optional
| Sets the size of the title font. Defaults to ``None`` and is sized
| according to :attr:`pyvista.plotting.themes.Theme.font`.
|
| color : ColorLike, optional
| Either a string, rgb list, or hex color string. Default
| set by :attr:`pyvista.plotting.themes.Theme.font`. Can be
| in one of the following formats:
|
| * ``color='white'``
| * ``color='w'``
| * ``color=[1.0, 1.0, 1.0]``
| * ``color='#FFFFFF'``
|
| font_family : {'courier', 'times', 'arial'}
| Font family. Default is set by
| :attr:`pyvista.plotting.themes.Theme.font`.
|
| shadow : bool, default: False
| Adds a black shadow to the text.
|
| width : float, optional
| The percentage (0 to 1) width of the window for the colorbar.
| Default set by
| :attr:`pyvista.plotting.themes.Theme.colorbar_vertical` or
| :attr:`pyvista.plotting.themes.Theme.colorbar_horizontal`
| depending on the value of ``vertical``.
|
| height : float, optional
| The percentage (0 to 1) height of the window for the
| colorbar. Default set by
| :attr:`pyvista.plotting.themes.Theme.colorbar_vertical` or
| :attr:`pyvista.plotting.themes.Theme.colorbar_horizontal`
| depending on the value of ``vertical``.
|
| position_x : float, optional
| The percentage (0 to 1) along the windows's horizontal
| direction to place the bottom left corner of the colorbar.
| Default set by
| :attr:`pyvista.plotting.themes.Theme.colorbar_vertical` or
| :attr:`pyvista.plotting.themes.Theme.colorbar_horizontal`
| depending on the value of ``vertical``.
|
| position_y : float, optional
| The percentage (0 to 1) along the windows's vertical
| direction to place the bottom left corner of the colorbar.
| Default set by
| :attr:`pyvista.plotting.themes.Theme.colorbar_vertical` or
| :attr:`pyvista.plotting.themes.Theme.colorbar_horizontal`
| depending on the value of ``vertical``.
|
| vertical : bool, optional
| Use vertical or horizontal scalar bar. Default set by
| :attr:`pyvista.plotting.themes.Theme.colorbar_orientation`.
|
| interactive : bool, optional
| Use a widget to control the size and location of the scalar bar.
| Default set by :attr:`pyvista.plotting.themes.Theme.interactive`.
|
| fmt : str, optional
| ``printf`` format for labels.
| Default set by :attr:`pyvista.plotting.themes.Theme.font`.
|
| use_opacity : bool, default: True
| Optionally display the opacity mapping on the scalar bar.
|
| outline : bool, default: False
| Optionally outline the scalar bar to make opacity mappings more
| obvious.
|
| nan_annotation : bool, default: False
| Annotate the NaN color.
|
| below_label : str, optional
| String annotation for values below the scalars range.
|
| above_label : str, optional
| String annotation for values above the scalars range.
|
| background_color : ColorLike, optional
| The color used for the background in RGB format.
|
| n_colors : int, optional
| The maximum number of color displayed in the scalar bar.
|
| fill : bool, default: False
| Draw a filled box behind the scalar bar with the
| ``background_color``.
|
| render : bool, default: False
| Force a render when True.
|
| theme : pyvista.plotting.themes.Theme, optional
| Plot-specific theme. By default, calling from the
| ``Plotter``, will use the plotter theme. Setting to
| ``None`` will use the global theme.
|
| Returns
| -------
| vtk.vtkScalarBarActor
| Scalar bar actor.
|
| Notes
| -----
| Setting ``title_font_size``, or ``label_font_size`` disables
| automatic font sizing for both the title and label.
|
| Examples
| --------
| Add a custom interactive scalar bar that is horizontal, has an
| outline, and has a custom formatting.
|
| >>> import pyvista as pv
| >>> sphere = pv.Sphere()
| >>> sphere['Data'] = sphere.points[:, 2]
| >>> plotter = pv.Plotter()
| >>> _ = plotter.add_mesh(sphere, show_scalar_bar=False)
| >>> _ = plotter.add_scalar_bar(
| ... 'Data',
| ... interactive=True,
| ... vertical=False,
| ... title_font_size=35,
| ... label_font_size=30,
| ... outline=True,
| ... fmt='%10.5f',
| ... )
| >>> plotter.show()
|
| add_silhouette(self, mesh, color=None, line_width=None, opacity=None, feature_angle=None, decimate=None, params=None)
| Add a silhouette of a PyVista or VTK dataset to the scene.
|
| A silhouette can also be generated directly in
| :func:`add_mesh <pyvista.Plotter.add_mesh>`. See also
| :ref:`silhouette_example`.
|
| Parameters
| ----------
| mesh : pyvista.DataSet | vtk.vtkAlgorithm
| Mesh or mesh-producing algorithm for generating silhouette
| to plot.
|
| color : ColorLike, optional
| Color of the silhouette lines.
|
| line_width : float, optional
| Silhouette line width.
|
| opacity : float, optional
| Line transparency between ``0`` and ``1``.
|
| feature_angle : float, optional
| If set, display sharp edges exceeding that angle in degrees.
|
| decimate : float, optional
| Level of decimation between ``0`` and ``1``. Decimating will
| improve rendering performance. A good rule of thumb is to
| try ``0.9`` first and decrease until the desired rendering
| performance is achieved.
|
| params : dict, optional
| Optional silhouette parameters.
|
| .. deprecated:: 0.38.0
| This keyword argument is no longer used. Instead, input the
| parameters to this function directly.
|
| Returns
| -------
| pyvista.Actor
| Actor of the silhouette.
|
| Examples
| --------
| >>> import pyvista as pv
| >>> from pyvista import examples
| >>> bunny = examples.download_bunny()
| >>> plotter = pv.Plotter()
| >>> _ = plotter.add_mesh(bunny, color='lightblue')
| >>> _ = plotter.add_silhouette(bunny, color='red', line_width=8.0)
| >>> plotter.view_xy()
| >>> plotter.show()
|
| add_text(self, text, position='upper_left', font_size=18, color=None, font=None, shadow=False, name=None, viewport=False, orientation=0.0, font_file=None, *, render=True)
| Add text to plot object in the top left corner by default.
|
| Parameters
| ----------
| text : str
| The text to add the rendering.
|
| position : str | sequence[float], default: "upper_left"
| Position to place the bottom left corner of the text box.
| If tuple is used, the position of the text uses the pixel
| coordinate system (default). In this case,
| it returns a more general `vtkOpenGLTextActor`.
| If string name is used, it returns a `vtkCornerAnnotation`
| object normally used for fixed labels (like title or xlabel).
| Default is to find the top left corner of the rendering window
| and place text box up there. Available position: ``'lower_left'``,
| ``'lower_right'``, ``'upper_left'``, ``'upper_right'``,
| ``'lower_edge'``, ``'upper_edge'``, ``'right_edge'``, and
| ``'left_edge'``.
|
| font_size : float, default: 18
| Sets the size of the title font.
|
| color : ColorLike, optional
| Either a string, RGB list, or hex color string. For example:
|
| * ``color='white'``
| * ``color='w'``
| * ``color=[1.0, 1.0, 1.0]``
| * ``color='#FFFFFF'``
|
| Defaults to :attr:`pyvista.global_theme.font.color <pyvista.plotting.themes._Font.color>`.
|
| font : str, default: 'arial'
| Font name may be ``'courier'``, ``'times'``, or ``'arial'``.
| This is ignored if the `font_file` is set.
|
| shadow : bool, default: False
| Adds a black shadow to the text.
|
| name : str, optional
| The name for the added actor so that it can be easily updated.
| If an actor of this name already exists in the rendering window, it
| will be replaced by the new actor.
|
| viewport : bool, default: False
| If ``True`` and position is a tuple of float, uses the
| normalized viewport coordinate system (values between 0.0
| and 1.0 and support for HiDPI).
|
| orientation : float, default: 0.0
| Angle orientation of text counterclockwise in degrees. The text
| is rotated around an anchor point that may be on the edge or
| corner of the text. The default is horizontal (0.0 degrees).
|
| font_file : str, default: None
| The absolute file path to a local file containing a freetype
| readable font.
|
| render : bool, default: True
| Force a render when ``True``.
|
| Returns
| -------
| vtk.vtkTextActor
| Text actor added to plot.
|
| Examples
| --------
| Add blue text to the upper right of the plotter.
|
| >>> import pyvista
| >>> pl = pyvista.Plotter()
| >>> actor = pl.add_text(
| ... 'Sample Text',
| ... position='upper_right',
| ... color='blue',
| ... shadow=True,
| ... font_size=26,
| ... )
| >>> pl.show()
|
| Add text and use a custom freetype readable font file.
|
| >>> pl = pyvista.Plotter()
| >>> actor = pl.add_text(
| ... 'Text',
| ... font_file='/home/user/Mplus2-Regular.ttf',
| ... ) # doctest:+SKIP
|
| add_volume(self, volume, scalars=None, clim=None, resolution=None, opacity='linear', n_colors=256, cmap=None, flip_scalars=False, reset_camera=None, name=None, ambient=None, categories=False, culling=False, multi_colors=False, blending='composite', mapper=None, scalar_bar_args=None, show_scalar_bar=None, annotations=None, pickable=True, preference='point', opacity_unit_distance=None, shade=False, diffuse=0.7, specular=0.2, specular_power=10.0, render=True, log_scale=False, **kwargs)
| Add a volume, rendered using a smart mapper by default.
|
| Requires a 3D data type like :class:`numpy.ndarray`,
| :class:`pyvista.ImageData`, :class:`pyvista.RectilinearGrid`,
| or :class:`pyvista.UnstructuredGrid`.
|
| Parameters
| ----------
| volume : 3D numpy.ndarray | pyvista.DataSet
| The input volume to visualize. 3D numpy arrays are accepted.
|
| .. warning::
| If the input is not :class:`numpy.ndarray`,
| :class:`pyvista.ImageData`, or :class:`pyvista.RectilinearGrid`,
| volume rendering will often have poor performance.
|
| scalars : str | numpy.ndarray, optional
| Scalars used to "color" the mesh. Accepts a string name of an
| array that is present on the mesh or an array with length equal
| to the number of cells or the number of points in the
| mesh. If ``scalars`` is ``None``, then the active scalars are used.
|
| Scalars may be 1 dimensional or 2 dimensional. If 1 dimensional,
| the scalars will be mapped to the lookup table. If 2 dimensional
| the scalars will be directly mapped to RGBA values, array should be
| shaped ``(N, 4)`` where ``N`` is the number of points, and of
| datatype ``np.uint8``.
|
| Scalars may be 1 dimensional or 2 dimensional. If 1 dimensional,
| the scalars will be mapped to the lookup table. If 2 dimensional
| the scalars will be directly mapped to RGBA values, array should be
| shaped ``(N, 4)`` where ``N`` is the number of points, and of
| datatype ``np.uint8``.
|
| clim : sequence[float] | float, optional
| Color bar range for scalars. For example: ``[-1, 2]``. Defaults to
| minimum and maximum of scalars array if the scalars dtype is not
| ``np.uint8``. ``rng`` is also an accepted alias for this parameter.
|
| If the scalars datatype is ``np.uint8``, this parameter defaults to
| ``[0, 256]``.
|
| If a single value is given, the range ``[-clim, clim]`` is used.
|
| resolution : list, optional
| Block resolution. For example ``[1, 1, 1]``. Resolution must be
| non-negative. While VTK accepts negative spacing, this results in
| unexpected behavior. See:
| `pyvista #1967 <https://github.com/pyvista/pyvista/issues/1967>`_.
|
| opacity : str | numpy.ndarray, optional
| Opacity mapping for the scalars array.
|
| A string can also be specified to map the scalars range to a
| predefined opacity transfer function. Or you can pass a custom made
| transfer function that is an array either ``n_colors`` in length or
| array, or you can pass a string to select a built in transfer
| function. If a string, should be one of the following:
|
| * ``'linear'`` - Linear
| * ``'linear_r'`` - Linear except reversed
| * ``'geom'`` - Evenly spaced on the log scale
| * ``'geom_r'`` - Evenly spaced on the log scale except reversed
| * ``'sigmoid'`` - Linear map between -10.0 and 10.0
| * ``'sigmoid_1'`` - Linear map between -1.0 and 1.0
| * ``'sigmoid_2'`` - Linear map between -2.0 and 2.0
| * ``'sigmoid_3'`` - Linear map between -3.0 and 3.0
| * ``'sigmoid_4'`` - Linear map between -4.0 and 4.0
| * ``'sigmoid_5'`` - Linear map between -5.0 and 5.0
| * ``'sigmoid_6'`` - Linear map between -6.0 and 6.0
| * ``'sigmoid_7'`` - Linear map between -7.0 and 7.0
| * ``'sigmoid_8'`` - Linear map between -8.0 and 8.0
| * ``'sigmoid_9'`` - Linear map between -9.0 and 9.0
| * ``'sigmoid_10'`` - Linear map between -10.0 and 10.0
| * ``'foreground'`` - Transparent background and opaque foreground.
| Intended for use with segmentation labels. Assumes the smallest
| scalar value of the array is the background value (e.g. 0).
|
| If RGBA scalars are provided, this parameter is set to ``'linear'``
| to ensure the opacity transfer function has no effect on the input
| opacity values.
|
| n_colors : int, optional
| Number of colors to use when displaying scalars. Defaults to 256.
| The scalar bar will also have this many colors.
|
| cmap : str | list | pyvista.LookupTable, default: :attr:`pyvista.plotting.themes.Theme.cmap`
| If a string, this is the name of the ``matplotlib`` colormap to use
| when mapping the ``scalars``. See available Matplotlib colormaps.
| Only applicable for when displaying ``scalars``.
| ``colormap`` is also an accepted alias
| for this. If ``colorcet`` or ``cmocean`` are installed, their
| colormaps can be specified by name.
|
| You can also specify a list of colors to override an existing
| colormap with a custom one. For example, to create a three color
| colormap you might specify ``['green', 'red', 'blue']``.
|
| This parameter also accepts a :class:`pyvista.LookupTable`. If this
| is set, all parameters controlling the color map like ``n_colors``
| will be ignored.
|
| flip_scalars : bool, optional
| Flip direction of cmap. Most colormaps allow ``*_r`` suffix to do
| this as well.
|
| reset_camera : bool, optional
| Reset the camera after adding this mesh to the scene.
|
| name : str, optional
| The name for the added actor so that it can be easily
| updated. If an actor of this name already exists in the
| rendering window, it will be replaced by the new actor.
|
| ambient : float, optional
| When lighting is enabled, this is the amount of light from
| 0 to 1 that reaches the actor when not directed at the
| light source emitted from the viewer. Default 0.0.
|
| categories : bool, optional
| If set to ``True``, then the number of unique values in the scalar
| array will be used as the ``n_colors`` argument.
|
| culling : str, optional
| Does not render faces that are culled. Options are ``'front'`` or
| ``'back'``. This can be helpful for dense surface meshes,
| especially when edges are visible, but can cause flat
| meshes to be partially displayed. Defaults ``False``.
|
| multi_colors : bool, optional
| Whether or not to use multiple colors when plotting MultiBlock
| object. Blocks will be colored sequentially as 'Reds', 'Greens',
| 'Blues', and 'Grays'.
|
| blending : str, optional
| Blending mode for visualisation of the input object(s). Can be
| one of 'additive', 'maximum', 'minimum', 'composite', or
| 'average'. Defaults to 'composite'.
|
| mapper : str, optional
| Volume mapper to use given by name. Options include:
| ``'fixed_point'``, ``'gpu'``, ``'open_gl'``, and
| ``'smart'``. If ``None`` the ``"volume_mapper"`` in the
| ``self._theme`` is used. If using ``'fixed_point'``,
| only ``ImageData`` types can be used.
|
| .. note::
| If a :class:`pyvista.UnstructuredGrid` is input, the 'ugrid'
| mapper (``vtkUnstructuredGridVolumeRayCastMapper``) will be
| used regardless.
|
| .. note::
| The ``'smart'`` mapper chooses one of the other listed
| mappers based on rendering parameters and available
| hardware. Most of the time the ``'smart'`` simply checks
| if a GPU is available and if so, uses the ``'gpu'``
| mapper, otherwise using the ``'fixed_point'`` mapper.
|
| .. warning::
| The ``'fixed_point'`` mapper is CPU-based and will have
| lower performance than the ``'gpu'`` or ``'open_gl'``
| mappers.
|
| scalar_bar_args : dict, optional
| Dictionary of keyword arguments to pass when adding the
| scalar bar to the scene. For options, see
| :func:`pyvista.Plotter.add_scalar_bar`.
|
| show_scalar_bar : bool
| If ``False``, a scalar bar will not be added to the
| scene. Defaults to ``True``.
|
| annotations : dict, optional
| Pass a dictionary of annotations. Keys are the float
| values in the scalars range to annotate on the scalar bar
| and the values are the string annotations.
|
| pickable : bool, optional
| Set whether this mesh is pickable.
|
| preference : str, optional
| When ``mesh.n_points == mesh.n_cells`` and setting
| scalars, this parameter sets how the scalars will be
| mapped to the mesh. Default ``'point'``, causes the
| scalars will be associated with the mesh points. Can be
| either ``'point'`` or ``'cell'``.
|
| opacity_unit_distance : float, optional
| Set/Get the unit distance on which the scalar opacity
| transfer function is defined. Meaning that over that
| distance, a given opacity (from the transfer function) is
| accumulated. This is adjusted for the actual sampling
| distance during rendering. By default, this is the length
| of the diagonal of the bounding box of the volume divided
| by the dimensions.
|
| shade : bool, default: False
| Default off. If shading is turned on, the mapper may
| perform shading calculations - in some cases shading does
| not apply (for example, in a maximum intensity projection)
| and therefore shading will not be performed even if this
| flag is on.
|
| diffuse : float, default: 0.7
| The diffuse lighting coefficient.
|
| specular : float, default: 0.2
| The specular lighting coefficient.
|
| specular_power : float, default: 10.0
| The specular power. Between ``0.0`` and ``128.0``.
|
| render : bool, default: True
| Force a render when True.
|
| log_scale : bool, default: False
| Use log scale when mapping data to colors. Scalars less
| than zero are mapped to the smallest representable
| positive float.
|
| **kwargs : dict, optional
| Optional keyword arguments.
|
| Returns
| -------
| pyvista.Actor
| Actor of the volume.
|
| Examples
| --------
| Show a built-in volume example with the coolwarm colormap.
|
| >>> from pyvista import examples
| >>> import pyvista as pv
| >>> bolt_nut = examples.download_bolt_nut()
| >>> pl = pv.Plotter()
| >>> _ = pl.add_volume(bolt_nut, cmap="coolwarm")
| >>> pl.show()
|
| Create a volume from scratch and plot it using single vector of
| scalars.
|
| >>> import pyvista as pv
| >>> grid = pv.ImageData(dimensions=(9, 9, 9))
| >>> grid['scalars'] = -grid.x
| >>> pl = pv.Plotter()
| >>> _ = pl.add_volume(grid, opacity='linear')
| >>> pl.show()
|
| Plot a volume from scratch using RGBA scalars
|
| >>> import pyvista as pv
| >>> import numpy as np
| >>> grid = pv.ImageData(dimensions=(5, 20, 20))
| >>> scalars = grid.points - (grid.origin)
| >>> scalars /= scalars.max()
| >>> opacity = np.linalg.norm(
| ... grid.points - grid.center, axis=1
| ... ).reshape(-1, 1)
| >>> opacity /= opacity.max()
| >>> scalars = np.hstack((scalars, opacity**3))
| >>> scalars *= 255
| >>> pl = pv.Plotter()
| >>> vol = pl.add_volume(grid, scalars=scalars.astype(np.uint8))
| >>> vol.prop.interpolation_type = 'linear'
| >>> pl.show()
|
| Plot an UnstructuredGrid.
|
| >>> from pyvista import examples
| >>> import pyvista as pv
| >>> mesh = examples.download_letter_a()
| >>> mesh['scalars'] = mesh.points[:, 1]
| >>> pl = pv.Plotter()
| >>> _ = pl.add_volume(mesh, opacity_unit_distance=0.1)
| >>> pl.show()
|
| clear(self)
| Clear plot by removing all actors and properties.
|
| Examples
| --------
| >>> import pyvista
| >>> plotter = pyvista.Plotter()
| >>> actor = plotter.add_mesh(pyvista.Sphere())
| >>> plotter.clear()
| >>> plotter.renderer.actors
| {}
|
| clear_actors(self)
| Clear actors from all renderers.
|
| clear_events_for_key(self, key, raise_on_missing=False)
| Remove the callbacks associated to the key.
|
| Parameters
| ----------
| key : str
| Key to clear events for.
|
| raise_on_missing : bool, default: False
| Whether to raise a :class:`ValueError` if there are no events
| registered for the given key.
|
| clear_on_render_callbacks(self)
| Clear all callback methods previously registered with ``render()``.
|
| close(self, render=False)
| Close the render window.
|
| Parameters
| ----------
| render : bool
| Unused argument.
|
| deep_clean(self)
| Clean the plotter of the memory.
|
| disable(self)
| Disable this renderer's camera from being interactive.
|
| disable_3_lights(self)
| Please use ``enable_lightkit``, this method has been deprecated.
|
| disable_anti_aliasing(self, all_renderers=True)
| Disable anti-aliasing.
|
| Parameters
| ----------
| all_renderers : bool, default: True
| If ``True``, applies to all renderers in subplots. If ``False``,
| then only applies to the active renderer.
|
| Examples
| --------
| >>> import pyvista
| >>> pl = pyvista.Plotter()
| >>> pl.disable_anti_aliasing()
| >>> _ = pl.add_mesh(pyvista.Sphere(), show_edges=True)
| >>> pl.show()
|
| See :ref:`anti_aliasing_example` for a full example demonstrating
| VTK's anti-aliasing approaches.
|
| disable_depth_of_field(self)
| Disable depth of field plotting.
|
| Examples
| --------
| >>> import pyvista as pv
| >>> pl = pv.Plotter(lighting="three lights")
| >>> pl.enable_depth_of_field()
| >>> pl.disable_depth_of_field()
|
| disable_depth_peeling(self)
| Disable depth peeling.
|
| disable_eye_dome_lighting(self)
| Disable eye dome lighting (EDL).
|
| Examples
| --------
| >>> import pyvista
| >>> pl = pyvista.Plotter()
| >>> pl.disable_eye_dome_lighting()
|
| disable_hidden_line_removal(self, all_renderers=True)
| Disable hidden line removal.
|
| Enable again with :func:`enable_hidden_line_removal
| <Plotter.enable_hidden_line_removal>`.
|
| Parameters
| ----------
| all_renderers : bool, default: True
| If ``True``, applies to all renderers in subplots. If
| ``False``, then only applies to the active renderer.
|
| Examples
| --------
| Enable and then disable hidden line removal.
|
| >>> import pyvista
| >>> pl = pyvista.Plotter()
| >>> pl.enable_hidden_line_removal()
| >>> pl.disable_hidden_line_removal()
|
| disable_parallel_projection(self)
| Reset the camera to use perspective projection.
|
| Examples
| --------
| >>> import pyvista
| >>> from pyvista import demos
| >>> pl = pyvista.demos.orientation_plotter()
| >>> pl.disable_parallel_projection()
| >>> pl.show()
|
| disable_shadows(self)
| Disable shadows.
|
| Examples
| --------
| >>> import pyvista
| >>> pl = pyvista.Plotter()
| >>> pl.disable_shadows()
|
| disable_ssao(self)
| Disable surface space ambient occlusion (SSAO).
|
| disable_stereo_render(self)
| Disable anaglyph stereo rendering.
|
| Enable again with :func:`enable_stereo_render
| <Plotter.enable_stereo_render>`
|
| Examples
| --------
| Enable and then disable stereo rendering. It should show a simple cube.
|
| >>> import pyvista as pv
| >>> pl = pv.Plotter()
| >>> _ = pl.add_mesh(pv.Cube())
| >>> pl.enable_stereo_render()
| >>> pl.disable_stereo_render()
| >>> pl.show()
|
| enable(self)
| Enable this renderer's camera to be interactive.
|
| enable_3_lights(self, only_active=False)
| Enable 3-lights illumination.
|
| This will replace all pre-existing lights in the scene.
|
| Parameters
| ----------
| only_active : bool, default: False
| If ``True``, only change the active renderer. The default
| is that every renderer is affected.
|
| Examples
| --------
| >>> from pyvista import demos
| >>> pl = demos.orientation_plotter()
| >>> pl.enable_3_lights()
| >>> pl.show()
|
| Note how this varies from the default plotting.
|
| >>> pl = demos.orientation_plotter()
| >>> pl.show()
|
| enable_anti_aliasing(self, aa_type='ssaa', multi_samples=None, all_renderers=True)
| Enable anti-aliasing.
|
| This tends to make edges appear softer and less pixelated.
|
| Parameters
| ----------
| aa_type : str, default: "ssaa"
| Anti-aliasing type. See the notes below. One of the following:
|
| * ``"ssaa"`` - Super-Sample Anti-Aliasing
| * ``"msaa"`` - Multi-Sample Anti-Aliasing
| * ``"fxaa"`` - Fast Approximate Anti-Aliasing
|
| multi_samples : int, optional
| The number of multi-samples when ``aa_type`` is ``"msaa"``. Note
| that using this setting automatically enables this for all
| renderers. Defaults to the theme multi_samples.
|
| all_renderers : bool, default: True
| If ``True``, applies to all renderers in subplots. If ``False``,
| then only applies to the active renderer.
|
| Notes
| -----
| SSAA, or Super-Sample Anti-Aliasing is a brute force method of
| anti-aliasing. It results in the best image quality but comes at a
| tremendous resource cost. SSAA works by rendering the scene at a higher
| resolution. The final image is produced by downsampling the
| massive source image using an averaging filter. This acts as a low pass
| filter which removes the high frequency components that would cause
| jaggedness.
|
| MSAA, or Multi-Sample Anti-Aliasing is an optimization of SSAA that
| reduces the amount of pixel shader evaluations that need to be computed
| by focusing on overlapping regions of the scene. The result is
| anti-aliasing along edges that is on par with SSAA and less
| anti-aliasing along surfaces as these make up the bulk of SSAA
| computations. MSAA is substantially less computationally expensive than
| SSAA and results in comparable image quality.
|
| FXAA, or Fast Approximate Anti-Aliasing is an Anti-Aliasing technique
| that is performed entirely in post processing. FXAA operates on the
| rasterized image rather than the scene geometry. As a consequence,
| forcing FXAA or using FXAA incorrectly can result in the FXAA filter
| smoothing out parts of the visual overlay that are usually kept sharp
| for reasons of clarity as well as smoothing out textures. FXAA is
| inferior to MSAA but is almost free computationally and is thus
| desirable on low end platforms.
|
| Examples
| --------
| Enable super-sample anti-aliasing (SSAA).
|
| >>> import pyvista
| >>> pl = pyvista.Plotter()
| >>> pl.enable_anti_aliasing('ssaa')
| >>> _ = pl.add_mesh(pyvista.Sphere(), show_edges=True)
| >>> pl.show()
|
| See :ref:`anti_aliasing_example` for a full example demonstrating
| VTK's anti-aliasing approaches.
|
| enable_depth_of_field(self, automatic_focal_distance=True)
| Enable depth of field plotting.
|
| Parameters
| ----------
| automatic_focal_distance : bool, default: True
| Use automatic focal distance calculation. When enabled, the center
| of the viewport will always be in focus regardless of where the
| focal point is.
|
| Examples
| --------
| Create five spheres and demonstrate the effect of depth of field.
|
| >>> import pyvista as pv
| >>> from pyvista import examples
| >>> pl = pv.Plotter(lighting="three lights")
| >>> pl.background_color = "w"
| >>> for i in range(5):
| ... mesh = pv.Sphere(center=(-i * 4, 0, 0))
| ... color = [0, 255 - i * 20, 30 + i * 50]
| ... _ = pl.add_mesh(
| ... mesh,
| ... show_edges=False,
| ... pbr=True,
| ... metallic=1.0,
| ... color=color,
| ... )
| ...
| >>> pl.camera.zoom(1.8)
| >>> pl.camera_position = [
| ... (4.74, 0.959, 0.525),
| ... (0.363, 0.3116, 0.132),
| ... (-0.088, -0.0075, 0.996),
| ... ]
| >>> pl.enable_depth_of_field()
| >>> pl.show()
|
| See :ref:`depth_of_field_example` for a full example using this method.
|
| enable_depth_peeling(self, number_of_peels=None, occlusion_ratio=None)
| Enable depth peeling to improve rendering of translucent geometry.
|
| Parameters
| ----------
| number_of_peels : int, optional
| The maximum number of peeling layers. Initial value is 4
| and is set in the ``pyvista.global_theme``. A special value of
| 0 means no maximum limit. It has to be a positive value.
|
| occlusion_ratio : float, optional
| The threshold under which the depth peeling algorithm
| stops to iterate over peel layers. This is the ratio of
| the number of pixels that have been touched by the last
| layer over the total number of pixels of the viewport
| area. Initial value is 0.0, meaning rendering has to be
| exact. Greater values may speed up the rendering with
| small impact on the quality.
|
| Returns
| -------
| bool
| If depth peeling is supported.
|
| enable_eye_dome_lighting(self)
| Enable eye dome lighting (EDL).
|
| Returns
| -------
| vtk.vtkOpenGLRenderer
| VTK renderer with eye dome lighting pass.
|
| Examples
| --------
| >>> import pyvista
| >>> pl = pyvista.Plotter()
| >>> _ = pl.enable_eye_dome_lighting()
|
| enable_hidden_line_removal(self, all_renderers=True)
| Enable hidden line removal.
|
| Wireframe geometry will be drawn using hidden line removal if
| the rendering engine supports it.
|
| Disable this with :func:`disable_hidden_line_removal
| <Plotter.disable_hidden_line_removal>`.
|
| Parameters
| ----------
| all_renderers : bool, default: True
| If ``True``, applies to all renderers in subplots. If
| ``False``, then only applies to the active renderer.
|
| Examples
| --------
| Create a side-by-side plotter and render a sphere in wireframe
| with hidden line removal enabled on the left and disabled on
| the right.
|
| >>> import pyvista
| >>> sphere = pyvista.Sphere(theta_resolution=20, phi_resolution=20)
| >>> pl = pyvista.Plotter(shape=(1, 2))
| >>> _ = pl.add_mesh(sphere, line_width=3, style='wireframe')
| >>> _ = pl.add_text("With hidden line removal")
| >>> pl.enable_hidden_line_removal(all_renderers=False)
| >>> pl.subplot(0, 1)
| >>> pl.disable_hidden_line_removal(all_renderers=False)
| >>> _ = pl.add_mesh(sphere, line_width=3, style='wireframe')
| >>> _ = pl.add_text("Without hidden line removal")
| >>> pl.show()
|
| enable_image_style(self)
| Set the interactive style to Image.
|
| Controls:
| - Left Mouse button triggers window level events
| - CTRL Left Mouse spins the camera around its view plane normal
| - SHIFT Left Mouse pans the camera
| - CTRL SHIFT Left Mouse dollies (a positional zoom) the camera
| - Middle mouse button pans the camera
| - Right mouse button dollies the camera
| - SHIFT Right Mouse triggers pick events
|
| Examples
| --------
| Create a simple scene with a plotter that has the Image
| interactive style:
|
| >>> import pyvista as pv
| >>> plotter = pv.Plotter()
| >>> _ = plotter.add_mesh(pv.Cube(center=(1, 0, 0)))
| >>> _ = plotter.add_mesh(pv.Cube(center=(0, 1, 0)))
| >>> plotter.show_axes()
| >>> plotter.enable_image_style()
| >>> plotter.show() # doctest:+SKIP
|
| enable_joystick_actor_style(self)
| Set the interactive style to Joystick Actor.
|
| Similar to the Joystick Camera interaction style, however
| in case of the Joystick Actor style the objects in the scene
| rather than the camera can be moved (rotated, panned, etc.).
| The position of the mouse relative to the center of the object
| determines the speed at which the object moves, so the object
| continues to move even if the mouse is not moving.
|
| For a 3-button mouse, the left button is for rotation, the
| right button for zooming, the middle button for panning, and
| ctrl + left button for spinning. (With fewer mouse buttons,
| ctrl + shift + left button is for zooming, and shift + left
| button is for panning.)
|
| Examples
| --------
| Create a simple scene with a plotter that has the Joystick
| Actor interactive style:
|
| >>> import pyvista as pv
| >>> plotter = pv.Plotter()
| >>> _ = plotter.add_mesh(pv.Cube(center=(1, 0, 0)))
| >>> _ = plotter.add_mesh(pv.Cube(center=(0, 1, 0)))
| >>> plotter.show_axes()
| >>> plotter.enable_joystick_actor_style()
| >>> plotter.show() # doctest:+SKIP
|
| enable_joystick_style(self)
| Set the interactive style to Joystick Camera.
|
| It allows the user to move (rotate, pan, etc.) the camera, the
| point of view for the scene. The position of the mouse
| relative to the center of the scene determines the speed at
| which the camera moves, so the camera continues to move even
| if the mouse if not moving.
|
| For a 3-button mouse, the left button is for rotation, the
| right button for zooming, the middle button for panning, and
| ctrl + left button for spinning. (With fewer mouse buttons,
| ctrl + shift + left button is for zooming, and shift + left
| button is for panning.)
|
| Examples
| --------
| Create a simple scene with a plotter that has the Joystick
| Camera interactive style:
|
| >>> import pyvista as pv
| >>> plotter = pv.Plotter()
| >>> _ = plotter.add_mesh(pv.Cube(center=(1, 0, 0)))
| >>> _ = plotter.add_mesh(pv.Cube(center=(0, 1, 0)))
| >>> plotter.show_axes()
| >>> plotter.enable_joystick_style()
| >>> plotter.show() # doctest:+SKIP
|
| enable_lightkit(self, only_active=False)
| Enable the default light-kit lighting.
|
| See:
| https://www.researchgate.net/publication/2926068_LightKit_A_lighting_system_for_effective_visualization
|
| This will replace all pre-existing lights in the renderer.
|
| Parameters
| ----------
| only_active : bool, default: False
| If ``True``, only change the active renderer. The default is that
| every renderer is affected.
|
| Examples
| --------
| Create a plotter without any lights and then enable the
| default light kit.
|
| >>> import pyvista
| >>> pl = pyvista.Plotter(lighting=None)
| >>> pl.enable_lightkit()
| >>> actor = pl.add_mesh(pyvista.Cube(), show_edges=True)
| >>> pl.show()
|
| enable_parallel_projection(self)
| Enable parallel projection.
|
| The camera will have a parallel projection. Parallel projection is
| often useful when viewing images or 2D datasets.
|
| Examples
| --------
| >>> import pyvista
| >>> from pyvista import demos
| >>> pl = pyvista.demos.orientation_plotter()
| >>> pl.enable_parallel_projection()
| >>> pl.show()
|
| enable_rubber_band_2d_style(self)
| Set the interactive style to Rubber Band 2D.
|
| Camera rotation is not enabled with this interactor
| style. Zooming affects the camera's parallel scale only, and
| assumes that the camera is in parallel projection mode. The
| style also allows to draw a rubber band using the left mouse
| button. All camera changes invoke ``StartInteractionEvent`` when
| the button is pressed, ``InteractionEvent`` when the mouse (or
| wheel) is moved, and ``EndInteractionEvent`` when the button is
| released. The bindings are as follows:
|
| * Left mouse: Select (invokes a ``SelectionChangedEvent``).
| * Right mouse: Zoom.
| * Middle mouse: Pan.
| * Scroll wheel: Zoom.
|
| Examples
| --------
| Create a simple scene with a plotter that has the Rubber Band
| 2D interactive style:
|
| >>> import pyvista as pv
| >>> plotter = pv.Plotter()
| >>> _ = plotter.add_mesh(pv.Cube(center=(1, 0, 0)))
| >>> _ = plotter.add_mesh(pv.Cube(center=(0, 1, 0)))
| >>> plotter.show_axes()
| >>> plotter.enable_rubber_band_2d_style()
| >>> plotter.show() # doctest:+SKIP
|
| enable_rubber_band_style(self)
| Set the interactive style to Rubber Band Picking.
|
| This interactor style allows the user to draw a rectangle in
| the render window by hitting ``r`` and then using the left
| mouse button. When the mouse button is released, the attached
| picker operates on the pixel in the center of the selection
| rectangle. If the picker happens to be a ``vtkAreaPicker``
| it will operate on the entire selection rectangle. When the
| ``p`` key is hit the above pick operation occurs on a 1x1
| rectangle. In other respects it behaves the same as the
| Trackball Camera style.
|
| Examples
| --------
| Create a simple scene with a plotter that has the Rubber Band
| Pick interactive style:
|
| >>> import pyvista as pv
| >>> plotter = pv.Plotter()
| >>> _ = plotter.add_mesh(pv.Cube(center=(1, 0, 0)))
| >>> _ = plotter.add_mesh(pv.Cube(center=(0, 1, 0)))
| >>> plotter.show_axes()
| >>> plotter.enable_rubber_band_style()
| >>> plotter.show() # doctest:+SKIP
|
| enable_shadows(self)
| Enable shadows.
|
| Examples
| --------
| First, plot without shadows enabled (default)
|
| >>> import pyvista
| >>> mesh = pyvista.Sphere()
| >>> pl = pyvista.Plotter(lighting='none', window_size=(1000, 1000))
| >>> light = pyvista.Light()
| >>> light.set_direction_angle(20, -20)
| >>> pl.add_light(light)
| >>> _ = pl.add_mesh(mesh, color='white', smooth_shading=True)
| >>> _ = pl.add_mesh(pyvista.Box((-1.2, -1, -1, 1, -1, 1)))
| >>> pl.show()
|
| Now, enable shadows.
|
| >>> import pyvista
| >>> mesh = pyvista.Sphere()
| >>> pl = pyvista.Plotter(lighting='none', window_size=(1000, 1000))
| >>> light = pyvista.Light()
| >>> light.set_direction_angle(20, -20)
| >>> pl.add_light(light)
| >>> _ = pl.add_mesh(mesh, color='white', smooth_shading=True)
| >>> _ = pl.add_mesh(pyvista.Box((-1.2, -1, -1, 1, -1, 1)))
| >>> pl.enable_shadows()
| >>> pl.show()
|
| enable_ssao(self, radius=0.5, bias=0.005, kernel_size=256, blur=True)
| Enable surface space ambient occlusion (SSAO).
|
| SSAO can approximate shadows more efficiently than ray-tracing
| and produce similar results. Use this when you wish to plot the
| occlusion effect that nearby meshes have on each other by blocking
| nearby light sources.
|
| See `Kitware: Screen-Space Ambient Occlusion
| <https://www.kitware.com/ssao/>`_ for more details
|
| Parameters
| ----------
| radius : float, default: 0.5
| Neighbor pixels considered when computing the occlusion.
|
| bias : float, default: 0.005
| Tolerance factor used when comparing pixel depth.
|
| kernel_size : int, default: 256
| Number of samples used. This controls the quality where a higher
| number increases the quality at the expense of computation time.
|
| blur : bool, default: True
| Controls if occlusion buffer should be blurred before combining it
| with the color buffer.
|
| Examples
| --------
| Generate a :class:`pyvista.UnstructuredGrid` with many tetrahedrons
| nearby each other and plot it without SSAO.
|
| >>> import pyvista as pv
| >>> ugrid = pv.ImageData(dimensions=(3, 2, 2)).to_tetrahedra(12)
| >>> exploded = ugrid.explode()
| >>> exploded.plot()
|
| Enable SSAO with the default parameters.
|
| >>> pl = pv.Plotter()
| >>> _ = pl.add_mesh(exploded)
| >>> pl.enable_ssao()
| >>> pl.show()
|
| enable_stereo_render(self)
| Enable anaglyph stereo rendering.
|
| Disable this with :func:`disable_stereo_render
| <Plotter.disable_stereo_render>`
|
| Examples
| --------
| Enable stereo rendering to show a cube as an anaglyph image.
|
| >>> import pyvista as pv
| >>> pl = pv.Plotter()
| >>> _ = pl.add_mesh(pv.Cube())
| >>> pl.enable_stereo_render()
| >>> pl.show()
|
| enable_terrain_style(self, mouse_wheel_zooms=False, shift_pans=False)
| Set the interactive style to Terrain.
|
| Used to manipulate a camera which is viewing a scene with a
| natural view up, e.g., terrain. The camera in such a scene is
| manipulated by specifying azimuth (angle around the view up
| vector) and elevation (the angle from the horizon). Similar to
| the default Trackball Camera style and in contrast to the
| Joystick Camera style, movements of the mouse translate to
| movements of the camera.
|
| Left mouse click rotates the camera around the focal point
| using both elevation and azimuth invocations on the camera.
| Left mouse motion in the horizontal direction results in
| azimuth motion; left mouse motion in the vertical direction
| results in elevation motion. Therefore, diagonal motion results
| in a combination of azimuth and elevation. (If the shift key is
| held during motion, then only one of elevation or azimuth is
| invoked, depending on the whether the mouse motion is primarily
| horizontal or vertical.) Middle mouse button pans the camera
| across the scene (again the shift key has a similar effect on
| limiting the motion to the vertical or horizontal direction.
| The right mouse is used to dolly towards or away from the focal
| point (zoom in or out). Panning and zooming behavior can be
| overridden to match the Trackball Camera style.
|
| The class also supports some keypress events. The ``r`` key
| resets the camera. The ``e`` key invokes the exit callback
| and closes the plotter. The ``f`` key sets a new
| camera focal point and flies towards that point. The ``u``
| key invokes the user event. The ``3`` key toggles between
| stereo and non-stero mode. The ``l`` key toggles on/off
| latitude/longitude markers that can be used to estimate/control
| position.
|
| Parameters
| ----------
| mouse_wheel_zooms : bool, default: False
| Whether to use the mouse wheel for zooming. By default
| zooming can be performed with right click and drag.
|
| shift_pans : bool, default: False
| Whether shift + left mouse button pans the scene. By default
| shift + left mouse button rotates the view restricted to
| only horizontal or vertical movements, and panning is done
| holding down the middle mouse button.
|
| Examples
| --------
| Create a simple scene with a plotter that has the Terrain
| interactive style:
|
| >>> import pyvista as pv
| >>> plotter = pv.Plotter()
| >>> _ = plotter.add_mesh(pv.Cube(center=(1, 0, 0)))
| >>> _ = plotter.add_mesh(pv.Cube(center=(0, 1, 0)))
| >>> plotter.show_axes()
| >>> plotter.enable_terrain_style()
| >>> plotter.show() # doctest:+SKIP
|
| Use controls that are closer to the default style:
|
| >>> plotter = pv.Plotter()
| >>> _ = plotter.add_mesh(pv.Cube(center=(1, 0, 0)))
| >>> _ = plotter.add_mesh(pv.Cube(center=(0, 1, 0)))
| >>> plotter.show_axes()
| >>> plotter.enable_terrain_style(
| ... mouse_wheel_zooms=True, shift_pans=True
| ... )
| >>> plotter.show() # doctest:+SKIP
|
| enable_trackball_actor_style(self)
| Set the interactive style to Trackball Actor.
|
| This allows to rotate actors around the scene. The controls
| are similar to the default Trackball Camera style, but
| movements transform specific objects under the mouse cursor.
|
| For a 3-button mouse, the left button is for rotation, the
| right button for zooming, the middle button for panning, and
| ctrl + left button for spinning objects around the axis
| connecting the camera with the their center. Alternatively,
| shift + left button pans.
|
| Examples
| --------
| Create a simple scene with a plotter that has the Trackball
| Actor interactive style:
|
| >>> import pyvista as pv
| >>> plotter = pv.Plotter()
| >>> _ = plotter.add_mesh(pv.Cube(center=(1, 0, 0)))
| >>> _ = plotter.add_mesh(pv.Cube(center=(0, 1, 0)))
| >>> plotter.show_axes()
| >>> plotter.enable_trackball_actor_style()
| >>> plotter.show() # doctest:+SKIP
|
| enable_trackball_style(self)
| Set the interactive style to Trackball Camera.
|
| The trackball camera is the default interactor style. Moving
| the mouse moves the camera around, leaving the scene intact.
|
| For a 3-button mouse, the left button is for rotation, the
| right button for zooming, the middle button for panning, and
| ctrl + left button for spinning the view around the vewing
| axis of the camera. Alternatively, ctrl + shift + left button
| or mouse wheel zooms, and shift + left button pans.
|
| Examples
| --------
| Create a simple scene with a plotter that has the Trackball
| Camera interactive style (which is also the default):
|
| >>> import pyvista as pv
| >>> plotter = pv.Plotter()
| >>> _ = plotter.add_mesh(pv.Cube(center=(1, 0, 0)))
| >>> _ = plotter.add_mesh(pv.Cube(center=(0, 1, 0)))
| >>> plotter.show_axes()
| >>> plotter.enable_trackball_style()
| >>> plotter.show() # doctest:+SKIP
|
| enable_zoom_style(self)
| Set the interactive style to Rubber Band Zoom.
|
| This interactor style allows the user to draw a rectangle in
| the render window using the left mouse button. When the mouse
| button is released, the current camera zooms by an amount
| determined from the shorter side of the drawn rectangle.
|
| Examples
| --------
| Create a simple scene with a plotter that has the Rubber Band
| Zoom interactive style:
|
| >>> import pyvista as pv
| >>> plotter = pv.Plotter()
| >>> _ = plotter.add_mesh(pv.Cube(center=(1, 0, 0)))
| >>> _ = plotter.add_mesh(pv.Cube(center=(0, 1, 0)))
| >>> plotter.show_axes()
| >>> plotter.enable_zoom_style()
| >>> plotter.show() # doctest:+SKIP
|
| export_gltf(self, filename, inline_data=True, rotate_scene=True, save_normals=True)
| Export the current rendering scene as a glTF file.
|
| Visit https://gltf-viewer.donmccurdy.com/ for an online viewer.
|
| See https://vtk.org/doc/nightly/html/classvtkGLTFExporter.html
| for limitations regarding the exporter.
|
| Parameters
| ----------
| filename : str
| Path to export the gltf file to.
|
| inline_data : bool, default: True
| Sets if the binary data be included in the json file as a
| base64 string. When ``True``, only one file is exported.
|
| rotate_scene : bool, default: True
| Rotate scene to be compatible with the glTF specifications.
|
| save_normals : bool, default: True
| Saves the point array ``'Normals'`` as ``'NORMAL'`` in
| the outputted scene.
|
| Notes
| -----
| The VTK exporter only supports :class:`pyvista.PolyData` datasets. If
| the plotter contains any non-PolyData datasets, these will be converted
| in the plotter, leading to a copy of the data internally.
|
| Examples
| --------
| Output a simple point cloud represented as balls.
|
| >>> import numpy as np
| >>> import pyvista
| >>> point_cloud = np.random.random((100, 3))
| >>> pdata = pyvista.PolyData(point_cloud)
| >>> pdata['orig_sphere'] = np.arange(100)
| >>> sphere = pyvista.Sphere(radius=0.02)
| >>> pc = pdata.glyph(scale=False, geom=sphere, orient=False)
| >>> pl = pyvista.Plotter()
| >>> _ = pl.add_mesh(
| ... pc,
| ... cmap='reds',
| ... smooth_shading=True,
| ... show_scalar_bar=False,
| ... )
| >>> pl.export_gltf('balls.gltf') # doctest:+SKIP
| >>> pl.show()
|
| Output the orientation plotter.
|
| >>> from pyvista import demos
| >>> pl = demos.orientation_plotter()
| >>> pl.export_gltf('orientation_plotter.gltf') # doctest:+SKIP
| >>> pl.show()
|
| export_html(self, filename)
| Export this plotter as an interactive scene to a HTML file.
|
| Parameters
| ----------
| filename : str
| Path to export the html file to.
|
| Returns
| -------
| StringIO
| If filename is None, returns the HTML as a StringIO object.
|
| Notes
| -----
| You will need ``trame`` installed.
|
| Examples
| --------
| >>> import pyvista
| >>> from pyvista import examples
| >>> mesh = examples.load_uniform()
| >>> pl = pyvista.Plotter(shape=(1, 2))
| >>> _ = pl.add_mesh(
| ... mesh, scalars='Spatial Point Data', show_edges=True
| ... )
| >>> pl.subplot(0, 1)
| >>> _ = pl.add_mesh(
| ... mesh, scalars='Spatial Cell Data', show_edges=True
| ... )
| >>> pl.export_html('pyvista.html') # doctest:+SKIP
|
| export_obj(self, filename)
| Export scene to OBJ format.
|
| Parameters
| ----------
| filename : str
| Filename to export the scene to. Must end in ``'.obj'``.
|
| Examples
| --------
| Export the scene to "scene.obj"
|
| >>> import pyvista as pv
| >>> pl = pv.Plotter()
| >>> _ = pl.add_mesh(pv.Sphere())
| >>> pl.export_obj('scene.obj') # doctest:+SKIP
|
| export_vrml(self, filename)
| Export the current rendering scene as a VRML file.
|
| See `vtk.VRMLExporter <https://vtk.org/doc/nightly/html/classvtkVRMLExporter.html>`_
| for limitations regarding the exporter.
|
| Parameters
| ----------
| filename : str
| Filename to export the scene to.
|
| Examples
| --------
| >>> import pyvista
| >>> from pyvista import examples
| >>> pl = pyvista.Plotter()
| >>> _ = pl.add_mesh(examples.load_hexbeam())
| >>> pl.export_vrml("sample") # doctest:+SKIP
|
| export_vtkjs(self, *args, **kwargs)
| Export the current rendering scene as a VTKjs scene.
|
| .. deprecated:: 0.40.0
| This export routine has been broken for some time and has
| been completely removed in version 0.40.0. Use :func:`pyvista.Plotter.export_vtksz` instead.
|
| Parameters
| ----------
| *args : tuple
| Positional arguments.
|
| **kwargs : dict, optional
| Keyword arguments.
|
| export_vtksz(self, filename='scene-export.vtksz', format='zip')
| Export this plotter as a VTK.js OfflineLocalView file.
|
| The exported file can be viewed with the OfflineLocalView viewer
| available at https://kitware.github.io/vtk-js/examples/OfflineLocalView.html
|
| Parameters
| ----------
| filename : str, optional
| Path to export the file to. Defaults to ``'scene-export.vtksz'``.
|
| format : str, optional
| The format of the exported file. Defaults to ``'zip'``. Can be
| either ``'zip'`` or ``'json'``.
|
| Returns
| -------
| str
| The exported filename.
|
| fly_to(self, point)
| Move the current camera's focal point to a position point.
|
| The movement is animated over the number of frames specified in
| NumberOfFlyFrames. The LOD desired frame rate is used.
|
| Parameters
| ----------
| point : sequence[float]
| Point to fly to in the form of ``(x, y, z)``.
|
| generate_orbital_path(self, factor=3.0, n_points=20, viewup=None, shift=0.0)
| Generate an orbital path around the data scene.
|
| Parameters
| ----------
| factor : float, default: 3.0
| A scaling factor when building the orbital extent.
|
| n_points : int, default: 20
| Number of points on the orbital path.
|
| viewup : sequence[float], optional
| The normal to the orbital plane.
|
| shift : float, default: 0.0
| Shift the plane up/down from the center of the scene by
| this amount.
|
| Returns
| -------
| pyvista.PolyData
| PolyData containing the orbital path.
|
| Examples
| --------
| Generate an orbital path around a sphere.
|
| >>> import pyvista
| >>> plotter = pyvista.Plotter()
| >>> _ = plotter.add_mesh(pyvista.Sphere())
| >>> viewup = [0, 0, 1]
| >>> orbit = plotter.generate_orbital_path(
| ... factor=2.0, n_points=50, shift=0.0, viewup=viewup
| ... )
|
| See :ref:`orbiting_example` for a full example using this method.
|
| get_default_cam_pos(self, negative=False)
| Return the default focal points and viewup.
|
| Uses ResetCamera to make a useful view.
|
| Parameters
| ----------
| negative : bool, default: False
| View from the opposite direction.
|
| Returns
| -------
| list
| List of camera position:
|
| * Position
| * Focal point
| * View up
|
| get_image_depth(self, fill_value=nan, reset_camera_clipping_range=True)
| Return a depth image representing current render window.
|
| Parameters
| ----------
| fill_value : float, default: numpy.nan
| Fill value for points in image that do not include objects
| in scene. To not use a fill value, pass ``None``.
|
| reset_camera_clipping_range : bool, default: True
| Reset the camera clipping range to include data in view.
|
| Returns
| -------
| numpy.ndarray
| Image of depth values from camera orthogonal to image
| plane.
|
| Notes
| -----
| Values in image_depth are negative to adhere to a
| right-handed coordinate system.
|
| Examples
| --------
| >>> import pyvista
| >>> plotter = pyvista.Plotter()
| >>> actor = plotter.add_mesh(pyvista.Sphere())
| >>> plotter.show()
| >>> zval = plotter.get_image_depth()
|
| hide_axes(self)
| Hide the axes orientation widget.
|
| Examples
| --------
| >>> import pyvista as pv
| >>> pl = pv.Plotter()
| >>> pl.hide_axes()
|
| hide_axes_all(self)
| Hide the axes orientation widget in all renderers.
|
| image_scale_context(self, scale: Optional[int] = None)
| Set the image scale in an isolated context.
|
| Parameters
| ----------
| scale : int, optional
| Integer scale factor. Defaults to :attr:`pyvista.Plotter.image_scale`.
|
| import_gltf(self, filename, set_camera=True)
| Import a glTF file into the plotter.
|
| See https://www.khronos.org/gltf/ for more information.
|
| Parameters
| ----------
| filename : str
| Path to the glTF file.
|
| set_camera : bool, default: True
| Set the camera viewing angle to one compatible with the
| default three.js perspective (``'xy'``).
|
| Examples
| --------
| >>> import pyvista
| >>> from pyvista import examples
| >>> helmet_file = (
| ... examples.gltf.download_damaged_helmet()
| ... ) # doctest:+SKIP
| >>> texture = (
| ... examples.hdr.download_dikhololo_night()
| ... ) # doctest:+SKIP
| >>> pl = pyvista.Plotter() # doctest:+SKIP
| >>> pl.import_gltf(helmet_file) # doctest:+SKIP
| >>> pl.set_environment_texture(cubemap) # doctest:+SKIP
| >>> pl.camera.zoom(1.8) # doctest:+SKIP
| >>> pl.show() # doctest:+SKIP
|
| See :ref:`load_gltf` for a full example using this method.
|
| import_vrml(self, filename)
| Import a VRML file into the plotter.
|
| Parameters
| ----------
| filename : str
| Path to the VRML file.
|
| Examples
| --------
| >>> import pyvista
| >>> from pyvista import examples
| >>> sextant_file = (
| ... examples.vrml.download_sextant()
| ... ) # doctest:+SKIP
| >>> pl = pyvista.Plotter() # doctest:+SKIP
| >>> pl.import_vrml(sextant_file) # doctest:+SKIP
| >>> pl.show() # doctest:+SKIP
|
| See :ref:`load_vrml_example` for a full example using this method.
|
| increment_point_size_and_line_width(self, increment)
| Increment point size and line width of all actors.
|
| For every actor in the scene, increment both its point size
| and line width by the given value.
|
| Parameters
| ----------
| increment : float
| Amount to increment point size and line width.
|
| isometric_view(self)
| Reset the camera to a default isometric view.
|
| DEPRECATED: Please use ``view_isometric``.
|
| isometric_view_interactive(self)
| Set the current interactive render window to isometric view.
|
| key_press_event(self, obj, event)
| Listen for key press event.
|
| left_button_down(self, obj, event_type)
| Register the event for a left button down click.
|
| link_views(self, views=0)
| Link the views' cameras.
|
| Parameters
| ----------
| views : int | tuple | list, default: 0
| If ``views`` is int, link the views to the given view
| index or if ``views`` is a tuple or a list, link the given
| views cameras.
|
| Examples
| --------
| Not linked view case.
|
| >>> import pyvista
| >>> from pyvista import demos
| >>> ocube = demos.orientation_cube()
| >>> pl = pyvista.Plotter(shape=(1, 2))
| >>> pl.subplot(0, 0)
| >>> _ = pl.add_mesh(ocube['cube'], show_edges=True)
| >>> _ = pl.add_mesh(ocube['x_p'], color='blue')
| >>> _ = pl.add_mesh(ocube['x_n'], color='blue')
| >>> _ = pl.add_mesh(ocube['y_p'], color='green')
| >>> _ = pl.add_mesh(ocube['y_n'], color='green')
| >>> _ = pl.add_mesh(ocube['z_p'], color='red')
| >>> _ = pl.add_mesh(ocube['z_n'], color='red')
| >>> pl.camera_position = 'yz'
| >>> pl.subplot(0, 1)
| >>> _ = pl.add_mesh(ocube['cube'], show_edges=True)
| >>> _ = pl.add_mesh(ocube['x_p'], color='blue')
| >>> _ = pl.add_mesh(ocube['x_n'], color='blue')
| >>> _ = pl.add_mesh(ocube['y_p'], color='green')
| >>> _ = pl.add_mesh(ocube['y_n'], color='green')
| >>> _ = pl.add_mesh(ocube['z_p'], color='red')
| >>> _ = pl.add_mesh(ocube['z_n'], color='red')
| >>> pl.show_axes()
| >>> pl.show()
|
| Linked view case.
|
| >>> pl = pyvista.Plotter(shape=(1, 2))
| >>> pl.subplot(0, 0)
| >>> _ = pl.add_mesh(ocube['cube'], show_edges=True)
| >>> _ = pl.add_mesh(ocube['x_p'], color='blue')
| >>> _ = pl.add_mesh(ocube['x_n'], color='blue')
| >>> _ = pl.add_mesh(ocube['y_p'], color='green')
| >>> _ = pl.add_mesh(ocube['y_n'], color='green')
| >>> _ = pl.add_mesh(ocube['z_p'], color='red')
| >>> _ = pl.add_mesh(ocube['z_n'], color='red')
| >>> pl.camera_position = 'yz'
| >>> pl.subplot(0, 1)
| >>> _ = pl.add_mesh(ocube['cube'], show_edges=True)
| >>> _ = pl.add_mesh(ocube['x_p'], color='blue')
| >>> _ = pl.add_mesh(ocube['x_n'], color='blue')
| >>> _ = pl.add_mesh(ocube['y_p'], color='green')
| >>> _ = pl.add_mesh(ocube['y_n'], color='green')
| >>> _ = pl.add_mesh(ocube['z_p'], color='red')
| >>> _ = pl.add_mesh(ocube['z_n'], color='red')
| >>> pl.show_axes()
| >>> pl.link_views()
| >>> pl.show()
|
| open_gif(self, filename, loop=0, fps=10, palettesize=256, subrectangles=False, **kwargs)
| Open a gif file.
|
| Requires ``imageio`` to be installed.
|
| Parameters
| ----------
| filename : str
| Filename of the gif to open. Filename must end in ``"gif"``.
|
| loop : int, default: 0
| The number of iterations. Default value of 0 loops indefinitely.
|
| fps : float, default: 10
| The number of frames per second. If duration is not given, the
| duration for each frame is set to 1/fps.
|
| palettesize : int, default: 256
| The number of colors to quantize the image to. Is rounded to the
| nearest power of two. Must be between 2 and 256.
|
| subrectangles : bool, default: False
| If ``True``, will try and optimize the GIF by storing only the rectangular
| parts of each frame that change with respect to the previous.
|
| .. note::
| Setting this to ``True`` may help reduce jitter in colorbars.
|
| **kwargs : dict, optional
| See the documentation for :func:`imageio.get_writer() <imageio.v2.get_writer>`
| for additional kwargs.
|
| Notes
| -----
| Consider using `pygifsicle
| <https://github.com/LucaCappelletti94/pygifsicle>`_ to reduce the final
| size of the gif. See `Optimizing a GIF using pygifsicle
| <https://imageio.readthedocs.io/en/stable/examples.html#optimizing-a-gif-using-pygifsicle>`_.
|
| Examples
| --------
| Open a gif file, setting the framerate to 8 frames per second and
| reducing the colorspace to 64.
|
| >>> import pyvista
| >>> pl = pyvista.Plotter()
| >>> pl.open_gif(
| ... 'movie.gif', fps=8, palettesize=64
| ... ) # doctest:+SKIP
|
| See :ref:`gif_movie_example` for a full example using this method.
|
| open_movie(self, filename, framerate=24, quality=5, **kwargs)
| Establish a connection to the ffmpeg writer.
|
| Requires ``imageio`` to be installed.
|
| Parameters
| ----------
| filename : str
| Filename of the movie to open. Filename should end in mp4,
| but other filetypes may be supported. See :func:`imageio.get_writer()
| <imageio.v2.get_writer>`.
|
| framerate : int, default: 24
| Frames per second.
|
| quality : int, default: 5
| Quality 10 is the top possible quality for any codec. The
| range is ``0 - 10``. Higher quality leads to a larger file.
|
| **kwargs : dict, optional
| See the documentation for :func:`imageio.get_writer()
| <imageio.v2.get_writer>` for additional kwargs.
|
| Notes
| -----
| See the documentation for :func:`imageio.get_writer() <imageio.v2.get_writer>`.
|
| Examples
| --------
| Open a MP4 movie and set the quality to maximum.
|
| >>> import pyvista
| >>> pl = pyvista.Plotter
| >>> pl.open_movie('movie.mp4', quality=10) # doctest:+SKIP
|
| orbit_on_path(self, path=None, focus=None, step=0.5, viewup=None, write_frames=False, threaded=False, progress_bar=False)
| Orbit on the given path focusing on the focus point.
|
| Parameters
| ----------
| path : pyvista.PolyData
| Path of orbital points. The order in the points is the order of
| travel.
|
| focus : sequence[float], optional
| The point of focus the camera. For example ``(0.0, 0.0, 0.0)``.
|
| step : float, default: 0.5
| The timestep between flying to each camera position. Ignored when
| ``plotter.off_screen = True``.
|
| viewup : sequence[float], optional
| The normal to the orbital plane.
|
| write_frames : bool, default: False
| Assume a file is open and write a frame on each camera
| view during the orbit.
|
| threaded : bool, default: False
| Run this as a background thread. Generally used within a
| GUI (i.e. PyQt).
|
| progress_bar : bool, default: False
| Show the progress bar when proceeding through the path.
| This can be helpful to show progress when generating
| movies with ``off_screen=True``.
|
| Examples
| --------
| Plot an orbit around the earth. Save the gif as a temporary file.
|
| >>> import os
| >>> from tempfile import mkdtemp
| >>> import pyvista
| >>> from pyvista import examples
| >>> mesh = examples.load_globe()
| >>> texture = examples.load_globe_texture()
| >>> filename = os.path.join(mkdtemp(), 'orbit.gif')
| >>> plotter = pyvista.Plotter(window_size=[300, 300])
| >>> _ = plotter.add_mesh(
| ... mesh, texture=texture, smooth_shading=True
| ... )
| >>> plotter.open_gif(filename)
| >>> viewup = [0, 0, 1]
| >>> orbit = plotter.generate_orbital_path(
| ... factor=2.0, n_points=24, shift=0.0, viewup=viewup
| ... )
| >>> plotter.orbit_on_path(
| ... orbit, write_frames=True, viewup=viewup, step=0.02
| ... )
|
| See :ref:`orbiting_example` for a full example using this method.
|
| remove_actor(self, actor, reset_camera=False, render=True)
| Remove an actor from the Renderer.
|
| Parameters
| ----------
| actor : str, vtk.vtkActor, list or tuple
| If the type is ``str``, removes the previously added actor
| with the given name. If the type is ``vtk.vtkActor``,
| removes the actor if it's previously added to the
| Renderer. If ``list`` or ``tuple``, removes iteratively
| each actor.
|
| reset_camera : bool, optional
| Resets camera so all actors can be seen.
|
| render : bool, optional
| Render upon actor removal. Set this to ``False`` to stop
| the render window from rendering when an actor is removed.
|
| Returns
| -------
| bool
| ``True`` when actor removed. ``False`` when actor has not
| been removed.
|
| Examples
| --------
| Add two meshes to a plotter and then remove the sphere actor.
|
| >>> import pyvista
| >>> mesh = pyvista.Cube()
| >>> pl = pyvista.Plotter()
| >>> cube_actor = pl.add_mesh(pyvista.Cube(), show_edges=True)
| >>> sphere_actor = pl.add_mesh(pyvista.Sphere(), show_edges=True)
| >>> _ = pl.remove_actor(cube_actor)
| >>> pl.show()
|
| remove_all_lights(self, only_active=False)
| Remove all lights from the scene.
|
| Parameters
| ----------
| only_active : bool, default: False
| If ``True``, only remove lights from the active
| renderer. The default is that lights are stripped from
| every renderer.
|
| Examples
| --------
| Create a plotter and remove all lights after initialization.
| Note how the mesh rendered is completely flat
|
| >>> import pyvista as pv
| >>> plotter = pv.Plotter()
| >>> plotter.remove_all_lights()
| >>> plotter.renderer.lights
| []
| >>> _ = plotter.add_mesh(pv.Sphere(), show_edges=True)
| >>> plotter.show()
|
| Note how this differs from a plot with default lighting
|
| >>> pv.Sphere().plot(show_edges=True, lighting=True)
|
| remove_background_image(self)
| Remove the background image at the current renderer.
|
| Examples
| --------
| >>> import pyvista
| >>> from pyvista import examples
| >>> pl = pyvista.Plotter(shape=(1, 2))
| >>> pl.subplot(0, 0)
| >>> actor = pl.add_mesh(pyvista.Sphere())
| >>> pl.add_background_image(examples.mapfile, as_global=False)
| >>> pl.subplot(0, 1)
| >>> actor = pl.add_mesh(pyvista.Cube())
| >>> pl.add_background_image(examples.mapfile, as_global=False)
| >>> pl.remove_background_image()
| >>> pl.show()
|
| remove_blurring(self)
| Remove a single blurring pass.
|
| You will need to run this multiple times to remove all blurring passes.
|
| Examples
| --------
| >>> import pyvista as pv
| >>> pl = pv.Plotter()
| >>> _ = pl.add_mesh(pv.Sphere())
| >>> pl.add_blurring()
| >>> pl.remove_blurring()
| >>> pl.show()
|
| remove_bounding_box(self, render=True)
| Remove bounding box.
|
| Parameters
| ----------
| render : bool, default: True
| Trigger a render once the bounding box is removed.
|
| Examples
| --------
| >>> import pyvista
| >>> pl = pyvista.Plotter()
| >>> _ = pl.add_bounding_box()
| >>> pl.remove_bounding_box()
|
| remove_bounds_axes(self)
| Remove bounds axes.
|
| Examples
| --------
| >>> import pyvista
| >>> pl = pyvista.Plotter(shape=(1, 2))
| >>> pl.subplot(0, 0)
| >>> actor = pl.add_mesh(pyvista.Sphere())
| >>> actor = pl.show_bounds(grid='front', location='outer')
| >>> pl.subplot(0, 1)
| >>> actor = pl.add_mesh(pyvista.Sphere())
| >>> actor = pl.show_bounds(grid='front', location='outer')
| >>> actor = pl.remove_bounds_axes()
| >>> pl.show()
|
| remove_chart(self, chart_or_index)
| Remove a chart from this renderer.
|
| Parameters
| ----------
| chart_or_index : Chart or int
| Either the chart to remove from this renderer or its index in the collection of charts.
|
| Examples
| --------
| First define a function to add two charts to a renderer.
|
| >>> import pyvista
| >>> def plotter_with_charts():
| ... pl = pyvista.Plotter()
| ... pl.background_color = 'w'
| ... chart_left = pyvista.Chart2D(size=(0.5, 1))
| ... _ = chart_left.line([0, 1, 2], [2, 1, 3])
| ... pl.add_chart(chart_left)
| ... chart_right = pyvista.Chart2D(size=(0.5, 1), loc=(0.5, 0))
| ... _ = chart_right.line([0, 1, 2], [3, 1, 2])
| ... pl.add_chart(chart_right)
| ... return pl, chart_left, chart_right
| ...
| >>> pl, *_ = plotter_with_charts()
| >>> pl.show()
|
| Now reconstruct the same plotter but remove the right chart by index.
|
| >>> pl, *_ = plotter_with_charts()
| >>> pl.remove_chart(1)
| >>> pl.show()
|
| Finally, remove the left chart by reference.
|
| >>> pl, chart_left, chart_right = plotter_with_charts()
| >>> pl.remove_chart(chart_left)
| >>> pl.show()
|
| remove_environment_texture(self)
| Remove the environment texture.
|
| Examples
| --------
| >>> from pyvista import examples
| >>> import pyvista as pv
| >>> pl = pv.Plotter(lighting=None)
| >>> cubemap = examples.download_sky_box_cube_map()
| >>> _ = pl.add_mesh(
| ... pv.Sphere(), pbr=True, metallic=0.9, roughness=0.4
| ... )
| >>> pl.set_environment_texture(cubemap)
| >>> pl.remove_environment_texture()
| >>> pl.camera_position = 'xy'
| >>> pl.show()
|
| remove_floors(self, clear_kwargs=True, render=True)
| Remove all floor actors.
|
| Parameters
| ----------
| clear_kwargs : bool, default: True
| Clear default floor arguments.
|
| render : bool, default: True
| Render upon removing the floor.
|
| Examples
| --------
| Add a floor below a sphere, remove it, and then plot it.
|
| >>> import pyvista
| >>> pl = pyvista.Plotter()
| >>> actor = pl.add_mesh(pyvista.Sphere())
| >>> actor = pl.add_floor()
| >>> pl.remove_floors()
| >>> pl.show()
|
| remove_legend(self, render=True)
| Remove the legend actor.
|
| Parameters
| ----------
| render : bool, default: True
| Render upon actor removal. Set this to ``False`` to stop
| the render window from rendering when a the legend is removed.
|
| Examples
| --------
| >>> import pyvista
| >>> mesh = pyvista.Sphere()
| >>> pl = pyvista.Plotter()
| >>> _ = pl.add_mesh(mesh, label='sphere')
| >>> _ = pl.add_legend()
| >>> pl.remove_legend()
|
| remove_scalar_bar(self, title=None, render=True)
| Remove a scalar bar.
|
| Parameters
| ----------
| title : str, optional
| Title of the scalar bar to remove. Required if there is
| more than one scalar bar.
|
| render : bool, default: True
| Render upon scalar bar removal. Set this to ``False`` to
| stop the render window from rendering when a scalar bar
| is removed.
|
| Examples
| --------
| Remove a scalar bar from a plotter.
|
| >>> import pyvista as pv
| >>> mesh = pv.Sphere()
| >>> mesh['data'] = mesh.points[:, 2]
| >>> pl = pv.Plotter()
| >>> _ = pl.add_mesh(mesh, cmap='coolwarm')
| >>> pl.remove_scalar_bar()
| >>> pl.show()
|
| render(self)
| Render the main window.
|
| Will not render until ``show`` has been called.
|
| Any render callbacks added with
| :func:`add_on_render_callback() <pyvista.Plotter.add_on_render_callback>`
| and the ``render_event=False`` option set will still execute on any call.
|
| reset_camera(self, render=True, bounds=None)
| Reset the camera of the active render window.
|
| The camera slides along the vector defined from camera
| position to focal point until all of the actors can be seen.
|
| Parameters
| ----------
| render : bool, default: True
| Trigger a render after resetting the camera.
|
| bounds : iterable(int), optional
| Automatically set up the camera based on a specified bounding box
| ``(xmin, xmax, ymin, ymax, zmin, zmax)``.
|
| Examples
| --------
| Add a mesh and place the camera position too close to the
| mesh. Then reset the camera and show the mesh.
|
| >>> import pyvista
| >>> pl = pyvista.Plotter()
| >>> actor = pl.add_mesh(pyvista.Sphere(), show_edges=True)
| >>> pl.set_position((0, 0.1, 0.1))
| >>> pl.reset_camera()
| >>> pl.show()
|
| reset_camera_clipping_range(self)
| Reset camera clipping planes.
|
| reset_key_events(self)
| Reset all of the key press events to their defaults.
|
| save_graphic(self, filename, title='PyVista Export', raster=True, painter=True)
| Save a screenshot of the rendering window as a graphic file.
|
| This can be helpful for publication documents.
|
| The supported formats are:
|
| * ``'.svg'``
| * ``'.eps'``
| * ``'.ps'``
| * ``'.pdf'``
| * ``'.tex'``
|
| Parameters
| ----------
| filename : str
| Path to fsave the graphic file to.
|
| title : str, default: "PyVista Export"
| Title to use within the file properties.
|
| raster : bool, default: True
| Attempt to write 3D properties as a raster image.
|
| painter : bool, default: True
| Configure the exporter to expect a painter-ordered 2D
| rendering, that is, a rendering at a fixed depth where
| primitives are drawn from the bottom up.
|
| Examples
| --------
| >>> import pyvista
| >>> from pyvista import examples
| >>> pl = pyvista.Plotter()
| >>> _ = pl.add_mesh(examples.load_airplane(), smooth_shading=True)
| >>> _ = pl.add_background_image(examples.mapfile)
| >>> pl.save_graphic("img.svg") # doctest:+SKIP
|
| screenshot(self, filename=None, transparent_background=None, return_img=True, window_size=None, scale=None)
| Take screenshot at current camera position.
|
| Parameters
| ----------
| filename : str | pathlib.Path | io.BytesIO, optional
| Location to write image to. If ``None``, no image is written.
|
| transparent_background : bool, optional
| Whether to make the background transparent. The default is
| looked up on the plotter's theme.
|
| return_img : bool, default: True
| If ``True``, a :class:`numpy.ndarray` of the image will be
| returned.
|
| window_size : sequence[int], optional
| Set the plotter's size to this ``(width, height)`` before
| taking the screenshot.
|
| scale : int, optional
| Set the factor to scale the window size to make a higher
| resolution image. If ``None`` this will use the ``image_scale``
| property on this plotter which defaults to one.
|
| Returns
| -------
| numpy.ndarray
| Array containing pixel RGB and alpha. Sized:
|
| * [Window height x Window width x 3] if
| ``transparent_background`` is set to ``False``.
| * [Window height x Window width x 4] if
| ``transparent_background`` is set to ``True``.
|
| Examples
| --------
| >>> import pyvista
| >>> sphere = pyvista.Sphere()
| >>> plotter = pyvista.Plotter(off_screen=True)
| >>> actor = plotter.add_mesh(sphere)
| >>> plotter.screenshot('screenshot.png') # doctest:+SKIP
|
| set_background(self, color, top=None, all_renderers=True)
| Set the background color.
|
| Parameters
| ----------
| color : ColorLike, optional
| Either a string, rgb list, or hex color string. Defaults
| to current theme parameters. For example:
|
| * ``color='white'``
| * ``color='w'``
| * ``color=[1.0, 1.0, 1.0]``
| * ``color='#FFFFFF'``
|
| top : ColorLike, optional
| If given, this will enable a gradient background where the
| ``color`` argument is at the bottom and the color given in ``top``
| will be the color at the top of the renderer.
|
| all_renderers : bool, default: True
| If ``True``, applies to all renderers in subplots. If ``False``,
| then only applies to the active renderer.
|
| Examples
| --------
| Set the background color to black.
|
| >>> import pyvista
| >>> plotter = pyvista.Plotter()
| >>> plotter.set_background('black')
| >>> plotter.background_color
| Color(name='black', hex='#000000ff', opacity=255)
| >>> plotter.close()
|
| Set the background color at the bottom to black and white at
| the top. Display a cone as well.
|
| >>> import pyvista
| >>> pl = pyvista.Plotter()
| >>> actor = pl.add_mesh(pyvista.Cone())
| >>> pl.set_background('black', top='white')
| >>> pl.show()
|
| set_chart_interaction(self, interactive, toggle=False)
| Set or toggle interaction with charts for the active renderer.
|
| Interaction with other charts in other renderers is disabled.
| Interaction with other charts in the active renderer is only disabled
| when ``toggle`` is ``False``.
|
| Parameters
| ----------
| interactive : bool | Chart | int | sequence[Chart] | sequence[int]
| Following parameter values are accepted:
|
| * A boolean to enable (``True``) or disable (``False``) interaction
| with all charts in the active renderer.
| * The chart or its index to enable interaction with. Interaction
| with multiple charts can be enabled by passing a list of charts
| or indices.
|
| toggle : bool, default: False
| Instead of enabling interaction with the provided chart(s), interaction
| with the provided chart(s) is toggled. Only applicable when ``interactive``
| is not a boolean.
|
| Returns
| -------
| list of Chart
| The list of all interactive charts for the active renderer.
|
| set_color_cycler(self, color_cycler, all_renderers=True)
| Set or reset the color cycler.
|
| This color cycler is iterated over by each sequential :class:`add_mesh() <pyvista.Plotter.add_mesh>`
| call to set the default color of the dataset being plotted.
|
| When setting, the value must be either a list of color-like objects,
| or a cycler of color-like objects. If the value passed is a single
| string, it must be one of:
|
| * ``'default'`` - Use the default color cycler (matches matplotlib's default)
| * ``'matplotlib`` - Dynamically get matplotlib's current theme's color cycler.
| * ``'all'`` - Cycle through all of the available colors in ``pyvista.plotting.colors.hexcolors``
|
| Setting to ``None`` will disable the use of the color cycler on this
| renderer.
|
| Parameters
| ----------
| color_cycler : str | cycler.Cycler | sequence[ColorLike]
| The colors to cycle through.
|
| all_renderers : bool, default: True
| If ``True``, applies to all renderers in subplots. If ``False``,
| then only applies to the active renderer.
|
| Examples
| --------
| Set the default color cycler to iterate through red, green, and blue.
|
| >>> import pyvista as pv
| >>> pl = pv.Plotter()
| >>> pl.set_color_cycler(['red', 'green', 'blue'])
| >>> _ = pl.add_mesh(pv.Cone(center=(0, 0, 0))) # red
| >>> _ = pl.add_mesh(pv.Cube(center=(1, 0, 0))) # green
| >>> _ = pl.add_mesh(pv.Sphere(center=(1, 1, 0))) # blue
| >>> _ = pl.add_mesh(pv.Cylinder(center=(0, 1, 0))) # red again
| >>> pl.show()
|
| set_environment_texture(self, texture, is_srgb=False)
| Set the environment texture used for image based lighting.
|
| This texture is supposed to represent the scene background. If
| it is not a cubemap, the texture is supposed to represent an
| equirectangular projection. If used with raytracing backends,
| the texture must be an equirectangular projection and must be
| constructed with a valid ``vtk.vtkImageData``.
|
| Parameters
| ----------
| texture : pyvista.Texture
| Texture.
|
| is_srgb : bool, default: False
| If the texture is in sRGB color space, set the color flag on the
| texture or set this parameter to ``True``. Textures are assumed
| to be in linear color space by default.
|
| Examples
| --------
| Add a skybox cubemap as an environment texture and show that the
| lighting from the texture is mapped on to a sphere dataset. Note how
| even when disabling the default lightkit, the scene lighting will still
| be mapped onto the actor.
|
| >>> from pyvista import examples
| >>> import pyvista as pv
| >>> pl = pv.Plotter(lighting=None)
| >>> cubemap = examples.download_sky_box_cube_map()
| >>> _ = pl.add_mesh(
| ... pv.Sphere(), pbr=True, metallic=0.9, roughness=0.4
| ... )
| >>> pl.set_environment_texture(cubemap)
| >>> pl.camera_position = 'xy'
| >>> pl.show()
|
| set_focus(self, point)
| Set focus to a point.
|
| Parameters
| ----------
| point : sequence[float]
| Cartesian point to focus on in the form of ``[x, y, z]``.
|
| Examples
| --------
| >>> import pyvista
| >>> mesh = pyvista.Cube()
| >>> pl = pyvista.Plotter()
| >>> _ = pl.add_mesh(mesh, show_edges=True)
| >>> _ = pl.add_point_labels([mesh.points[1]], ["Focus"])
| >>> _ = pl.camera # this initializes the camera
| >>> pl.set_focus(mesh.points[1])
| >>> pl.show()
|
| set_position(self, point, reset=False, render=True)
| Set camera position to a point.
|
| Parameters
| ----------
| point : sequence
| Cartesian point to focus on in the form of ``[x, y, z]``.
|
| reset : bool, default: False
| Whether to reset the camera after setting the camera
| position.
|
| render : bool, default: True
| If the render window is being shown, trigger a render
| after setting the position.
|
| Examples
| --------
| Move the camera far away to ``[7, 7, 7]``.
|
| >>> import pyvista
| >>> mesh = pyvista.Cube()
| >>> pl = pyvista.Plotter()
| >>> _ = pl.add_mesh(mesh, show_edges=True)
| >>> pl.set_position([7, 7, 7])
| >>> pl.show()
|
| set_scale(self, xscale=None, yscale=None, zscale=None, reset_camera=True, render=True)
| Scale all the actors in the scene.
|
| Scaling in performed independently on the X, Y and Z axis.
| A scale of zero is illegal and will be replaced with one.
|
| .. warning::
| Setting the scale on the renderer is a convenience method to
| individually scale each of the actors in the scene. If a scale
| was set on an actor previously, it will be reset to the scale
| of this Renderer.
|
| Parameters
| ----------
| xscale : float, optional
| Scaling in the x direction. Default is ``None``, which
| does not change existing scaling.
|
| yscale : float, optional
| Scaling in the y direction. Default is ``None``, which
| does not change existing scaling.
|
| zscale : float, optional
| Scaling in the z direction. Default is ``None``, which
| does not change existing scaling.
|
| reset_camera : bool, default: True
| Resets camera so all actors can be seen.
|
| render : bool, default: True
| If the render window is being shown, trigger a render
| after setting the scale.
|
| Examples
| --------
| Set the scale in the z direction to be 2 times that of
| nominal. Leave the other axes unscaled.
|
| >>> import pyvista
| >>> pl = pyvista.Plotter()
| >>> pl.set_scale(zscale=2)
| >>> _ = pl.add_mesh(pyvista.Sphere()) # perfect sphere
| >>> pl.show()
|
| set_viewup(self, vector, reset=True, render=True)
| Set camera viewup vector.
|
| Parameters
| ----------
| vector : sequence[float]
| New camera viewup vector.
|
| reset : bool, default: True
| Whether to reset the camera after setting the camera
| position.
|
| render : bool, default: True
| If the render window is being shown, trigger a render
| after setting the viewup.
|
| Examples
| --------
| Look from the top down by setting view up to ``[0, 1, 0]``.
| Notice how the Y axis appears vertical.
|
| >>> from pyvista import demos
| >>> pl = demos.orientation_plotter()
| >>> pl.set_viewup([0, 1, 0])
| >>> pl.show()
|
| show_axes(self)
| Show the axes orientation widget.
|
| Examples
| --------
| >>> import pyvista
| >>> pl = pyvista.Plotter()
| >>> pl.show_axes()
|
| show_axes_all(self)
| Show the axes orientation widget in all renderers.
|
| Examples
| --------
| >>> import pyvista
| >>> from pyvista import examples
| >>>
| >>> mesh = examples.load_globe()
| >>> texture = examples.load_globe_texture()
| >>>
| >>> # create multi-window plot (1 row, 2 columns)
| >>> pl = pyvista.Plotter(shape=(1, 2))
| >>>
| >>> # activate subplot 1 and add a mesh
| >>> pl.subplot(0, 0)
| >>> _ = pl.add_mesh(mesh, texture=texture)
| >>>
| >>> # activate subplot 2 and add a mesh
| >>> pl.subplot(0, 1)
| >>> _ = pl.add_mesh(examples.load_airplane())
| >>>
| >>> # show the axes orientation widget in all subplots
| >>> pl.show_axes_all()
| >>>
| >>> # display the window
| >>> pl.show()
|
| show_bounds(self, mesh=None, bounds=None, axes_ranges=None, show_xaxis=True, show_yaxis=True, show_zaxis=True, show_xlabels=True, show_ylabels=True, show_zlabels=True, bold=True, font_size=None, font_family=None, color=None, xtitle='X Axis', ytitle='Y Axis', ztitle='Z Axis', n_xlabels=5, n_ylabels=5, n_zlabels=5, use_2d=False, grid=None, location='closest', ticks=None, all_edges=False, corner_factor=0.5, fmt=None, minor_ticks=False, padding=0.0, use_3d_text=True, render=None, **kwargs)
| Add bounds axes.
|
| Shows the bounds of the most recent input mesh unless mesh is
| specified.
|
| Parameters
| ----------
| mesh : pyvista.DataSet | pyvista.MultiBlock, optional
| Input mesh to draw bounds axes around.
|
| bounds : sequence[float], optional
| Bounds to override mesh bounds in the form ``[xmin, xmax,
| ymin, ymax, zmin, zmax]``.
|
| axes_ranges : sequence[float], optional
| When set, these values override the values that are shown on the
| axes. This can be useful when plotting scaled datasets or if you wish
| to manually display different values. These values must be in the
| form:
|
| ``[xmin, xmax, ymin, ymax, zmin, zmax]``.
|
| show_xaxis : bool, default: True
| Makes X axis visible.
|
| show_yaxis : bool, default: True
| Makes Y axis visible.
|
| show_zaxis : bool, default: True
| Makes Z axis visible.
|
| show_xlabels : bool, default: True
| Shows X labels.
|
| show_ylabels : bool, default: True
| Shows Y labels.
|
| show_zlabels : bool, default: True
| Shows Z labels.
|
| bold : bool, default: True
| Bolds axis labels and numbers.
|
| font_size : float, optional
| Sets the size of the label font. Defaults to
| :attr:`pyvista.global_theme.font.size
| <pyvista.plotting.themes._Font.size>`.
|
| font_family : str, optional
| Font family. Must be either ``'courier'``, ``'times'``,
| or ``'arial'``. Defaults to :attr:`pyvista.global_theme.font.family
| <pyvista.plotting.themes._Font.family>`.
|
| color : ColorLike, optional
| Color of all labels and axis titles. Defaults to
| :attr:`pyvista.global_theme.font.color
| <pyvista.plotting.themes._Font.color>`.
|
| Either a string, RGB list, or hex color string. For
| example:
|
| * ``color='white'``
| * ``color='w'``
| * ``color=[1.0, 1.0, 1.0]``
| * ``color='#FFFFFF'``
|
| xtitle : str, default: "X Axis"
| Title of the X axis. Default ``"X Axis"``.
|
| ytitle : str, default: "Y Axis"
| Title of the Y axis. Default ``"Y Axis"``.
|
| ztitle : str, default: "Z Axis"
| Title of the Z axis. Default ``"Z Axis"``.
|
| n_xlabels : int, default: 5
| Number of labels for the X axis.
|
| n_ylabels : int, default: 5
| Number of labels for the Y axis.
|
| n_zlabels : int, default: 5
| Number of labels for the Z axis.
|
| use_2d : bool, default: False
| This can be enabled for smoother plotting.
|
| grid : bool or str, optional
| Add grid lines to the backface (``True``, ``'back'``, or
| ``'backface'``) or to the frontface (``'front'``,
| ``'frontface'``) of the axes actor.
|
| location : str, default: "closest"
| Set how the axes are drawn: either static (``'all'``), closest
| triad (``'front'``, ``'closest'``, ``'default'``), furthest triad
| (``'back'``, ``'furthest'``), static closest to the origin
| (``'origin'``), or outer edges (``'outer'``) in relation to the
| camera position.
|
| ticks : str, optional
| Set how the ticks are drawn on the axes grid. Options include:
| ``'inside', 'outside', 'both'``.
|
| all_edges : bool, default: False
| Adds an unlabeled and unticked box at the boundaries of
| plot. Useful for when wanting to plot outer grids while
| still retaining all edges of the boundary.
|
| corner_factor : float, default: 0.5
| If ``all_edges``, this is the factor along each axis to
| draw the default box. Default shows the full box.
|
| fmt : str, optional
| A format string defining how tick labels are generated from
| tick positions. A default is looked up on the active theme.
|
| minor_ticks : bool, default: False
| If ``True``, also plot minor ticks on all axes.
|
| padding : float, default: 0.0
| An optional percent padding along each axial direction to
| cushion the datasets in the scene from the axes
| annotations. Defaults no padding.
|
| use_3d_text : bool, default: True
| Use ``vtkTextActor3D`` for titles and labels.
|
| render : bool, optional
| If the render window is being shown, trigger a render
| after showing bounds.
|
| **kwargs : dict, optional
| Deprecated keyword arguments.
|
| Returns
| -------
| vtk.vtkCubeAxesActor
| Bounds actor.
|
| Examples
| --------
| >>> import pyvista as pv
| >>> from pyvista import examples
|
| >>> mesh = pv.Sphere()
| >>> plotter = pv.Plotter()
| >>> actor = plotter.add_mesh(mesh)
| >>> actor = plotter.show_bounds(
| ... grid='front',
| ... location='outer',
| ... all_edges=True,
| ... )
| >>> plotter.show()
|
| Control how many labels are displayed.
|
| >>> mesh = examples.load_random_hills()
|
| >>> plotter = pv.Plotter()
| >>> actor = plotter.add_mesh(
| ... mesh, cmap='terrain', show_scalar_bar=False
| ... )
| >>> actor = plotter.show_bounds(
| ... grid='back',
| ... location='outer',
| ... ticks='both',
| ... n_xlabels=2,
| ... n_ylabels=2,
| ... n_zlabels=2,
| ... xtitle='Easting',
| ... ytitle='Northing',
| ... ztitle='Elevation',
| ... )
| >>> plotter.show()
|
| Hide labels, but still show axis titles.
|
| >>> plotter = pv.Plotter()
| >>> actor = plotter.add_mesh(
| ... mesh, cmap='terrain', show_scalar_bar=False
| ... )
| >>> actor = plotter.show_bounds(
| ... grid='back',
| ... location='outer',
| ... ticks='both',
| ... show_xlabels=False,
| ... show_ylabels=False,
| ... show_zlabels=False,
| ... xtitle='Easting',
| ... ytitle='Northing',
| ... ztitle='Elevation',
| ... )
| >>> plotter.show()
|
| show_grid(self, **kwargs)
| Show grid lines and bounds axes labels.
|
| A wrapped implementation of :func:`show_bounds()
| <pyvista.Renderer.show_bounds>` to change default behavior to use
| grid lines and showing the axes labels on the outer edges.
|
| This is intended to be similar to :func:`matplotlib.pyplot.grid`.
|
| Parameters
| ----------
| **kwargs : dict, optional
| See :func:`Renderer.show_bounds` for additional keyword
| arguments.
|
| Returns
| -------
| vtk.vtkAxesActor
| Bounds actor.
|
| Examples
| --------
| >>> import pyvista as pv
| >>> mesh = pv.Cone()
| >>> pl = pv.Plotter()
| >>> _ = pl.add_mesh(mesh)
| >>> _ = pl.show_grid()
| >>> pl.show()
|
| store_click_position(self, *args)
| Store click position in viewport coordinates.
|
| store_mouse_position(self, *args)
| Store mouse position.
|
| subplot(self, index_row, index_column=None)
| Set the active subplot.
|
| Parameters
| ----------
| index_row : int
| Index of the subplot to activate along the rows.
|
| index_column : int, optional
| Index of the subplot to activate along the columns.
|
| Examples
| --------
| Create a 2 wide plot and set the background of right-hand plot
| to orange. Add a cube to the left plot and a sphere to the
| right.
|
| >>> import pyvista
| >>> pl = pyvista.Plotter(shape=(1, 2))
| >>> actor = pl.add_mesh(pyvista.Cube())
| >>> pl.subplot(0, 1)
| >>> actor = pl.add_mesh(pyvista.Sphere())
| >>> pl.set_background('orange', all_renderers=False)
| >>> pl.show()
|
| track_click_position(self, callback=None, side='right', double=False, viewport=False)
| Keep track of the click position.
|
| By default, it only tracks right clicks.
|
| Parameters
| ----------
| callback : callable, optional
| A callable method that will use the click position. Passes
| the click position as a length two tuple.
|
| side : str, default: "right"
| The mouse button to track (either ``'left'`` or ``'right'``).
| Also accepts ``'r'`` or ``'l'``.
|
| double : bool, default: False
| Track single clicks if ``False``, double clicks if ``True``.
| Defaults to single clicks.
|
| viewport : bool, default: False
| If ``True``, uses the normalized viewport coordinate
| system (values between 0.0 and 1.0 and support for HiDPI)
| when passing the click position to the callback.
|
| track_mouse_position(self)
| Keep track of the mouse position.
|
| This will potentially slow down the interactor. No callbacks
| supported here - use
| :func:`pyvista.Plotter.track_click_position` instead.
|
| unlink_views(self, views=None)
| Unlink the views' cameras.
|
| Parameters
| ----------
| views : int | tuple | list, optional
| If ``views`` is None unlink all the views, if ``views``
| is int unlink the selected view's camera or if ``views``
| is a tuple or a list, unlink the given views cameras.
|
| untrack_click_position(self, side='right')
| Stop tracking the click position.
|
| Parameters
| ----------
| side : str, optional
| The mouse button to stop tracking (either ``'left'`` or
| ``'right'``). Default is ``'right'``. Also accepts ``'r'``
| or ``'l'``.
|
| untrack_mouse_position(self)
| Stop tracking the mouse position.
|
| update(self, stime=1, force_redraw=True)
| Update window, redraw, process messages query.
|
| Parameters
| ----------
| stime : int, default: 1
| Duration of timer that interrupt vtkRenderWindowInteractor
| in milliseconds.
|
| force_redraw : bool, default: True
| Call ``render`` immediately.
|
| update_bounds_axes(self)
| Update the bounds axes of the render window.
|
| update_coordinates(self, points, mesh=None, render=True)
| Update the points of an object in the plotter.
|
| Parameters
| ----------
| points : np.ndarray
| Points to replace existing points.
|
| mesh : vtk.PolyData | vtk.UnstructuredGrid, optional
| Object that has already been added to the Plotter. If ``None``, uses
| last added mesh.
|
| render : bool, default: True
| Force a render when True.
|
| update_scalar_bar_range(self, clim, name=None)
| Update the value range of the active or named scalar bar.
|
| Parameters
| ----------
| clim : sequence[float]
| The new range of scalar bar. For example ``[-1, 2]``.
|
| name : str, optional
| The title of the scalar bar to update.
|
| update_scalars(self, scalars, mesh=None, render=True)
| Update scalars of an object in the plotter.
|
| Parameters
| ----------
| scalars : sequence
| Scalars to replace existing scalars.
|
| mesh : vtk.PolyData | vtk.UnstructuredGrid, optional
| Object that has already been added to the Plotter. If
| None, uses last added mesh.
|
| render : bool, default: True
| Force a render when True.
|
| view_isometric(self, negative=False, render=True)
| Reset the camera to a default isometric view.
|
| The view will show all the actors in the scene.
|
| Parameters
| ----------
| negative : bool, default: False
| View from the other isometric direction.
|
| render : bool, default: True
| If the render window is being shown, trigger a render
| after setting the camera position.
|
| Examples
| --------
| Isometric view.
|
| >>> from pyvista import demos
| >>> pl = demos.orientation_plotter()
| >>> pl.view_isometric()
| >>> pl.show()
|
| Negative isometric view.
|
| >>> from pyvista import demos
| >>> pl = demos.orientation_plotter()
| >>> pl.view_isometric(negative=True)
| >>> pl.show()
|
| view_vector(self, vector, viewup=None, render=True)
| Point the camera in the direction of the given vector.
|
| Parameters
| ----------
| vector : sequence[float]
| Direction to point the camera in.
|
| viewup : sequence[float], optional
| Sequence describing the view up of the camera.
|
| render : bool, default: True
| If the render window is being shown, trigger a render
| after setting the camera position.
|
| view_xy(self, negative=False, render=True)
| View the XY plane.
|
| Parameters
| ----------
| negative : bool, default: False
| View from the opposite direction.
|
| render : bool, default: True
| If the render window is being shown, trigger a render
| after setting the camera position.
|
| Examples
| --------
| View the XY plane of a built-in mesh example.
|
| >>> from pyvista import examples
| >>> import pyvista as pv
| >>> airplane = examples.load_airplane()
| >>> pl = pv.Plotter()
| >>> _ = pl.add_mesh(airplane)
| >>> pl.view_xy()
| >>> pl.show()
|
| view_xz(self, negative=False, render=True)
| View the XZ plane.
|
| Parameters
| ----------
| negative : bool, default: False
| View from the opposite direction.
|
| render : bool, default: True
| If the render window is being shown, trigger a render
| after setting the camera position.
|
| Examples
| --------
| View the XZ plane of a built-in mesh example.
|
| >>> from pyvista import examples
| >>> import pyvista as pv
| >>> airplane = examples.load_airplane()
| >>> pl = pv.Plotter()
| >>> _ = pl.add_mesh(airplane)
| >>> pl.view_xz()
| >>> pl.show()
|
| view_yx(self, negative=False, render=True)
| View the YX plane.
|
| Parameters
| ----------
| negative : bool, default: False
| View from the opposite direction.
|
| render : bool, default: True
| If the render window is being shown, trigger a render
| after setting the camera position.
|
| Examples
| --------
| View the YX plane of a built-in mesh example.
|
| >>> from pyvista import examples
| >>> import pyvista as pv
| >>> airplane = examples.load_airplane()
| >>> pl = pv.Plotter()
| >>> _ = pl.add_mesh(airplane)
| >>> pl.view_yx()
| >>> pl.show()
|
| view_yz(self, negative=False, render=True)
| View the YZ plane.
|
| Parameters
| ----------
| negative : bool, default: False
| View from the opposite direction.
|
| render : bool, default: True
| If the render window is being shown, trigger a render
| after setting the camera position.
|
| Examples
| --------
| View the YZ plane of a built-in mesh example.
|
| >>> from pyvista import examples
| >>> import pyvista as pv
| >>> airplane = examples.load_airplane()
| >>> pl = pv.Plotter()
| >>> _ = pl.add_mesh(airplane)
| >>> pl.view_yz()
| >>> pl.show()
|
| view_zx(self, negative=False, render=True)
| View the ZX plane.
|
| Parameters
| ----------
| negative : bool, default: False
| View from the opposite direction.
|
| render : bool, default: True
| If the render window is being shown, trigger a render
| after setting the camera position.
|
| Examples
| --------
| View the ZX plane of a built-in mesh example.
|
| >>> from pyvista import examples
| >>> import pyvista as pv
| >>> airplane = examples.load_airplane()
| >>> pl = pv.Plotter()
| >>> _ = pl.add_mesh(airplane)
| >>> pl.view_zx()
| >>> pl.show()
|
| view_zy(self, negative=False, render=True)
| View the ZY plane.
|
| Parameters
| ----------
| negative : bool, default: False
| View from the opposite direction.
|
| render : bool, default: True
| If the render window is being shown, trigger a render
| after setting the camera position.
|
| Examples
| --------
| View the ZY plane of a built-in mesh example.
|
| >>> from pyvista import examples
| >>> import pyvista as pv
| >>> airplane = examples.load_airplane()
| >>> pl = pv.Plotter()
| >>> _ = pl.add_mesh(airplane)
| >>> pl.view_zy()
| >>> pl.show()
|
| where_is(self, name)
| Return the subplot coordinates of a given actor.
|
| Parameters
| ----------
| name : str
| Actor's name.
|
| Returns
| -------
| list(tuple(int))
| A list with the subplot coordinates of the actor.
|
| Examples
| --------
| >>> import pyvista as pv
| >>> plotter = pv.Plotter(shape=(2, 2))
| >>> plotter.subplot(0, 0)
| >>> _ = plotter.add_mesh(pv.Box(), name='box')
| >>> plotter.subplot(0, 1)
| >>> _ = plotter.add_mesh(pv.Sphere(), name='sphere')
| >>> plotter.subplot(1, 0)
| >>> _ = plotter.add_mesh(pv.Box(), name='box')
| >>> plotter.subplot(1, 1)
| >>> _ = plotter.add_mesh(pv.Cone(), name='cone')
| >>> plotter.where_is('box')
| [(0, 0), (1, 0)]
|
| >>> plotter.show()
|
| window_size_context(self, window_size=None)
| Set the render window size in an isolated context.
|
| Parameters
| ----------
| window_size : sequence[int], optional
| Window size in pixels. Defaults to :attr:`pyvista.Plotter.window_size`.
|
| Examples
| --------
| Take two different screenshots with two different window sizes.
|
| >>> import pyvista as pv
| >>> pl = pv.Plotter(off_screen=True)
| >>> _ = pl.add_mesh(pv.Cube())
| >>> with pl.window_size_context((400, 400)):
| ... pl.screenshot('/tmp/small_screenshot.png') # doctest:+SKIP
| ...
| >>> with pl.window_size_context((1000, 1000)):
| ... pl.screenshot('/tmp/big_screenshot.png') # doctest:+SKIP
| ...
|
| write_frame(self)
| Write a single frame to the movie file.
|
| Examples
| --------
| >>> import pyvista
| >>> plotter = pyvista.Plotter()
| >>> plotter.open_movie(filename) # doctest:+SKIP
| >>> plotter.add_mesh(pyvista.Sphere()) # doctest:+SKIP
| >>> plotter.write_frame() # doctest:+SKIP
|
| See :ref:`movie_example` for a full example using this method.
|
| ----------------------------------------------------------------------
| Readonly properties inherited from pyvista.plotting.plotter.BasePlotter:
|
| actors
| Return the actors of the active renderer.
|
| Returns
| -------
| dict
| Dictionary of active actors.
|
| bounds
| Return the bounds of the active renderer.
|
| Returns
| -------
| tuple[float, float, float, float, float, float]
| Bounds of the active renderer.
|
| Examples
| --------
| >>> import pyvista
| >>> pl = pyvista.Plotter()
| >>> _ = pl.add_mesh(pyvista.Cube())
| >>> pl.bounds
| (-0.5, 0.5, -0.5, 0.5, -0.5, 0.5)
|
| center
| Return the center of the active renderer.
|
| image
| Return an image array of current render window.
|
| image_depth
| Return a depth image representing current render window.
|
| Helper attribute for ``get_image_depth``.
|
| legend
| Legend actor.
|
| There can only be one legend actor per renderer. If
| ``legend`` is ``None``, there is no legend actor.
|
| Returns
| -------
| vtk.vtkLegendBoxActor
| Legend actor.
|
| length
| Return the length of the diagonal of the bounding box of the scene.
|
| render_window
| Access the vtkRenderWindow attached to this plotter.
|
| If the plotter is closed, this will return ``None``.
|
| Returns
| -------
| vtk.vtkRenderWindow or None
| Render window if the plotter is not closed.
|
| Notes
| -----
| Subclass must set ``ren_win`` on initialization.
|
| renderer
| Return the active renderer.
|
| Returns
| -------
| pyvista.Renderer
| Active render.
|
| Examples
| --------
| >>> import pyvista
| >>> pl = pyvista.Plotter()
| >>> pl.renderer
| <Renderer(...) at ...>
|
| scalar_bar
| First scalar bar (kept for backwards compatibility).
|
| Returns
| -------
| vtk.vtkScalarBarActor
| First scalar bar actor.
|
| scalar_bars
| Scalar bars.
|
| Returns
| -------
| pyvista.ScalarBars
| Scalar bar object.
|
| Examples
| --------
| >>> import pyvista
| >>> sphere = pyvista.Sphere()
| >>> sphere['Data'] = sphere.points[:, 2]
| >>> plotter = pyvista.Plotter()
| >>> _ = plotter.add_mesh(sphere)
| >>> plotter.scalar_bars
| Scalar Bar Title Interactive
| "Data" False
|
| Select a scalar bar actor based on the title of the bar.
|
| >>> plotter.scalar_bars['Data']
| <vtkmodules.vtkRenderingAnnotation.vtkScalarBarActor(...) at ...>
|
| shape
| Return the shape of the plotter.
|
| Returns
| -------
| tuple
| Shape of the plotter.
|
| Examples
| --------
| Return the plotter shape.
|
| >>> import pyvista
| >>> plotter = pyvista.Plotter(shape=(2, 2))
| >>> plotter.shape
| (2, 2)
|
| ----------------------------------------------------------------------
| Data descriptors inherited from pyvista.plotting.plotter.BasePlotter:
|
| background_color
| Return the background color of the active render window.
|
| Examples
| --------
| Set the background color to ``"pink"`` and plot it.
|
| >>> import pyvista as pv
| >>> pl = pv.Plotter()
| >>> _ = pl.add_mesh(pv.Cube(), show_edges=True)
| >>> pl.background_color = "pink"
| >>> pl.background_color
| Color(name='pink', hex='#ffc0cbff', opacity=255)
| >>> pl.show()
|
| camera
| Return the active camera of the active renderer.
|
| Returns
| -------
| pyvista.Camera
| Camera from the active renderer.
|
| camera_position
| Return camera position of the active render window.
|
| Examples
| --------
| Return camera's position and then reposition it via a list of tuples.
|
| >>> import pyvista as pv
| >>> from pyvista import examples
| >>> mesh = examples.download_bunny_coarse()
| >>> pl = pv.Plotter()
| >>> _ = pl.add_mesh(mesh, show_edges=True, reset_camera=True)
| >>> pl.camera_position
| [(0.02430, 0.0336, 0.9446),
| (0.02430, 0.0336, -0.02225),
| (0.0, 1.0, 0.0)]
| >>> pl.camera_position = [
| ... (0.3914, 0.4542, 0.7670),
| ... (0.0243, 0.0336, -0.0222),
| ... (-0.2148, 0.8998, -0.3796),
| ... ]
| >>> pl.show()
|
| Set the camera position using a string and look at the ``'xy'`` plane.
|
| >>> pl = pv.Plotter()
| >>> _ = pl.add_mesh(mesh, show_edges=True)
| >>> pl.camera_position = 'xy'
| >>> pl.show()
|
| Set the camera position using a string and look at the ``'zy'`` plane.
|
| >>> pl = pv.Plotter()
| >>> _ = pl.add_mesh(mesh, show_edges=True)
| >>> pl.camera_position = 'zy'
| >>> pl.show()
|
| For more examples, see :ref:`cameras_api`.
|
| camera_set
| Return or set if the camera of the active renderer has been set.
|
| image_scale
| Get or set the scale factor when saving a screenshot.
|
| This will scale up the screenshots taken of the render window to save a
| higher resolution image than what is rendered on screen.
|
| Image sizes will be the :py:attr:`window_size
| <pyvista.Plotter.window_size>` multiplied by this scale factor.
|
| Returns
| -------
| int
| Image scale factor.
|
| Examples
| --------
| Double the resolution of a screenshot.
|
| >>> import pyvista as pv
| >>> pl = pv.Plotter()
| >>> _ = pl.add_mesh(pv.Sphere())
| >>> pl.image_scale = 2
| >>> pl.screenshot('screenshot.png') # doctest:+SKIP
|
| Set the image scale from ``Plotter``.
|
| >>> import pyvista as pv
| >>> pl = pv.Plotter(image_scale=2)
| >>> _ = pl.add_mesh(pv.Sphere())
| >>> pl.screenshot('screenshot.png') # doctest:+SKIP
|
| parallel_projection
| Return or set parallel projection state of active render window.
|
| parallel_scale
| Return or set parallel scale of active render window.
|
| pickable_actors
| Return or set the pickable actors.
|
| When setting, this will be the list of actors to make
| pickable. All actors not in the list will be made unpickable.
| If ``actors`` is ``None``, all actors will be made unpickable.
|
| Returns
| -------
| list[pyvista.Actor]
| List of actors.
|
| Examples
| --------
| Add two actors to a :class:`pyvista.Plotter`, make one
| pickable, and then list the pickable actors.
|
| >>> import pyvista as pv
| >>> pl = pv.Plotter()
| >>> sphere_actor = pl.add_mesh(pv.Sphere())
| >>> cube_actor = pl.add_mesh(
| ... pv.Cube(), pickable=False, style='wireframe'
| ... )
| >>> len(pl.pickable_actors)
| 1
|
| Set the pickable actors to both actors.
|
| >>> pl.pickable_actors = [sphere_actor, cube_actor]
| >>> len(pl.pickable_actors)
| 2
|
| Set the pickable actors to ``None``.
|
| >>> pl.pickable_actors = None
| >>> len(pl.pickable_actors)
| 0
|
| scale
| Return the scaling of the active renderer.
|
| store_image
| Store last rendered frame on close.
|
| .. deprecated:: 0.38.0
| ``store_image`` is no longer used. Images are automatically cached
| as needed.
|
| suppress_rendering
| Get or set whether to suppress render calls.
|
| Returns
| -------
| bool
| ``True`` when rendering is suppressed.
|
| theme
| Return or set the theme used for this plotter.
|
| Returns
| -------
| pyvista.Theme
| Theme of this plotter.
|
| Examples
| --------
| Use the dark theme for a plotter.
|
| >>> import pyvista
| >>> from pyvista import themes
| >>> pl = pyvista.Plotter()
| >>> pl.theme = themes.DarkTheme()
| >>> actor = pl.add_mesh(pyvista.Sphere())
| >>> pl.show()
|
| window_size
| Return the render window size in ``(width, height)``.
|
| Examples
| --------
| Change the window size from ``200 x 200`` to ``400 x 400``.
|
| >>> import pyvista
| >>> pl = pyvista.Plotter(window_size=[200, 200])
| >>> pl.window_size
| [200, 200]
| >>> pl.window_size = [400, 400]
| >>> pl.window_size
| [400, 400]
|
| ----------------------------------------------------------------------
| Data and other attributes inherited from pyvista.plotting.plotter.BasePlotter:
|
| click_position = None
|
| mouse_position = None
|
| ----------------------------------------------------------------------
| Methods inherited from pyvista.plotting.picking.PickingHelper:
|
| enable_fly_to_right_click(self, callback=None)
| Set the camera to track right click positions.
|
| A convenience method to track right click positions and fly to
| the picked point in the scene. The callback will be passed the
| point in 3D space.
|
| Parameters
| ----------
| callback : callable
| Callback to call immediately after right clicking.
|
| enable_geodesic_picking(self, callback=None, show_message=True, font_size=18, color='pink', point_size=10, line_width=5, tolerance=0.025, show_path=True, keep_order=True, **kwargs)
| Enable picking at geodesic paths.
|
| This is a convenience method for ``enable_point_picking`` to
| keep track of the picked points and create a geodesic path
| using those points.
|
| The geodesic path is saved to the ``.picked_geodesic``
| attribute of this plotter.
|
| Parameters
| ----------
| callback : callable, optional
| When given, calls this callable after a pick is made. The
| entire picked, geodesic path is passed as the only
| parameter to this callable.
|
| show_message : bool | str, default: True
| Show the message about how to use the point picking
| tool. If this is a string, that will be the message shown.
|
| font_size : int, default: 18
| Sets the size of the message.
|
| color : ColorLike, default: "pink"
| The color of the selected mesh when shown.
|
| point_size : int, default: 10
| Size of picked points if ``show_path`` is ``True``.
|
| line_width : float, default: 5.0
| Thickness of path representation if ``show_path`` is
| ``True``.
|
| tolerance : float, default: 0.025
| Specify tolerance for performing pick operation. Tolerance
| is specified as fraction of rendering window
| size. Rendering window size is measured across diagonal.
|
| show_path : bool, default: True
| Show the picked path interactively.
|
| keep_order : bool, default: True
| If ``True``, the created geodesic path is a single ordered
| and cleaned line from the first point to the last.
|
| .. note::
|
| In older versions there were apparent discontinuities
| in the resulting path due to the behavior of the
| underlying VTK filter which corresponds to
| ``keep_order=False``.
|
| .. versionadded:: 0.32.0
|
| **kwargs : dict, optional
| All remaining keyword arguments are used to control how
| the picked path is interactively displayed.
|
| enable_horizon_picking(self, callback=None, normal=(0.0, 0.0, 1.0), width=None, show_message=True, font_size=18, color='pink', point_size=10, line_width=5, show_path=True, opacity=0.75, show_horizon=True, **kwargs)
| Enable horizon picking.
|
| Helper for the ``enable_path_picking`` method to also show a
| ribbon surface along the picked path. Ribbon is saved under
| ``.picked_horizon``.
|
| Parameters
| ----------
| callback : callable, optional
| When given, calls this callable after a pick is made. The
| entire picked path is passed as the only parameter to this
| callable.
|
| normal : sequence[float], default: (0.0, 0.0, 1.0)
| The normal to the horizon surface's projection plane.
|
| width : float, optional
| The width of the horizon surface. Default behaviour will
| dynamically change the surface width depending on its
| length.
|
| show_message : bool | str, default: True
| Show the message about how to use the horizon picking
| tool. If this is a string, that will be the message shown.
|
| font_size : int, default: 18
| Sets the font size of the message.
|
| color : ColorLike, default: "pink"
| The color of the horizon surface if shown.
|
| point_size : int, default: 10
| Size of picked points if ``show_horizon`` is ``True``.
|
| line_width : float, default: 5.0
| Thickness of path representation if ``show_horizon`` is
| ``True``.
|
| show_path : bool, default: True
| Show the picked path that the horizon is built from
| interactively.
|
| opacity : float, default: 0.75
| The opacity of the horizon surface if shown.
|
| show_horizon : bool, default: True
| Show the picked horizon surface interactively.
|
| **kwargs : dict, optional
| All remaining keyword arguments are used to control how
| the picked path is interactively displayed.
|
| enable_path_picking(self, callback=None, show_message=True, font_size=18, color='pink', point_size=10, line_width=5, show_path=True, tolerance=0.025, **kwargs)
| Enable picking at paths.
|
| This is a convenience method for :func:`enable_point_picking
| <pyvista.Plotter.enable_point_picking>` to keep track of the
| picked points and create a line using those points.
|
| The line is saved to the ``.picked_path`` attribute of this
| plotter
|
| Parameters
| ----------
| callback : callable, optional
| When given, calls this callable after a pick is made. The
| entire picked path is passed as the only parameter to this
| callable.
|
| show_message : bool | str, default: True
| Show the message about how to use the point picking
| tool. If this is a string, that will be the message shown.
|
| font_size : int, default: 18
| Sets the size of the message.
|
| color : ColorLike, default: "pink"
| The color of the selected mesh when shown.
|
| point_size : int, default: 10
| Size of picked points if ``show_path`` is ``True``.
|
| line_width : float, default: 5.0
| Thickness of path representation if ``show_path`` is
| ``True``.
|
| show_path : bool, default: True
| Show the picked path interactively.
|
| tolerance : float, default: 0.025
| Specify tolerance for performing pick operation. Tolerance
| is specified as fraction of rendering window
| size. Rendering window size is measured across diagonal.
|
| **kwargs : dict, optional
| All remaining keyword arguments are used to control how
| the picked path is interactively displayed.
|
| fly_to_mouse_position(self, focus=False)
| Focus on last stored mouse position.
|
| ----------------------------------------------------------------------
| Methods inherited from pyvista.plotting.picking.PickingMethods:
|
| disable_picking(self)
| Disable any active picking and remove observers.
|
| Examples
| --------
| Enable and then disable picking.
|
| >>> import pyvista as pv
| >>> mesh = pv.Sphere(center=(1, 0, 0))
| >>> cube = pv.Cube()
| >>> pl = pv.Plotter()
| >>> _ = pl.add_mesh(mesh)
| >>> _ = pl.add_mesh(cube)
| >>> _ = pl.enable_mesh_picking()
| >>> pl.disable_picking()
|
| enable_block_picking(self, callback=None, side='left')
| Enable composite block picking.
|
| Use this picker to return the index of a DataSet when using composite
| dataset like :class:`pyvista.MultiBlock` and pass it to a callback.
|
| Parameters
| ----------
| callback : callable, optional
| When input, this picker calls this callable after a selection is
| made. The composite index is passed to ``callback`` as the first
| argument and the dataset as the second argument.
|
| side : str, default: "left"
| The mouse button to track (either ``'left'`` or ``'right'``).
| Also accepts ``'r'`` or ``'l'``.
|
| Notes
| -----
| The picked block index can be accessed from :attr:`picked_block_index
| <pyvista.Plotter.picked_block_index>` attribute.
|
| Examples
| --------
| Enable block picking with a multiblock dataset. Left clicking will turn
| blocks blue while right picking will turn the block back to the default
| color.
|
| >>> import pyvista as pv
| >>> multiblock = pv.MultiBlock(
| ... [pv.Cube(), pv.Sphere(center=(0, 0, 1))]
| ... )
| >>> pl = pv.Plotter()
| >>> actor, mapper = pl.add_composite(multiblock)
| >>> def turn_blue(index, dataset):
| ... mapper.block_attr[index].color = 'blue'
| ...
| >>> pl.enable_block_picking(callback=turn_blue, side='left')
| >>> def clear_color(index, dataset):
| ... mapper.block_attr[index].color = None
| ...
| >>> pl.enable_block_picking(callback=clear_color, side='right')
| >>> pl.show()
|
| enable_cell_picking(self, callback=None, through=True, show=True, show_message=True, style='wireframe', line_width=5, color='pink', font_size=18, start=False, show_frustum=False, **kwargs)
| Enable picking of cells with a rectangle selection tool.
|
| Press ``"r"`` to enable retangle based selection. Press
| ``"r"`` again to turn it off. Selection will be saved to
| ``self.picked_cells``.
|
| All meshes in the scene are available for picking by default.
| If you would like to only pick a single mesh in the scene,
| use the ``pickable=False`` argument when adding the other
| meshes to the scene.
|
| When multiple meshes are being picked, the picked cells
| in ``self.picked_cells`` will be a :class:`MultiBlock`
| dataset for each mesh's selection.
|
| Uses last input mesh for input by default.
|
| .. warning::
| Visible cell picking (``through=False``) will only work if
| the mesh is displayed with a ``'surface'`` representation
| style (the default).
|
| Parameters
| ----------
| callback : callable, optional
| When input, calls this callable after a selection is made.
| The picked_cells are input as the first parameter to this
| callable.
|
| through : bool, default: True
| When ``True`` the picker will select all cells
| through the mesh(es). When ``False``, the picker will select
| only visible cells on the selected surface(s).
|
| show : bool, default: True
| Show the selection interactively.
|
| show_message : bool | str, default: True
| Show the message about how to use the cell picking tool. If this
| is a string, that will be the message shown.
|
| style : str, default: "wireframe"
| Visualization style of the selection. One of the
| following: ``style='surface'``, ``style='wireframe'``, or
| ``style='points'``.
|
| line_width : float, default: 5.0
| Thickness of selected mesh edges.
|
| color : ColorLike, default: "pink"
| The color of the selected mesh when shown.
|
| font_size : int, default: 18
| Sets the font size of the message.
|
| start : bool, default: True
| Automatically start the cell selection tool.
|
| show_frustum : bool, default: False
| Show the frustum in the scene.
|
| **kwargs : dict, optional
| All remaining keyword arguments are used to control how
| the selection is interactively displayed.
|
| Examples
| --------
| Add a mesh and a cube to a plot and enable cell picking.
|
| >>> import pyvista as pv
| >>> mesh = pv.Sphere(center=(1, 0, 0))
| >>> cube = pv.Cube()
| >>> pl = pv.Plotter()
| >>> _ = pl.add_mesh(mesh)
| >>> _ = pl.add_mesh(cube)
| >>> _ = pl.enable_cell_picking()
|
| enable_element_picking(self, callback=None, mode='cell', show=True, show_message=True, font_size=18, color='pink', tolerance=0.025, pickable_window=False, left_clicking=False, picker=<PickerType.CELL: 1>, **kwargs)
| Select individual elements on a mesh.
|
| Parameters
| ----------
| callback : callable, optional
| When input, calls this callable after a selection is made. The
| ``mesh`` is input as the first parameter to this callable.
|
| mode : str | ElementType, default: "cell"
| The picking mode. Either ``"mesh"``, ``"cell"``, ``"face"``,
| ``"edge"``, or ``"point"``.
|
| show : bool, default: True
| Show the selection interactively.
|
| show_message : bool | str, default: True
| Show the message about how to use the mesh picking tool. If this
| is a string, that will be the message shown.
|
| font_size : int, default: 18
| Sets the font size of the message.
|
| color : ColorLike, default: "pink"
| The color of the selected mesh when shown.
|
| tolerance : float, default: 0.025
| Specify tolerance for performing pick operation. Tolerance
| is specified as fraction of rendering window
| size. Rendering window size is measured across diagonal.
|
| .. warning::
| This is ignored with the ``'hardware'`` ``picker``.
|
| pickable_window : bool, default: False
| When ``True``, points in the 3D window are pickable.
|
| left_clicking : bool, default: False
| When ``True``, meshes can be picked by clicking the left
| mousebutton.
|
| .. note::
| If enabled, left-clicking will **not** display the bounding box
| around the picked mesh.
|
| picker : str | PickerType, optional
| Choice of VTK picker class type:
|
| * ``'hardware'``: Uses ``vtkHardwarePicker`` which is more
| performant for large geometries (default).
| * ``'cell'``: Uses ``vtkCellPicker``.
| * ``'point'``: Uses ``vtkPointPicker`` which will snap to
| points on the surface of the mesh.
| * ``'volume'``: Uses ``vtkVolumePicker``.
|
| **kwargs : dict, optional
| All remaining keyword arguments are used to control how
| the picked path is interactively displayed.
|
| enable_mesh_picking(self, callback=None, show=True, show_message=True, style='wireframe', line_width=5, color='pink', font_size=18, left_clicking=False, use_actor=False, picker=<PickerType.CELL: 1>, **kwargs)
| Enable picking of a mesh.
|
| Parameters
| ----------
| callback : callable, optional
| When input, calls this callable after a selection is made. The
| ``mesh`` is input as the first parameter to this callable.
|
| show : bool, default: True
| Show the selection interactively. Best when combined with
| ``left_clicking``.
|
| show_message : bool | str, default: True
| Show the message about how to use the mesh picking tool. If this
| is a string, that will be the message shown.
|
| style : str, default: "wireframe"
| Visualization style of the selection. One of the following:
|
| * ``'surface'``
| * ``'wireframe'``
| * ``'points'``
|
| line_width : float, default: 5.0
| Thickness of selected mesh edges.
|
| color : ColorLike, default: "pink"
| The color of the selected mesh when shown.
|
| font_size : int, default: 18
| Sets the font size of the message.
|
| left_clicking : bool, default: False
| When ``True``, meshes can be picked by clicking the left
| mousebutton.
|
| .. note::
| If enabled, left-clicking will **not** display the bounding box
| around the picked point.
|
| use_actor : bool, default: False
| If True, the callback will be passed the picked actor instead of
| the mesh object.
|
| picker : str | PickerType, optional
| Choice of VTK picker class type:
|
| * ``'hardware'``: Uses ``vtkHardwarePicker`` which is more
| performant for large geometries (default).
| * ``'cell'``: Uses ``vtkCellPicker``.
| * ``'point'``: Uses ``vtkPointPicker`` which will snap to
| points on the surface of the mesh.
| * ``'volume'``: Uses ``vtkVolumePicker``.
|
|
| **kwargs : dict, optional
| All remaining keyword arguments are used to control how
| the picked path is interactively displayed.
|
| Returns
| -------
| vtk.vtkPropPicker
| Property picker.
|
| Examples
| --------
| Add a sphere and a cube to a plot and enable mesh picking. Enable
| ``left_clicking`` to immediately start picking on the left click and
| disable showing the box. You can still press the ``p`` key to select
| meshes.
|
| >>> import pyvista as pv
| >>> mesh = pv.Sphere(center=(1, 0, 0))
| >>> cube = pv.Cube()
| >>> pl = pv.Plotter()
| >>> _ = pl.add_mesh(mesh)
| >>> _ = pl.add_mesh(cube)
| >>> _ = pl.enable_mesh_picking()
|
| See :ref:`mesh_picking_example` for a full example using this method.
|
| enable_rectangle_through_picking(self, callback=None, show=True, style='wireframe', line_width=5, color='pink', show_message=True, font_size=18, start=False, show_frustum=False, **kwargs)
| Enable rectangle based cell picking through the scene.
|
| Parameters
| ----------
| callback : callable, optional
| When input, calls this callable after a selection is made.
| The picked cells is the only passed argument.
|
| show : bool, default: True
| Show the selection interactively.
|
| style : str, default: "wireframe"
| Visualization style of the selection frustum. One of the
| following: ``style='surface'``, ``style='wireframe'``, or
| ``style='points'``.
|
| line_width : float, default: 5.0
| Thickness of selected mesh edges.
|
| color : ColorLike, default: "pink"
| The color of the selected frustum when shown.
|
| show_message : bool | str, default: True
| Show the message about how to use the cell picking tool. If this
| is a string, that will be the message shown.
|
| font_size : int, default: 18
| Sets the font size of the message.
|
| start : bool, default: True
| Automatically start the cell selection tool.
|
| show_frustum : bool, default: False
| Show the frustum in the scene.
|
| **kwargs : dict, optional
| All remaining keyword arguments are used to control how
| the selection frustum is interactively displayed.
|
| enable_rectangle_visible_picking(self, callback=None, show=True, style='wireframe', line_width=5, color='pink', show_message=True, font_size=18, start=False, show_frustum=False, **kwargs)
| Enable rectangle based cell picking on visible surfaces.
|
| Parameters
| ----------
| callback : callable, optional
| When input, calls this callable after a selection is made.
| The picked cells is the only passed argument.
|
| show : bool, default: True
| Show the selection interactively.
|
| style : str, default: "wireframe"
| Visualization style of the selection frustum. One of the
| following: ``style='surface'``, ``style='wireframe'``, or
| ``style='points'``.
|
| line_width : float, default: 5.0
| Thickness of selected mesh edges.
|
| color : ColorLike, default: "pink"
| The color of the selected frustum when shown.
|
| show_message : bool | str, default: True
| Show the message about how to use the cell picking tool. If this
| is a string, that will be the message shown.
|
| font_size : int, default: 18
| Sets the font size of the message.
|
| start : bool, default: True
| Automatically start the cell selection tool.
|
| show_frustum : bool, default: False
| Show the frustum in the scene.
|
| **kwargs : dict, optional
| All remaining keyword arguments are used to control how
| the selection frustum is interactively displayed.
|
| enable_surface_picking(self, *args, **kwargs)
| Surface picking.
|
| .. deprecated:: 0.40.0
| This method has been renamed to ``enable_surface_point_picking``.
|
| Parameters
| ----------
| *args : tuple
| Positional arguments.
|
| **kwargs : dict
| Keyword arguments.
|
| enable_surface_point_picking(self, callback=None, show_message=True, font_size=18, color='pink', show_point=True, point_size=10, tolerance=0.025, pickable_window=False, left_clicking=False, picker=<PickerType.CELL: 1>, use_picker=False, clear_on_no_selection=True, **kwargs)
| Enable picking of a point on the surface of a mesh.
|
| Parameters
| ----------
| callback : callable, optional
| When input, calls this callable after a selection is made. The
| ``mesh`` is input as the first parameter to this callable.
|
| show_message : bool | str, default: True
| Show the message about how to use the mesh picking tool. If this
| is a string, that will be the message shown.
|
| font_size : int, default: 18
| Sets the font size of the message.
|
| color : ColorLike, default: "pink"
| The color of the selected mesh when shown.
|
| show_point : bool, default: True
| Show the selection interactively.
|
| point_size : int, default: 10
| Size of picked points if ``show_point`` is ``True``.
|
| tolerance : float, default: 0.025
| Specify tolerance for performing pick operation. Tolerance
| is specified as fraction of rendering window
| size. Rendering window size is measured across diagonal.
|
| .. warning::
| This is ignored with the ``'hardware'`` ``picker``.
|
| pickable_window : bool, default: False
| When ``True``, points in the 3D window are pickable.
|
| left_clicking : bool, default: False
| When ``True``, meshes can be picked by clicking the left
| mousebutton.
|
| .. note::
| If enabled, left-clicking will **not** display the bounding box
| around the picked mesh.
|
| picker : str | PickerType, optional
| Choice of VTK picker class type:
|
| * ``'hardware'``: Uses ``vtkHardwarePicker`` which is more
| performant for large geometries (default).
| * ``'cell'``: Uses ``vtkCellPicker``.
| * ``'point'``: Uses ``vtkPointPicker`` which will snap to
| points on the surface of the mesh.
| * ``'volume'``: Uses ``vtkVolumePicker``.
|
| use_picker : bool, default: False
| When ``True``, the callback will also be passed the picker.
|
| clear_on_no_selection : bool, default: True
| Clear the selections when no point is selected.
|
| **kwargs : dict, optional
| All remaining keyword arguments are used to control how
| the picked path is interactively displayed.
|
| Notes
| -----
| Picked point can be accessed from :attr:`picked_point
| <pyvista.Plotter.picked_point>` attribute.
|
| Examples
| --------
| Add a cube to a plot and enable cell picking.
|
| >>> import pyvista as pv
| >>> cube = pv.Cube()
| >>> pl = pv.Plotter()
| >>> _ = pl.add_mesh(cube)
| >>> _ = pl.enable_surface_point_picking()
|
| See :ref:`surface_point_picking_example` for a full example using this method.
|
| ----------------------------------------------------------------------
| Readonly properties inherited from pyvista.plotting.picking.PickingMethods:
|
| picked_actor
| Return the picked mesh.
|
| This returns the picked actor after selecting a mesh with
| :func:`enable_surface_point_picking <pyvista.Plotter.enable_surface_point_picking>` or
| :func:`enable_mesh_picking <pyvista.Plotter.enable_mesh_picking>`.
|
| Returns
| -------
| pyvista.Actor or None
| Picked actor if available.
|
| picked_block_index
| Return the picked block index.
|
| This returns the picked block index after selecting a point with
| :func:`enable_point_picking <pyvista.Plotter.enable_point_picking>`.
|
| Returns
| -------
| int or None
| Picked block if available. If ``-1``, then a non-composite dataset
| was selected.
|
| picked_cell
| Return the picked cell.
|
| This returns the picked cell after selecting a cell.
|
| Returns
| -------
| pyvista.Cell or None
| Picked cell if available.
|
| picked_cells
| Return the picked cells.
|
| This returns the picked cells after selecting cells.
|
| Returns
| -------
| pyvista.Cell or None
| Picked cell if available.
|
| picked_mesh
| Return the picked mesh.
|
| This returns the picked mesh after selecting a mesh with
| :func:`enable_surface_point_picking <pyvista.Plotter.enable_surface_point_picking>` or
| :func:`enable_mesh_picking <pyvista.Plotter.enable_mesh_picking>`.
|
| Returns
| -------
| pyvista.DataSet or None
| Picked mesh if available.
|
| ----------------------------------------------------------------------
| Methods inherited from pyvista.plotting.picking.PickingInterface:
|
| enable_point_picking(self, callback=None, tolerance=0.025, left_clicking=False, picker=<PickerType.POINT: 3>, show_message=True, font_size=18, color='pink', point_size=10, show_point=True, use_picker=False, pickable_window=False, clear_on_no_selection=True, **kwargs)
| Enable picking at points under the cursor.
|
| Enable picking a point at the mouse location in the render
| view using the right mouse button. This point is saved to the
| ``.picked_point`` attribute on the plotter. Pass a callback
| that takes that point as an argument. The picked
| point can either be a point on the first intersecting mesh, or
| a point in the 3D window.
|
| The ``picker`` choice will help determine how the point picking
| is performed.
|
| Parameters
| ----------
| callback : callable, optional
| When input, calls this callable after a pick is made. The
| picked point is input as the first parameter to this
| callable.
|
| tolerance : float, tolerance: 0.025
| Specify tolerance for performing pick operation. Tolerance
| is specified as fraction of rendering window
| size. Rendering window size is measured across diagonal.
| This is only valid for some choices of ``picker``.
|
| left_clicking : bool, default: False
| When ``True``, points can be picked by clicking the left mouse
| button. Default is to use the right mouse button.
|
| picker : str | PickerType, optional
| Choice of VTK picker class type:
|
| * ``'hardware'``: Uses ``vtkHardwarePicker`` which is more
| performant for large geometries (default).
| * ``'cell'``: Uses ``vtkCellPicker``.
| * ``'point'``: Uses ``vtkPointPicker`` which will snap to
| points on the surface of the mesh.
| * ``'volume'``: Uses ``vtkVolumePicker``.
|
| show_message : bool | str, default: True
| Show the message about how to use the point picking
| tool. If this is a string, that will be the message shown.
|
| font_size : int, default: 18
| Sets the size of the message.
|
| color : ColorLike, default: "pink"
| The color of the selected mesh when shown.
|
| point_size : int, default: 10
| Size of picked points if ``show_point`` is ``True``.
|
| show_point : bool, default: True
| Show the picked point after clicking.
|
| use_picker : bool, default: False
| When ``True``, the callback will also be passed the picker.
|
| pickable_window : bool, default: False
| When ``True`` and the chosen picker supports it, points in the
| 3D window are pickable.
|
| clear_on_no_selection : bool, default: True
| Clear the selections when no point is selected.
|
| **kwargs : dict, optional
| All remaining keyword arguments are used to control how
| the picked point is interactively displayed.
|
| Examples
| --------
| Enable point picking with a custom message.
|
| >>> import pyvista as pv
| >>> pl = pv.Plotter()
| >>> _ = pl.add_mesh(pv.Sphere())
| >>> _ = pl.add_mesh(pv.Cube(), pickable=False)
| >>> pl.enable_point_picking(show_message='Pick a point')
|
| See :ref:`point_picking_example` for a full example using this method.
|
| enable_rectangle_picking(self, callback=None, show_message=True, font_size=18, start=False, show_frustum=False, style='wireframe', color='pink', **kwargs)
| Enable rectangle based picking at cells.
|
| Press ``"r"`` to enable retangle based selection. Press
| ``"r"`` again to turn it off.
|
| Picking with the rectangle selection tool provides two values that
| are passed as the ``RectangleSelection`` object in the callback:
|
| 1. ``RectangleSelection.viewport``: the viewport coordinates of the
| selection rectangle.
| 2. ``RectangleSelection.frustum``: the full frustum made from
| the selection rectangle into the scene.
|
| Parameters
| ----------
| callback : callable, optional
| When input, calls this callable after a selection is made.
| The ``RectangleSelection`` is the only passed argument
| containing the viewport coordinates of the selection and the
| projected frustum.
|
| show_message : bool | str, default: True
| Show the message about how to use the cell picking tool. If this
| is a string, that will be the message shown.
|
| font_size : int, default: 18
| Sets the font size of the message.
|
| start : bool, default: True
| Automatically start the cell selection tool.
|
| show_frustum : bool, default: False
| Show the frustum in the scene.
|
| style : str, default: "wireframe"
| Visualization style of the selection frustum. One of the
| following: ``style='surface'``, ``style='wireframe'``, or
| ``style='points'``.
|
| color : ColorLike, default: "pink"
| The color of the selected frustum when shown.
|
| **kwargs : dict, optional
| All remaining keyword arguments are used to control how
| the selection frustum is interactively displayed.
|
| Examples
| --------
| Add a mesh and a cube to a plot and enable cell picking.
|
| >>> import pyvista as pv
| >>> mesh = pv.Sphere(center=(1, 0, 0))
| >>> cube = pv.Cube()
| >>> pl = pv.Plotter()
| >>> _ = pl.add_mesh(mesh)
| >>> _ = pl.add_mesh(cube)
| >>> _ = pl.enable_rectangle_picking()
|
| get_pick_position(self)
| Get the pick position or area.
|
| Returns
| -------
| sequence
| Picked position or area as ``(x0, y0, x1, y1)``.
|
| pick_click_position(self)
| Get corresponding click location in the 3D plot.
|
| Returns
| -------
| tuple
| Three item tuple with the 3D picked position.
|
| pick_mouse_position(self)
| Get corresponding mouse location in the 3D plot.
|
| Returns
| -------
| tuple
| Three item tuple with the 3D picked position.
|
| ----------------------------------------------------------------------
| Readonly properties inherited from pyvista.plotting.picking.PickingInterface:
|
| picked_point
| Return the picked point.
|
| This returns the picked point after selecting a point.
|
| Returns
| -------
| numpy.ndarray or None
| Picked point if available.
|
| ----------------------------------------------------------------------
| Methods inherited from pyvista.plotting.widgets.WidgetHelper:
|
| add_affine_transform_widget(self, actor, origin=None, start=True, scale=0.15, line_radius=0.02, always_visible=True, axes_colors=None, axes=None, release_callback=None, interact_callback=None)
| Add a 3D affine transform widget.
|
| This widget allows interactive transformations including translation and
| rotation using the left mouse button.
|
| Parameters
| ----------
| actor : pyvista.Actor
| The actor to which the widget is attached to.
| origin : sequence[float], optional
| Origin of the widget. Default is the origin of the main actor.
| start : bool, default: True
| If True, start the widget immediately.
| scale : float, default: 0.15
| Scale factor for the widget relative to the length of the actor.
| line_radius : float, default: 0.02
| Relative radius of the lines composing the widget.
| always_visible : bool, default: True
| Make the widget always visible. Setting this to ``False`` will cause
| the widget geometry to be hidden by other actors in the plotter.
| axes_colors : tuple[ColorLike], optional
| Uses the theme by default. Configure the individual axis colors by
| modifying either the theme with ``pv.global_theme.axes.x_color =
| <COLOR>`` or setting this with a ``tuple`` as in ``('r', 'g', 'b')``.
| axes : numpy.ndarray, optional
| ``(3, 3)`` Numpy array defining the X, Y, and Z axes. By default
| this matches the default coordinate system.
| release_callback : callable, optional
| Call this method when releasing the left mouse button. It is passed
| the ``user_matrix`` of the actor.
| interact_callback : callable, optional
| Call this method when moving the mouse with the left mouse button
| pressed down and a valid movement actor selected. It is passed the
| ``user_matrix`` of the actor.
|
| Returns
| -------
| pyvista.widgets.AffineWidget3D
| The affine widget.
|
| Notes
| -----
| After interacting with the actor, the transform will be stored within
| :attr:`pyvista.Actor.user_matrix` but will not be applied to the
| dataset. Use this matrix in conjunction with
| :func:`pyvista.DataSetFilters.transform` to transform the dataset.
|
| Examples
| --------
| Add the 3d affine widget.
|
| >>> import pyvista as pv
| >>> pl = pv.Plotter()
| >>> actor = pl.add_mesh(pv.Sphere())
| >>> widget = pl.add_affine_transform_widget(actor)
| >>> pl.show()
|
| Access the transform from the actor.
|
| >>> actor.user_matrix
| array([[1., 0., 0., 0.],
| [0., 1., 0., 0.],
| [0., 0., 1., 0.],
| [0., 0., 0., 1.]])
|
| add_box_widget(self, callback, bounds=None, factor=1.25, rotation_enabled=True, color=None, use_planes=False, outline_translation=True, pass_widget=False, interaction_event='end')
| Add a box widget to the scene.
|
| This is useless without a callback function. You can pass a
| callable function that takes a single argument, the PolyData
| box output from this widget, and performs a task with that
| box.
|
| Parameters
| ----------
| callback : callable
| The method called every time the box is updated. This has
| two options: Take a single argument, the ``PolyData`` box
| (default) or if ``use_planes=True``, then it takes a
| single argument of the plane collection as a ``vtkPlanes``
| object.
|
| bounds : tuple(float)
| Length 6 tuple of the bounding box where the widget is
| placed.
|
| factor : float, optional
| An inflation factor to expand on the bounds when placing.
|
| rotation_enabled : bool, optional
| If ``False``, the box widget cannot be rotated and is
| strictly orthogonal to the Cartesian axes.
|
| color : ColorLike, optional
| Either a string, rgb sequence, or hex color string.
| Defaults to :attr:`pyvista.global_theme.font.color
| <pyvista.plotting.themes._Font.color>`.
|
| use_planes : bool, optional
| Changes the arguments passed to the callback to the planes
| that make up the box.
|
| outline_translation : bool, optional
| If ``False``, the box widget cannot be translated and is
| strictly placed at the given bounds.
|
| pass_widget : bool, optional
| If ``True``, the widget will be passed as the last
| argument of the callback.
|
| interaction_event : vtk.vtkCommand.EventIds, str, optional
| The VTK interaction event to use for triggering the
| callback. Accepts either the strings ``'start'``, ``'end'``,
| ``'always'`` or a ``vtk.vtkCommand.EventIds``.
|
| .. versionchanged:: 0.38.0
| Now accepts either strings or ``vtk.vtkCommand.EventIds``.
|
| Returns
| -------
| vtk.vtkBoxWidget
| Box widget.
|
| Examples
| --------
| Shows an interactive clip box.
|
| >>> import pyvista as pv
| >>> mesh = pv.ParametricConicSpiral()
| >>> pl = pv.Plotter()
| >>> _ = pl.add_mesh_clip_box(mesh, color='white')
| >>> pl.show()
|
| For a full example see :ref:`box_widget_example`.
|
| add_camera_orientation_widget(self, animate=True, n_frames=20)
| Add a camera orientation widget to the active renderer.
|
| .. note::
| This widget requires ``vtk>=9.1.0``.
|
| Parameters
| ----------
| animate : bool, default: True
| Enable or disable jump-to-axis-view animation.
|
| n_frames : int, default: 20
| The number of frames to animate the jump-to-axis-viewpoint feature.
|
| Returns
| -------
| vtkCameraOrientationWidget
| Camera orientation widget.
|
| Examples
| --------
| Add a camera orientation widget to the scene.
|
| >>> import pyvista
| >>> mesh = pyvista.Cube()
| >>> plotter = pyvista.Plotter()
| >>> _ = plotter.add_mesh(
| ... mesh, scalars=range(6), show_scalar_bar=False
| ... )
| >>> _ = plotter.add_camera_orientation_widget()
| >>> plotter.show()
|
| add_checkbox_button_widget(self, callback, value=False, position=(10.0, 10.0), size=50, border_size=5, color_on='blue', color_off='grey', background_color='white')
| Add a checkbox button widget to the scene.
|
| This is useless without a callback function. You can pass a callable
| function that takes a single argument, the state of this button widget
| and performs a task with that value.
|
| Parameters
| ----------
| callback : callable
| The method called every time the button is clicked. This should take
| a single parameter: the bool value of the button.
|
| value : bool, default: False
| The default state of the button.
|
| position : sequence[float], default: (10.0, 10.0)
| The absolute coordinates of the bottom left point of the button.
|
| size : int, default: 50
| The size of the button in number of pixels.
|
| border_size : int, default: 5
| The size of the borders of the button in pixels.
|
| color_on : ColorLike, optional
| The color used when the button is checked. Default is ``'blue'``.
|
| color_off : ColorLike, optional
| The color used when the button is not checked. Default is ``'grey'``.
|
| background_color : ColorLike, optional
| The background color of the button. Default is ``'white'``.
|
| Returns
| -------
| vtk.vtkButtonWidget
| The VTK button widget configured as a checkbox button.
|
| Examples
| --------
| The following example generates a static image of the widget.
|
| >>> import pyvista as pv
| >>> mesh = pv.Sphere()
| >>> p = pv.Plotter()
| >>> actor = p.add_mesh(mesh)
| >>> def toggle_vis(flag):
| ... actor.SetVisibility(flag)
| ...
| >>> _ = p.add_checkbox_button_widget(toggle_vis, value=True)
| >>> p.show()
|
| Download the interactive example at :ref:`checkbox_widget_example`.
|
| add_line_widget(self, callback, bounds=None, factor=1.25, resolution=100, color=None, use_vertices=False, pass_widget=False, interaction_event=45)
| Add a line widget to the scene.
|
| This is useless without a callback function. You can pass a
| callable function that takes a single argument, the PolyData
| line output from this widget, and performs a task with that
| line.
|
| Parameters
| ----------
| callback : callable
| The method called every time the line is updated. This has
| two options: Take a single argument, the ``PolyData`` line
| (default) or if ``use_vertices=True``, then it can take
| two arguments of the coordinates of the line's end points.
|
| bounds : tuple(float), optional
| Length 6 tuple of the bounding box where the widget is
| placed.
|
| factor : float, optional
| An inflation factor to expand on the bounds when placing.
|
| resolution : int, optional
| The number of points in the line created.
|
| color : ColorLike, optional
| Either a string, rgb sequence, or hex color string.
|
| use_vertices : bool, optional
| Changes the arguments of the callback method to take the end
| points of the line instead of a PolyData object.
|
| pass_widget : bool, default: False
| If ``True``, the widget will be passed as the last
| argument of the callback.
|
| interaction_event : vtk.vtkCommand.EventIds, optional
| The VTK interaction event to use for triggering the callback.
|
| Returns
| -------
| vtk.vtkLineWidget
| Created line widget.
|
| add_measurement_widget(self, callback=None, color=None)
| Interactively measure distance with a distance widget.
|
| Creates an overlay documenting the selected line and total
| distance between two mouse left-click interactions.
|
| The measurement overlay stays on the rendering until the
| widget is deleted. Only one measurement can be added by each
| widget instance.
|
| Parameters
| ----------
| callback : Callable[[Tuple[float, float, float], [Tuple[float, float, float], int], float]
| The method called every time the widget calculates a
| distance measurement. This callback receives the start
| point and end point as cartesian coordinate tuples
| and the calculated distance between the two points.
|
| color : ColorLike, optional
| The color of the measurement widget.
|
| Returns
| -------
| vtk.vtkDistanceWidget
| The newly created distance widget.
|
| add_mesh_clip_box(self, mesh, invert=False, rotation_enabled=True, widget_color=None, outline_translation=True, merge_points=True, crinkle=False, interaction_event='end', **kwargs)
| Clip a mesh using a box widget.
|
| Add a mesh to the scene with a box widget that is used to clip
| the mesh interactively.
|
| The clipped mesh is saved to the ``.box_clipped_meshes`` attribute on
| the plotter.
|
| Parameters
| ----------
| mesh : pyvista.DataSet or vtk.vtkAlgorithm
| The input dataset to add to the scene and clip or algorithm that
| produces said mesh.
|
| invert : bool, optional
| Flag on whether to flip/invert the clip.
|
| rotation_enabled : bool, optional
| If ``False``, the box widget cannot be rotated and is strictly
| orthogonal to the cartesian axes.
|
| widget_color : ColorLike, optional
| Color of the widget. Either a string, RGB sequence, or
| hex color string. For example:
|
| * ``color='white'``
| * ``color='w'``
| * ``color=[1.0, 1.0, 1.0]``
| * ``color='#FFFFFF'``
|
| outline_translation : bool, optional
| If ``False``, the plane widget cannot be translated and is
| strictly placed at the given bounds.
|
| merge_points : bool, optional
| If ``True`` (default), coinciding points of independently
| defined mesh elements will be merged.
|
| crinkle : bool, optional
| Crinkle the clip by extracting the entire cells along the clip.
|
| interaction_event : vtk.vtkCommand.EventIds, str, optional
| The VTK interaction event to use for triggering the
| callback. Accepts either the strings ``'start'``, ``'end'``,
| ``'always'`` or a ``vtk.vtkCommand.EventIds``.
|
| .. versionchanged:: 0.38.0
| Changed from ``event_type`` to ``interaction_event`` and now
| accepts either strings and ``vtk.vtkCommand.EventIds``.
|
| **kwargs : dict, optional
| All additional keyword arguments are passed to
| :func:`Plotter.add_mesh` to control how the mesh is
| displayed.
|
| Returns
| -------
| vtk.vtkActor
| VTK actor of the mesh.
|
| add_mesh_clip_plane(self, mesh, normal='x', invert=False, widget_color=None, value=0.0, assign_to_axis=None, tubing=False, origin_translation=True, outline_translation=False, implicit=True, normal_rotation=True, crinkle=False, interaction_event='end', origin=None, **kwargs)
| Clip a mesh using a plane widget.
|
| Add a mesh to the scene with a plane widget that is used to clip
| the mesh interactively.
|
| The clipped mesh is saved to the ``.plane_clipped_meshes``
| attribute on the plotter.
|
| Parameters
| ----------
| mesh : pyvista.DataSet or vtk.vtkAlgorithm
| The input dataset to add to the scene and clip or algorithm that
| produces said mesh.
|
| normal : str or tuple(float), optional
| The starting normal vector of the plane.
|
| invert : bool, optional
| Flag on whether to flip/invert the clip.
|
| widget_color : ColorLike, optional
| Either a string, RGB list, or hex color string.
|
| value : float, optional
| Set the clipping value along the normal direction.
| The default value is 0.0.
|
| assign_to_axis : str or int, optional
| Assign the normal of the plane to be parallel with a given
| axis. Options are ``(0, 'x')``, ``(1, 'y')``, or ``(2,
| 'z')``.
|
| tubing : bool, optional
| When using an implicit plane wiget, this controls whether
| or not tubing is shown around the plane's boundaries.
|
| origin_translation : bool, optional
| If ``False``, the plane widget cannot be translated by its
| origin and is strictly placed at the given origin. Only
| valid when using an implicit plane.
|
| outline_translation : bool, optional
| If ``False``, the box widget cannot be translated and is
| strictly placed at the given bounds.
|
| implicit : bool, optional
| When ``True``, a ``vtkImplicitPlaneWidget`` is used and
| when ``False``, a ``vtkPlaneWidget`` is used.
|
| normal_rotation : bool, optional
| Set the opacity of the normal vector arrow to 0 such that
| it is effectively disabled. This prevents the user from
| rotating the normal. This is forced to ``False`` when
| ``assign_to_axis`` is set.
|
| crinkle : bool, optional
| Crinkle the clip by extracting the entire cells along the clip.
|
| interaction_event : vtk.vtkCommand.EventIds, str, optional
| The VTK interaction event to use for triggering the
| callback. Accepts either the strings ``'start'``, ``'end'``,
| ``'always'`` or a ``vtk.vtkCommand.EventIds``.
|
| .. versionchanged:: 0.38.0
| Now accepts either strings or ``vtk.vtkCommand.EventIds``.
|
| origin : tuple(float), optional
| The starting coordinate of the center of the plane.
|
| **kwargs : dict, optional
| All additional keyword arguments are passed to
| :func:`Plotter.add_mesh` to control how the mesh is
| displayed.
|
| Returns
| -------
| vtk.vtkActor
| VTK actor of the mesh.
|
| add_mesh_isovalue(self, mesh, scalars=None, compute_normals=False, compute_gradients=False, compute_scalars=True, preference='point', title=None, pointa=(0.4, 0.9), pointb=(0.9, 0.9), widget_color=None, **kwargs)
| Create a contour of a mesh with a slider.
|
| Add a mesh to the scene with a slider widget that is used to
| contour at an isovalue of the *point* data on the mesh
| interactively.
|
| The isovalue mesh is saved to the ``.isovalue_meshes``
| attribute on the plotter.
|
| .. warning::
| This will not work with :class:`pyvista.PointSet` as
| creating an isovalue is a dimension reducing operation
| on the geometry and point clouds are zero dimensional.
| This will similarly fail for point clouds in
| :class:`pyvista.PolyData`.
|
| Parameters
| ----------
| mesh : pyvista.DataSet or vtk.vtkAlgorithm
| The input dataset to add to the scene and contour or algorithm
| that produces said mesh.
|
| scalars : str, optional
| The string name of the scalars on the mesh to contour and display.
|
| compute_normals : bool, optional
| Enable or disable the computation of normals. If the
| output data will be processed by filters that modify
| topology or geometry, it may be wise to disable computing
| normals.
|
| compute_gradients : bool, optional
| Enable or disable the computation of gradients. If the
| output data will be processed by filters that modify
| topology or geometry, it may be wise to disable computing
| gradients.
|
| compute_scalars : bool, optional
| Enable or disable the computation of scalars.
|
| preference : str, optional
| When ``mesh.n_points == mesh.n_cells`` and setting
| scalars, this parameter sets how the scalars will be
| mapped to the mesh. Default ``'point'``, causes the
| scalars will be associated with the mesh points. Can be
| either ``'point'`` or ``'cell'``.
|
| title : str, optional
| The string label of the slider widget.
|
| pointa : sequence, optional
| The relative coordinates of the left point of the slider
| on the display port.
|
| pointb : sequence
| The relative coordinates of the right point of the slider
| on the display port.
|
| widget_color : ColorLike, optional
| Color of the widget. Either a string, RGB sequence, or
| hex color string. For example:
|
| * ``color='white'``
| * ``color='w'``
| * ``color=[1.0, 1.0, 1.0]``
| * ``color='#FFFFFF'``
|
| **kwargs : dict, optional
| All additional keyword arguments are passed to
| :func:`Plotter.add_mesh` to control how the mesh is
| displayed.
|
| Returns
| -------
| vtk.vtkActor
| VTK actor of the mesh.
|
| add_mesh_slice(self, mesh, normal='x', generate_triangles=False, widget_color=None, assign_to_axis=None, tubing=False, origin_translation=True, outline_translation=False, implicit=True, normal_rotation=True, interaction_event=45, origin=None, **kwargs)
| Slice a mesh using a plane widget.
|
| Add a mesh to the scene with a plane widget that is used to slice
| the mesh interactively.
|
| The sliced mesh is saved to the ``.plane_sliced_meshes`` attribute on
| the plotter.
|
| Parameters
| ----------
| mesh : pyvista.DataSet or vtk.vtkAlgorithm
| The input dataset to add to the scene and slice or algorithm that
| produces said mesh.
|
| normal : str or tuple(float), optional
| The starting normal vector of the plane.
|
| generate_triangles : bool, optional
| If this is enabled (``False`` by default), the output will be
| triangles otherwise, the output will be the intersection polygons.
|
| widget_color : ColorLike, optional
| Either a string, RGB sequence, or hex color string. Defaults
| to ``'white'``.
|
| assign_to_axis : str or int, optional
| Assign the normal of the plane to be parallel with a given axis:
| options are (0, 'x'), (1, 'y'), or (2, 'z').
|
| tubing : bool, optional
| When using an implicit plane wiget, this controls whether or not
| tubing is shown around the plane's boundaries.
|
| origin_translation : bool, optional
| If ``False``, the plane widget cannot be translated by its origin
| and is strictly placed at the given origin. Only valid when using
| an implicit plane.
|
| outline_translation : bool, optional
| If ``False``, the box widget cannot be translated and is strictly
| placed at the given bounds.
|
| implicit : bool, optional
| When ``True``, a ``vtkImplicitPlaneWidget`` is used and when
| ``False``, a ``vtkPlaneWidget`` is used.
|
| normal_rotation : bool, optional
| Set the opacity of the normal vector arrow to 0 such that it is
| effectively disabled. This prevents the user from rotating the
| normal. This is forced to ``False`` when ``assign_to_axis`` is set.
|
| interaction_event : vtk.vtkCommand.EventIds, optional
| The VTK interaction event to use for triggering the callback.
|
| origin : tuple(float), optional
| The starting coordinate of the center of the plane.
|
| **kwargs : dict, optional
| All additional keyword arguments are passed to
| :func:`Plotter.add_mesh` to control how the mesh is
| displayed.
|
| Returns
| -------
| vtk.vtkActor
| VTK actor of the mesh.
|
| add_mesh_slice_orthogonal(self, mesh, generate_triangles=False, widget_color=None, tubing=False, interaction_event=45, **kwargs)
| Slice a mesh with three interactive planes.
|
| Adds three interactive plane slicing widgets for orthogonal slicing
| along each cartesian axis.
|
| Parameters
| ----------
| mesh : pyvista.DataSet or vtk.vtkAlgorithm
| The input dataset to add to the scene and threshold or algorithm
| that produces said mesh.
|
| generate_triangles : bool, optional
| If this is enabled (``False`` by default), the output will be
| triangles otherwise, the output will be the intersection polygons.
|
| widget_color : ColorLike, optional
| Color of the widget. Either a string, RGB sequence, or
| hex color string. For example:
|
| * ``color='white'``
| * ``color='w'``
| * ``color=[1.0, 1.0, 1.0]``
| * ``color='#FFFFFF'``
|
| tubing : bool, optional
| When using an implicit plane wiget, this controls whether or not
| tubing is shown around the plane's boundaries.
|
| interaction_event : vtk.vtkCommand.EventIds, optional
| The VTK interaction event to use for triggering the callback.
|
| **kwargs : dict, optional
| All additional keyword arguments are passed to
| :func:`Plotter.add_mesh` to control how the mesh is
| displayed.
|
| Returns
| -------
| list
| List of vtk.vtkActor(s).
|
| add_mesh_slice_spline(self, mesh, generate_triangles=False, n_handles=5, resolution=25, widget_color=None, show_ribbon=False, ribbon_color='pink', ribbon_opacity=0.5, initial_points=None, closed=False, interaction_event=45, **kwargs)
| Slice a mesh with a spline widget.
|
| Add a mesh to the scene with a spline widget that is used to slice
| the mesh interactively.
|
| The sliced mesh is saved to the ``.spline_sliced_meshes`` attribute on
| the plotter.
|
| Parameters
| ----------
| mesh : pyvista.DataSet or vtk.vtkAlgorithm
| The input dataset to add to the scene and slice along the spline
| or algorithm that produces said mesh.
|
| generate_triangles : bool, optional
| If this is enabled (``False`` by default), the output will be
| triangles otherwise, the output will be the intersection polygons.
|
| n_handles : int, optional
| The number of interactive spheres to control the spline's
| parametric function.
|
| resolution : int, optional
| The number of points to generate on the spline.
|
| widget_color : ColorLike, optional
| Color of the widget. Either a string, RGB sequence, or
| hex color string. For example:
|
| * ``color='white'``
| * ``color='w'``
| * ``color=[1.0, 1.0, 1.0]``
| * ``color='#FFFFFF'``
|
| show_ribbon : bool, optional
| If ``True``, the poly plane used for slicing will also be shown.
|
| ribbon_color : ColorLike, optional
| Color of the ribbon. Either a string, RGB sequence, or
| hex color string.
|
| ribbon_opacity : float, optional
| Opacity of ribbon. Defaults to 1.0 and must be between
| ``[0, 1]``.
|
| initial_points : sequence, optional
| The points to initialize the widget placement. Must have same
| number of elements as ``n_handles``. If the first and last point
| are the same, this will be a closed loop spline.
|
| closed : bool, optional
| Make the spline a closed loop.
|
| interaction_event : vtk.vtkCommand.EventIds, optional
| The VTK interaction event to use for triggering the callback.
|
| **kwargs : dict, optional
| All additional keyword arguments are passed to
| :func:`Plotter.add_mesh` to control how the mesh is
| displayed.
|
| Returns
| -------
| vtk.vtkActor
| VTK actor of the mesh.
|
| add_mesh_threshold(self, mesh, scalars=None, invert=False, widget_color=None, preference='cell', title=None, pointa=(0.4, 0.9), pointb=(0.9, 0.9), continuous=False, all_scalars=False, method='upper', **kwargs)
| Apply a threshold on a mesh with a slider.
|
| Add a mesh to the scene with a slider widget that is used to
| threshold the mesh interactively.
|
| The threshold mesh is saved to the ``.threshold_meshes`` attribute on
| the plotter.
|
| Parameters
| ----------
| mesh : pyvista.DataSet or vtk.vtkAlgorithm
| The input dataset to add to the scene and threshold or algorithm
| that produces said mesh.
|
| scalars : str, optional
| The string name of the scalars on the mesh to threshold and display.
|
| invert : bool, default: False
| Invert the threshold results. That is, cells that would have been
| in the output with this option off are excluded, while cells that
| would have been excluded from the output are included.
|
| widget_color : ColorLike, optional
| Color of the widget. Either a string, RGB sequence, or
| hex color string. For example:
|
| * ``color='white'``
| * ``color='w'``
| * ``color=[1.0, 1.0, 1.0]``
| * ``color='#FFFFFF'``
|
| preference : str, default: 'cell'
| When ``mesh.n_points == mesh.n_cells`` and setting
| scalars, this parameter sets how the scalars will be
| mapped to the mesh. Default ``'cell'``, causes the
| scalars to be associated with the mesh cells. Can be
| either ``'point'`` or ``'cell'``.
|
| title : str, optional
| The string label of the slider widget.
|
| pointa : sequence, default: (0.4, 0.9)
| The relative coordinates of the left point of the slider
| on the display port.
|
| pointb : sequence, default: (0.9, 0.9)
| The relative coordinates of the right point of the slider
| on the display port.
|
| continuous : bool, default: False
| If this is enabled (default is ``False``), use the continuous
| interval ``[minimum cell scalar, maximum cell scalar]``
| to intersect the threshold bound, rather than the set of
| discrete scalar values from the vertices.
|
| all_scalars : bool, default: False
| If using scalars from point data, all
| points in a cell must satisfy the threshold when this
| value is ``True``. When ``False``, any point of the cell
| with a scalar value satisfying the threshold criterion
| will extract the cell. Has no effect when using cell data.
|
| method : str, default: 'upper'
| Set the threshold method for single-values, defining which
| threshold bounds to use. If the ``value`` is a range, this
| parameter will be ignored, extracting data between the two
| values. For single values, ``'lower'`` will extract data
| lower than the ``value``. ``'upper'`` will extract data
| larger than the ``value``.
|
| **kwargs : dict, optional
| All additional keyword arguments are passed to ``add_mesh`` to
| control how the mesh is displayed.
|
| Returns
| -------
| vtk.vtkActor
| VTK actor of the mesh.
|
| add_plane_widget(self, callback, normal='x', origin=None, bounds=None, factor=1.25, color=None, assign_to_axis=None, tubing=False, outline_translation=False, origin_translation=True, implicit=True, pass_widget=False, test_callback=True, normal_rotation=True, interaction_event='end')
| Add a plane widget to the scene.
|
| This is useless without a callback function. You can pass a
| callable function that takes two arguments, the normal and
| origin of the plane in that order output from this widget, and
| performs a task with that plane.
|
| Parameters
| ----------
| callback : callable
| The method called every time the plane is updated. Takes
| two arguments, the normal and origin of the plane in that
| order.
|
| normal : str or tuple(float)
| The starting normal vector of the plane.
|
| origin : tuple(float)
| The starting coordinate of the center of the plane.
|
| bounds : tuple(float)
| Length 6 tuple of the bounding box where the widget is placed.
|
| factor : float, optional
| An inflation factor to expand on the bounds when placing.
|
| color : ColorLike, optional
| Either a string, rgb list, or hex color string.
|
| assign_to_axis : str or int, optional
| Assign the normal of the plane to be parallel with a given
| axis: options are ``(0, 'x')``, ``(1, 'y')``, or ``(2,
| 'z')``.
|
| tubing : bool, optional
| When using an implicit plane wiget, this controls whether
| or not tubing is shown around the plane's boundaries.
|
| outline_translation : bool, optional
| If ``False``, the plane widget cannot be translated and is
| strictly placed at the given bounds. Only valid when using
| an implicit plane.
|
| origin_translation : bool, optional
| If ``False``, the plane widget cannot be translated by its
| origin and is strictly placed at the given origin. Only
| valid when using an implicit plane.
|
| implicit : bool, optional
| When ``True``, a ``vtkImplicitPlaneWidget`` is used and
| when ``False``, a ``vtkPlaneWidget`` is used.
|
| pass_widget : bool, optional
| If ``True``, the widget will be passed as the last
| argument of the callback.
|
| test_callback : bool, optional
| If ``True``, run the callback function after the widget is
| created.
|
| normal_rotation : bool, optional
| Set the opacity of the normal vector arrow to 0 such that
| it is effectively disabled. This prevents the user from
| rotating the normal. This is forced to ``False`` when
| ``assign_to_axis`` is set.
|
| interaction_event : vtk.vtkCommand.EventIds, str, optional
| The VTK interaction event to use for triggering the
| callback. Accepts either the strings ``'start'``, ``'end'``,
| ``'always'`` or a ``vtk.vtkCommand.EventIds``.
|
| .. versionchanged:: 0.38.0
| Now accepts either strings and ``vtk.vtkCommand.EventIds``.
|
| Returns
| -------
| vtk.vtkImplicitPlaneWidget or vtk.vtkPlaneWidget
| Plane widget.
|
| add_slider_widget(self, callback, rng, value=None, title=None, pointa=(0.4, 0.9), pointb=(0.9, 0.9), color=None, pass_widget=False, interaction_event='end', style=None, title_height=0.03, title_opacity=1.0, title_color=None, fmt=None, slider_width=None, tube_width=None, **kwargs)
| Add a slider bar widget.
|
| This is useless without a callback function. You can pass a
| callable function that takes a single argument, the value of
| this slider widget, and performs a task with that value.
|
| Parameters
| ----------
| callback : callable
| Called every time the slider is updated. This should take a single
| parameter: the float value of the slider. If ``pass_widget=True``,
| callable should take two parameters: the float value of the slider
| and the widget itself.
|
| rng : tuple(float)
| Length two tuple of the minimum and maximum ranges of the
| slider.
|
| value : float, optional
| The starting value of the slider.
|
| title : str, optional
| The string label of the slider widget.
|
| pointa : tuple(float), optional
| The relative coordinates of the left point of the slider
| on the display port.
|
| pointb : tuple(float), optional
| The relative coordinates of the right point of the slider
| on the display port.
|
| color : ColorLike, optional
| Either a string, RGB list, or hex color string. Defaults
| to :attr:`pyvista.global_theme.font.color
| <pyvista.plotting.themes._Font.color>`.
|
| pass_widget : bool, optional
| If ``True``, the widget will be passed as the last
| argument of the callback.
|
| interaction_event : vtk.vtkCommand.EventIds, str, optional
| The VTK interaction event to use for triggering the
| callback. Accepts either the strings ``'start'``, ``'end'``,
| ``'always'`` or a ``vtk.vtkCommand.EventIds``.
|
| .. versionchanged:: 0.38.0
| Changed from ``event_type`` to ``interaction_event`` and now accepts
| either strings or ``vtk.vtkCommand.EventIds``.
|
| style : str, optional
| The name of the slider style. The list of available styles
| are in ``pyvista.global_theme.slider_styles``. Defaults to
| ``None``.
|
| title_height : float, optional
| Relative height of the title as compared to the length of
| the slider.
|
| title_opacity : float, optional
| Opacity of title. Defaults to 1.0.
|
| title_color : ColorLike, optional
| Either a string, RGB sequence, or hex color string. Defaults
| to the value given in ``color``.
|
| fmt : str, optional
| String formatter used to format numerical data. Defaults
| to ``None``.
|
| slider_width : float, optional
| Normalized width of the slider. Defaults to the theme's slider width.
|
| tube_width : float, optional
| Normalized width of the tube. Defaults to the theme's tube width.
|
| **kwargs : dict, optional
| Deprecated keyword arguments.
|
| .. deprecated:: 0.38.0
| Keyword argument ``event_type`` deprecated in favor of
| ``interaction_event``.
|
| Returns
| -------
| vtk.vtkSliderWidget
| Slider widget.
|
| Examples
| --------
| >>> import pyvista as pv
| >>> pl = pv.Plotter()
| >>> def create_mesh(value):
| ... res = int(value)
| ... sphere = pv.Sphere(
| ... phi_resolution=res, theta_resolution=res
| ... )
| ... pl.add_mesh(sphere, name="sphere", show_edges=True)
| ...
| >>> slider = pl.add_slider_widget(
| ... create_mesh,
| ... [5, 100],
| ... title="Resolution",
| ... title_opacity=0.5,
| ... title_color="red",
| ... fmt="%0.9f",
| ... title_height=0.08,
| ... )
| >>> pl.show()
|
| add_sphere_widget(self, callback, center=(0, 0, 0), radius=0.5, theta_resolution=30, phi_resolution=30, color=None, style='surface', selected_color='pink', indices=None, pass_widget=False, test_callback=True, interaction_event=45)
| Add one or many sphere widgets to a scene.
|
| Use a sphere widget to control a vertex location.
|
| Parameters
| ----------
| callback : callable
| The function to call back when the widget is modified. It takes a
| single argument: the center of the sphere as an XYZ coordinate (a
| 3-length sequence), unless ``pass_widget=True``, in which case the
| callback must accept the widget object as the second parameter. If
| multiple centers are passed in the ``center`` parameter, the
| callback must also accept an index of that widget.
|
| center : sequence[float], optional
| The cartesian coordinate of the sphere's center when placing it in
| the scene. If more than one location is passed, then that many
| widgets will be added and the callback will also be passed the
| integer index of that widget.
|
| radius : float, optional
| The radius of the sphere.
|
| theta_resolution : int, optional
| Set the number of points in the longitude direction.
|
| phi_resolution : int, optional
| Set the number of points in the latitude direction.
|
| color : ColorLike, optional
| The color of the sphere's surface. If multiple centers
| are passed, then this must be a list of colors. Each
| color is either a string, rgb list, or hex color string.
| For example:
|
| * ``color='white'``
| * ``color='w'``
| * ``color=[1.0, 1.0, 1.0]``
| * ``color='#FFFFFF'``
|
| style : str, optional
| Representation style: ``'surface'`` or ``'wireframe'``.
|
| selected_color : ColorLike, optional
| Color of the widget when selected during interaction.
|
| indices : sequence[int], optional
| Indices to assign the sphere widgets.
|
| pass_widget : bool, optional
| If ``True``, the widget will be passed as the last
| argument of the callback.
|
| test_callback : bool, optional
| If ``True``, run the callback function after the widget is
| created.
|
| interaction_event : vtk.vtkCommand.EventIds, optional
| The VTK interaction event to use for triggering the callback.
|
| Returns
| -------
| vtk.vtkSphereWidget
| The sphere widget.
|
| add_spline_widget(self, callback, bounds=None, factor=1.25, n_handles=5, resolution=25, color='yellow', show_ribbon=False, ribbon_color='pink', ribbon_opacity=0.5, pass_widget=False, closed=False, initial_points=None, interaction_event=45)
| Create and add a spline widget to the scene.
|
| Use the bounds argument to place this widget. Several "handles" are
| used to control a parametric function for building this spline. Click
| directly on the line to translate the widget.
|
| Parameters
| ----------
| callback : callable
| The method called every time the spline is updated. This passes a
| :class:`pyvista.PolyData` object to the callback function of the
| generated spline.
|
| bounds : sequence[float], optional
| Length 6 sequence of the bounding box where the widget is placed.
|
| factor : float, optional
| An inflation factor to expand on the bounds when placing.
|
| n_handles : int, optional
| The number of interactive spheres to control the spline's
| parametric function.
|
| resolution : int, optional
| The number of points in the spline created between all the handles.
|
| color : ColorLike, optional
| Either a string, RGB sequence, or hex color string.
|
| show_ribbon : bool, optional
| If ``True``, the poly plane used for slicing will also be shown.
|
| ribbon_color : ColorLike, optional
| Color of the ribbon. Either a string, RGB sequence, or
| hex color string.
|
| ribbon_opacity : float, optional
| Opacity of ribbon. Defaults to 1.0 and must be between
| ``[0, 1]``.
|
| pass_widget : bool, optional
| If ``True``, the widget will be passed as the last argument of the
| callback.
|
| closed : bool, optional
| Make the spline a closed loop.
|
| initial_points : sequence, optional
| The points to initialize the widget placement. Must have
| same number of elements as ``n_handles``. If the first and
| last point are the same, this will be a closed loop
| spline.
|
| interaction_event : vtk.vtkCommand.EventIds, optional
| The VTK interaction event to use for triggering the callback.
|
| Returns
| -------
| vtk.vtkSplineWidget
| The newly created spline widget.
|
| Notes
| -----
| This widget has trouble displaying certain colors. Use only simple
| colors (white, black, yellow).
|
| add_text_slider_widget(self, callback, data, value=None, pointa=(0.4, 0.9), pointb=(0.9, 0.9), color=None, interaction_event='end', style=None, **kwargs)
| Add a text slider bar widget.
|
| This is useless without a callback function. You can pass a callable
| function that takes a single argument, the value of this slider widget,
| and performs a task with that value.
|
| Parameters
| ----------
| callback : callable
| The method called every time the slider is updated. This should take
| a single parameter: the float value of the slider.
|
| data : list
| The list of possible values displayed on the slider bar.
|
| value : float, optional
| The starting value of the slider.
|
| pointa : tuple(float), optional
| The relative coordinates of the left point of the slider on the
| display port.
|
| pointb : tuple(float), optional
| The relative coordinates of the right point of the slider on the
| display port.
|
| color : ColorLike, optional
| Either a string, RGB list, or hex color string. Defaults
| to :attr:`pyvista.global_theme.font.color
| <pyvista.plotting.themes._Font.color>`.
|
| interaction_event : vtk.vtkCommand.EventIds, str, optional
| The VTK interaction event to use for triggering the
| callback. Accepts either the strings ``'start'``, ``'end'``,
| ``'always'`` or a ``vtk.vtkCommand.EventIds``.
|
| .. versionchanged:: 0.38.0
| Changed from ``event_type`` to ``interaction_event`` and now
| accepts either strings or ``vtk.vtkCommand.EventIds``.
|
| style : str, optional
| The name of the slider style. The list of available styles
| are in ``pyvista.global_theme.slider_styles``. Defaults to
| ``None``.
|
| **kwargs : dict, optional
| Deprecated keyword arguments.
|
| .. deprecated:: 0.38.0
| Keyword argument ``event_type`` deprecated in favor of
| ``interaction_event``.
|
| Returns
| -------
| vtk.vtkSliderWidget
| The VTK slider widget configured to display text.
|
| add_volume_clip_plane(self, volume, normal='x', invert=False, widget_color=None, value=0.0, assign_to_axis=None, tubing=False, origin_translation=True, outline_translation=False, implicit=True, normal_rotation=True, interaction_event='end', origin=None, **kwargs)
| Clip a volume using a plane widget.
|
| Parameters
| ----------
| volume : pyvista.plotting.volume.Volume or pyvista.ImageData or pyvista.RectilinearGrid
| New dataset of type :class:`pyvista.ImageData` or
| :class:`pyvista.RectilinearGrid`, or the return value from
| :class:`pyvista.plotting.volume.Volume` from :func:`Plotter.add_volume`.
|
| normal : str or tuple(float), optional
| The starting normal vector of the plane.
|
| invert : bool, optional
| Flag on whether to flip/invert the clip.
|
| widget_color : ColorLike, optional
| Either a string, RGB list, or hex color string.
|
| value : float, optional
| Set the clipping value along the normal direction.
| The default value is 0.0.
|
| assign_to_axis : str or int, optional
| Assign the normal of the plane to be parallel with a given
| axis. Options are ``(0, 'x')``, ``(1, 'y')``, or ``(2,
| 'z')``.
|
| tubing : bool, optional
| When using an implicit plane wiget, this controls whether
| or not tubing is shown around the plane's boundaries.
|
| origin_translation : bool, optional
| If ``False``, the plane widget cannot be translated by its
| origin and is strictly placed at the given origin. Only
| valid when using an implicit plane.
|
| outline_translation : bool, optional
| If ``False``, the box widget cannot be translated and is
| strictly placed at the given bounds.
|
| implicit : bool, optional
| When ``True``, a ``vtkImplicitPlaneWidget`` is used and
| when ``False``, a ``vtkPlaneWidget`` is used.
|
| normal_rotation : bool, optional
| Set the opacity of the normal vector arrow to 0 such that
| it is effectively disabled. This prevents the user from
| rotating the normal. This is forced to ``False`` when
| ``assign_to_axis`` is set.
|
| interaction_event : vtk.vtkCommand.EventIds, optional
| The VTK interaction event to use for triggering the callback.
|
| origin : tuple(float), optional
| The starting coordinate of the center of the plane.
|
| **kwargs : dict, optional
| All additional keyword arguments are passed to
| :func:`Plotter.add_volume` to control how the volume is
| displayed. Only applicable if ``volume`` is either a
| :class:`pyvista.ImageData` and :class:`pyvista.RectilinearGrid`.
|
| Returns
| -------
| vtk.vtkPlaneWidget or vtk.vtkImplicitPlaneWidget
| The VTK plane widget depending on the value of ``implicit``.
|
| clear_box_widgets(self)
| Remove all of the box widgets.
|
| clear_button_widgets(self)
| Remove all of the button widgets.
|
| clear_camera_widgets(self)
| Remove all of the camera widgets.
|
| clear_line_widgets(self)
| Remove all of the line widgets.
|
| clear_measure_widgets(self)
| Remove all of the measurement widgets.
|
| clear_plane_widgets(self)
| Remove all of the plane widgets.
|
| clear_slider_widgets(self)
| Remove all of the slider widgets.
|
| clear_sphere_widgets(self)
| Remove all of the sphere widgets.
|
| clear_spline_widgets(self)
| Remove all of the spline widgets.
Also, as we’re not so interested in the land mask, let’s threshold that out and re-spin the render. To threshold the region and make sea_region we can use threshold method of PyVista.
sea_region = region.threshold(scalars='Surface Temperature')
help(region.threshold)
Help on method threshold in module pyvista.core.filters.data_set:

threshold(value=None, scalars=None, invert=False, continuous=False, preference='cell', all_scalars=False, component_mode='all', component=0, method='upper', progress_bar=False) method of pyvista.core.pointset.PolyData instance
    Apply a ``vtkThreshold`` filter to the input dataset.

    This filter will apply a ``vtkThreshold`` filter to the input
    dataset and return the resulting object. This extracts cells
    where the scalar value in each cell satisfies the threshold
    criterion.  If ``scalars`` is ``None``, the input's active
    scalars array is used.

    .. warning::
       Thresholding is inherently a cell operation, even though it can use
       associated point data for determining whether to keep a cell. In
       other words, whether or not a given point is included after
       thresholding depends on whether that point is part of a cell that
       is kept after thresholding.

       Please also note the default ``preference`` choice for CELL data
       over POINT data. This is contrary to most other places in PyVista's
       API where the preference typically defaults to POINT data. We chose
       to prefer CELL data here so that if thresholding by a named array
       that exists for both the POINT and CELL data, this filter will
       default to the CELL data array while performing the CELL-wise
       operation.

    Parameters
    ----------
    value : float | sequence[float], optional
        Single value or ``(min, max)`` to be used for the data threshold. If
        a sequence, then length must be 2. If no value is specified, the
        non-NaN data range will be used to remove any NaN values.
        Please reference the ``method`` parameter for how single values
        are handled.

    scalars : str, optional
        Name of scalars to threshold on. Defaults to currently active scalars.

    invert : bool, default: False
        Invert the threshold results. That is, cells that would have been
        in the output with this option off are excluded, while cells that
        would have been excluded from the output are included.

    continuous : bool, default: False
        When True, the continuous interval [minimum cell scalar,
        maximum cell scalar] will be used to intersect the threshold bound,
        rather than the set of discrete scalar values from the vertices.

    preference : str, default: 'cell'
        When ``scalars`` is specified, this is the preferred array
        type to search for in the dataset.  Must be either
        ``'point'`` or ``'cell'``. Throughout PyVista, the preference
        is typically ``'point'`` but since the threshold filter is a
        cell-wise operation, we prefer cell data for thresholding
        operations.

    all_scalars : bool, default: False
        If using scalars from point data, all
        points in a cell must satisfy the threshold when this
        value is ``True``.  When ``False``, any point of the cell
        with a scalar value satisfying the threshold criterion
        will extract the cell. Has no effect when using cell data.

    component_mode : {'selected', 'all', 'any'}
        The method to satisfy the criteria for the threshold of
        multicomponent scalars.  'selected' (default)
        uses only the ``component``.  'all' requires all
        components to meet criteria.  'any' is when
        any component satisfies the criteria.

    component : int, default: 0
        When using ``component_mode='selected'``, this sets
        which component to threshold on.

    method : str, default: 'upper'
        Set the threshold method for single-values, defining which
        threshold bounds to use. If the ``value`` is a range, this
        parameter will be ignored, extracting data between the two
        values. For single values, ``'lower'`` will extract data
        lower than the  ``value``. ``'upper'`` will extract data
        larger than the ``value``.

    progress_bar : bool, default: False
        Display a progress bar to indicate progress.

    Returns
    -------
    pyvista.UnstructuredGrid
        Dataset containing geometry that meets the threshold requirements.

    Examples
    --------
    >>> import pyvista as pv
    >>> import numpy as np
    >>> volume = np.zeros([10, 10, 10])
    >>> volume[:3] = 1
    >>> vol = pv.wrap(volume)
    >>> threshed = vol.threshold(0.1)
    >>> threshed
    UnstructuredGrid (...)
      N Cells:    243
      N Points:   400
      X Bounds:   0.000e+00, 3.000e+00
      Y Bounds:   0.000e+00, 9.000e+00
      Z Bounds:   0.000e+00, 9.000e+00
      N Arrays:   1

    Apply the threshold filter to Perlin noise.  First generate
    the structured grid.

    >>> import pyvista as pv
    >>> noise = pv.perlin_noise(0.1, (1, 1, 1), (0, 0, 0))
    >>> grid = pv.sample_function(
    ...     noise, [0, 1.0, -0, 1.0, 0, 1.0], dim=(20, 20, 20)
    ... )
    >>> grid.plot(
    ...     cmap='gist_earth_r',
    ...     show_scalar_bar=True,
    ...     show_edges=False,
    ... )

    Next, apply the threshold.

    >>> import pyvista as pv
    >>> noise = pv.perlin_noise(0.1, (1, 1, 1), (0, 0, 0))
    >>> grid = pv.sample_function(
    ...     noise, [0, 1.0, -0, 1.0, 0, 1.0], dim=(20, 20, 20)
    ... )
    >>> threshed = grid.threshold(value=0.02)
    >>> threshed.plot(
    ...     cmap='gist_earth_r',
    ...     show_scalar_bar=False,
    ...     show_edges=True,
    ... )

    See :ref:`common_filter_example` for more examples using this filter.
plotter = gv.GeoPlotter()
plotter.add_mesh(sea_region, show_edges=True)
plotter.add_coastlines()
plotter.add_base_layer(texture=gv.natural_earth_hypsometric())
plotter.view_xz()
plotter.show_axes()
plotter.show()
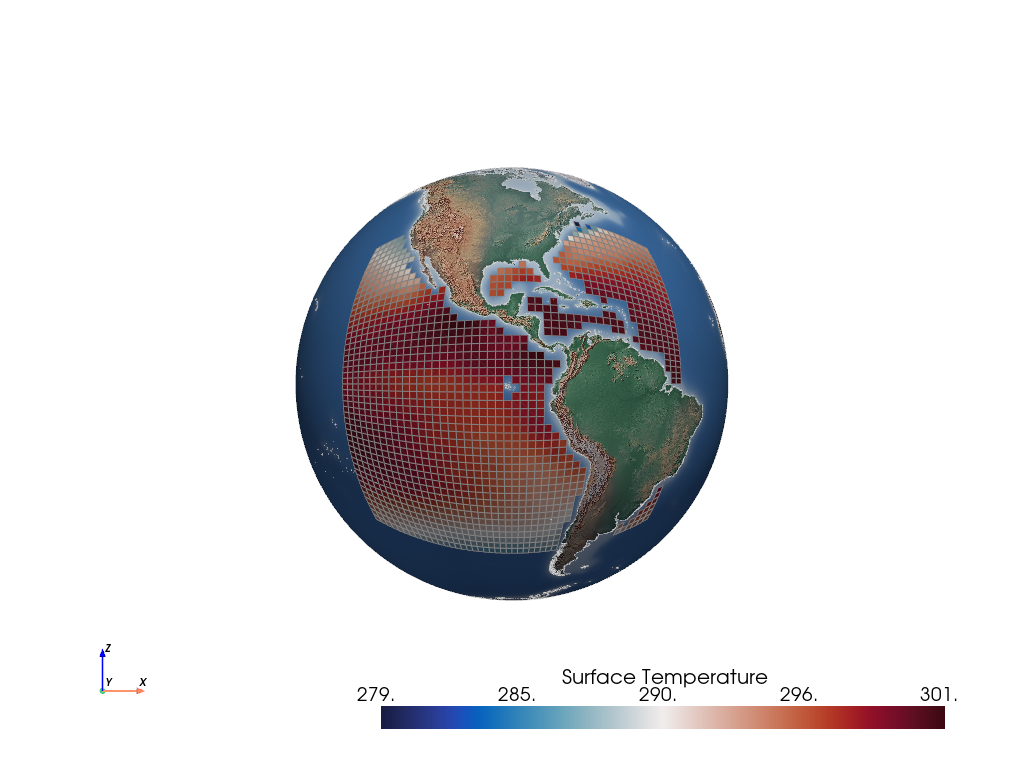
Since we’re here… let’s transform the sea_region to a Robinson projection:
plotter = gv.GeoPlotter(crs="+proj=robin lon_0=-90")
plotter.add_mesh(sea_region, show_edges=True)
plotter.add_coastlines()
plotter.add_base_layer(texture=gv.natural_earth_hypsometric())
plotter.view_xy()
plotter.show_axes()
plotter.show()
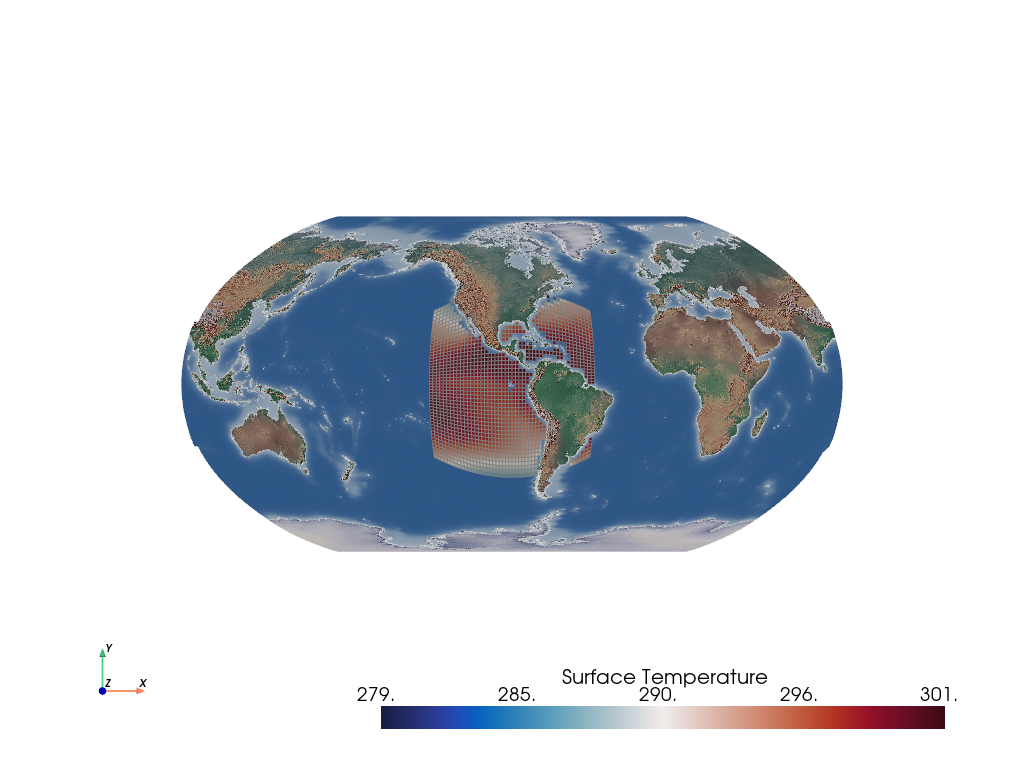
It’s also easily possible to get the inverted result i.e., the surface of the mesh not enclosed by the bbox manifold:
outside = bbox.enclosed(c48_sst, outside=True)

plotter = pv.Plotter()
plotter.add_mesh(outside, show_edges=True)
plotter.add_axes()
plotter.show()
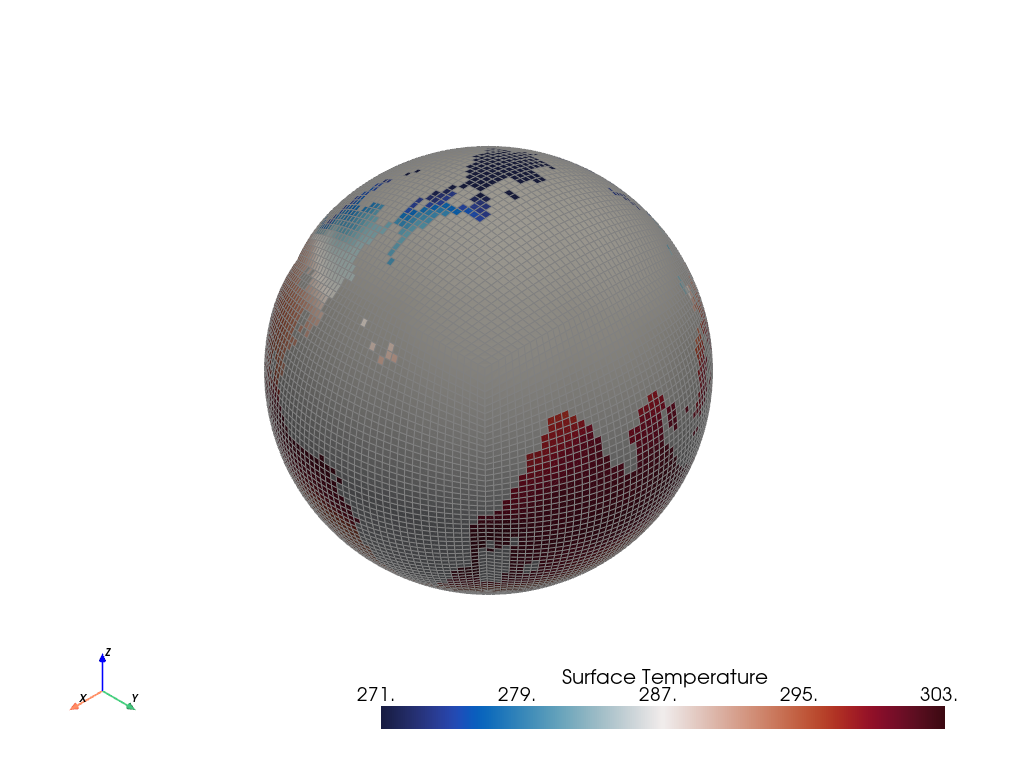
Akin to before, let’s render this again, but with a base layer underneath:
plotter = gv.GeoPlotter()
plotter.add_mesh(outside, show_edges=True)
plotter.add_coastlines()
plotter.add_base_layer(texture=gv.natural_earth_1())
plotter.view_xz()
plotter.show_axes()
plotter.show()
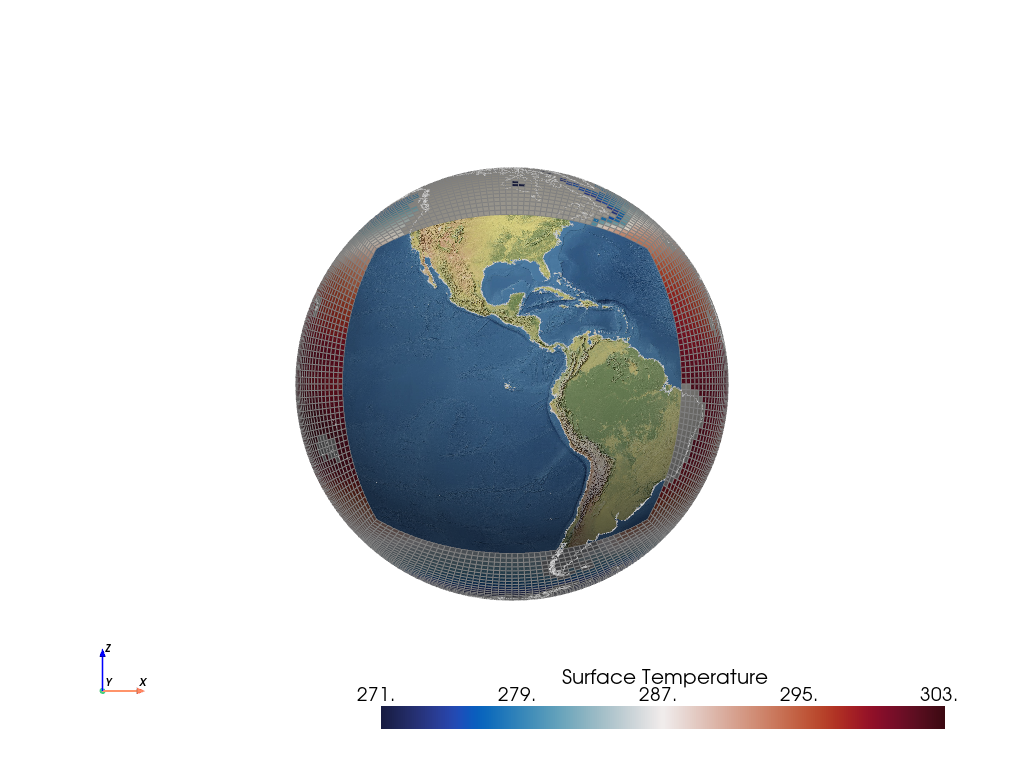
It’s not quite clear what’s going on here, although playing with the render interactively helps, but let’s transform the mesh to the Mollweider projection to help clarify matters:
plotter = gv.GeoPlotter(crs="+proj=moll lon_0=-90")
plotter.add_mesh(outside, show_edges=True)
plotter.add_coastlines()
plotter.add_base_layer(texture=gv.natural_earth_1())
plotter.view_xy()
plotter.show_axes()
plotter.show()
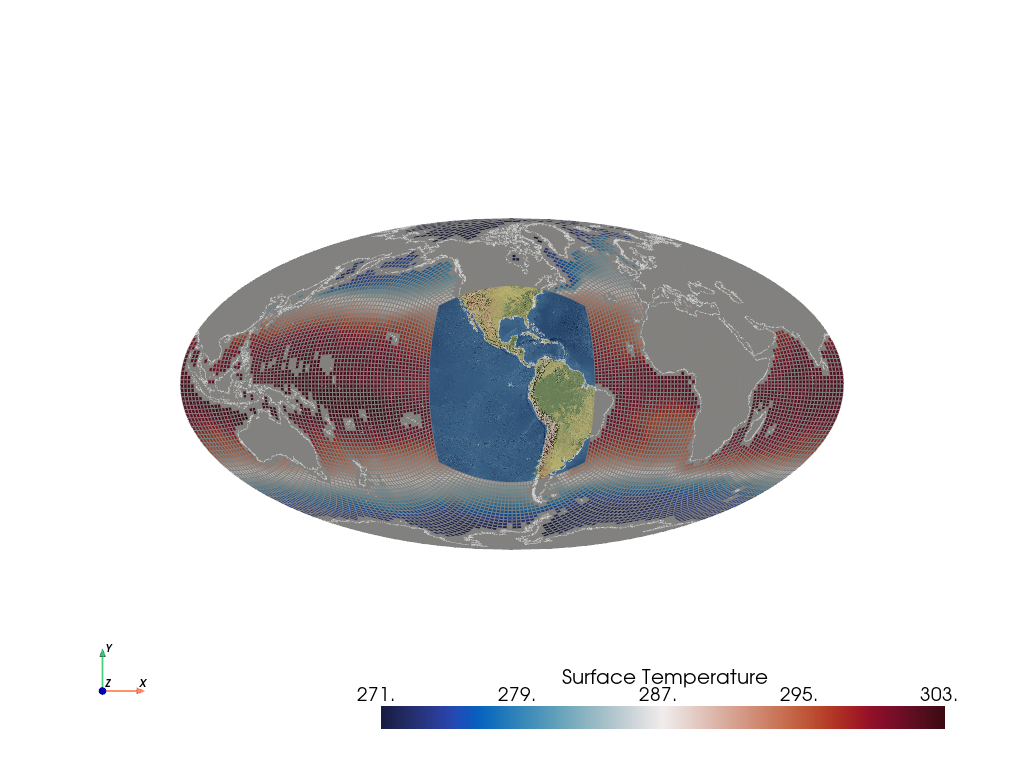
And again, let’s remove the land mask so that we can see more of the texture mapped base layer:
sea_outside = outside.threshold()

plotter = gv.GeoPlotter(crs="+proj=moll lon_0=-90")
plotter.add_mesh(sea_outside, show_edges=True)
plotter.add_coastlines()
plotter.add_base_layer(texture=gv.natural_earth_1())
plotter.view_xy()
plotter.show_axes()
plotter.show()
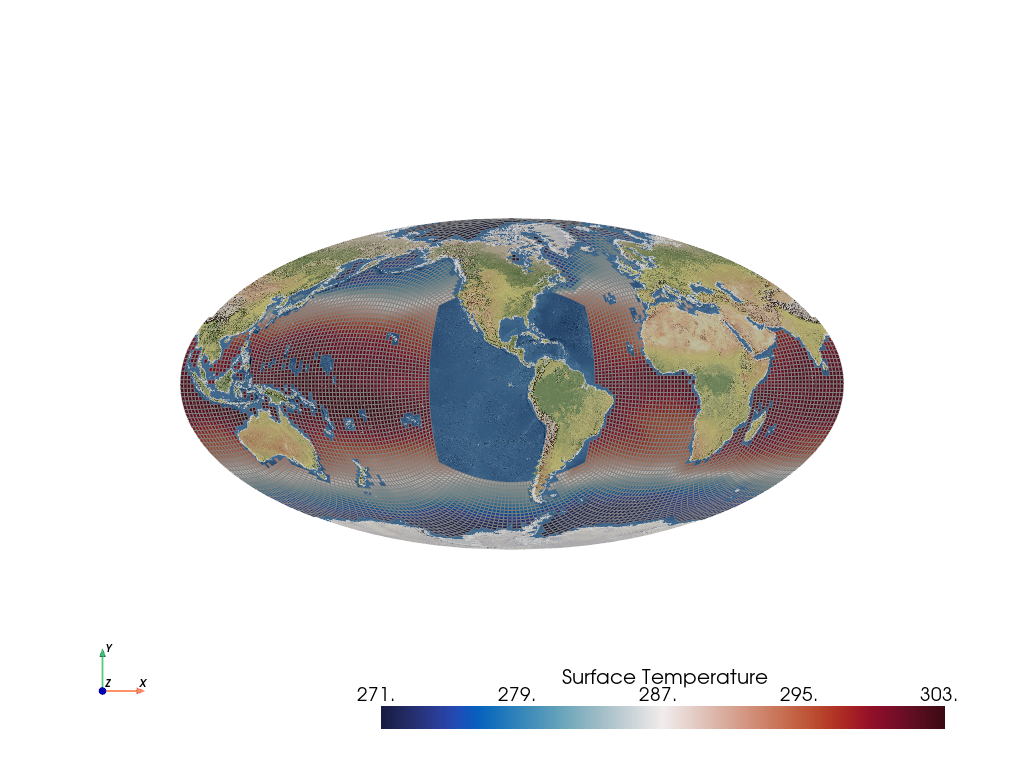
Also, explore the BBox class to create custom bounding box instances, and there is also the geovista.geodesic.wedge, a convenience function akin to the geovista.geodesic.panel. Plus you can easily render geodesic lines i.e., great circles, with geovista.geodesic.line.
The point here is that this is just the first step. GeoVista is aiming to provide a richer suite of such primitives to extract regions in similar ways. But the capability showcased by geovista.geodesic hints at the direction of where I’m taking geovista. The other point to make is that thanks to pyvista`and `vtk the extraction operation is pretty darn fast as opposed to other traditional approaches (perhaps I should garner metrics to back that up!)
So far we’ve demonstrated GeoVista’s ability to cope with unstructured data. Now let’s plot a curvilinear mesh using Met Office Unified Model (UM) ORCA2 Sea Water Potential Temperature data, with 10m Natural Earth coastlines and a 1:50m Natural Earth I base layer.
import geovista as gv
from geovista.pantry import um_orca2
import geovista.theme

# Load sample data.
sample = um_orca2()
sample
SampleStructuredXY(lons=masked_array(
  data=[[[79.0000386 , 80.9999614 , 80.9999614 , 79.0000386 ],
         [80.9999614 , 82.99988436, 82.99988436, 80.9999614 ],
         [82.99988436, 84.99980778, 84.99980778, 82.99988436],
         ...,
         [73.00026804, 75.00019222, 75.00019222, 73.00026804],
         [75.00019222, 77.00011564, 77.00011564, 75.00019222],
         [77.00011564, 79.0000386 , 79.0000386 , 77.00011564]],

        [[79.0000386 , 80.9999614 , 80.9999614 , 79.0000386 ],
         [80.9999614 , 82.99988436, 82.99988436, 80.9999614 ],
         [82.99988436, 84.99980778, 84.99980778, 82.99988436],
         ...,
         [73.00026804, 75.00019222, 75.00019222, 73.00026804],
         [75.00019222, 77.00011564, 77.00011564, 75.00019222],
         [77.00011564, 79.0000386 , 79.0000386 , 77.00011564]],

        ...,

        [[79.64671182, 80.35328818, 80.21580964, 79.78419036],
         [80.35328818, 80.71359769, 80.42645563, 80.21580964],
         [80.71359769, 80.97286538, 80.57911887, 80.42645563],
         ...,
         [78.80670771, 79.02713462, 79.42088113, 79.29079578],
         [79.02713462, 79.28640231, 79.57354437, 79.42088113],
         [79.28640231, 79.64671182, 79.78419036, 79.57354437]],

        [[79.78419036, 80.21580964, 80.07049194, 79.92950806],
         [80.21580964, 80.42645563, 80.13995863, 80.07049194],
         [80.42645563, 80.57911887, 80.19018369, 80.13995863],
         ...,
         [79.29079578, 79.42088113, 79.80981631, 79.7670223 ],
         [79.42088113, 79.57354437, 79.86004137, 79.80981631],
         [79.57354437, 79.78419036, 79.92950806, 79.86004137]],

        [[79.92950806, 80.07049194, 79.92950806, 80.07049194],
         [80.07049194, 80.13995863, 79.86004137, 79.92950806],
         [80.13995863, 80.19018369, 79.80981631, 79.86004137],
         ...,
         [79.7670223 , 79.80981631, 80.19018369, 80.2329777 ],
         [79.80981631, 79.86004137, 80.13995863, 80.19018369],
         [79.86004137, 79.92950806, 80.07049194, 80.13995863]]],
  mask=False,
  fill_value=1e+20), lats=masked_array(
  data=[[[-78.39699958, -78.39699958, -77.98417034, -77.98417034],
         [-78.39699958, -78.39699958, -77.98417034, -77.98417034],
         [-78.39699958, -78.39699958, -77.98417034, -77.98417034],
         ...,
         [-78.39699958, -78.39699958, -77.98417034, -77.98417034],
         [-78.39699958, -78.39699958, -77.98417034, -77.98417034],
         [-78.39699958, -78.39699958, -77.98417034, -77.98417034]],

        [[-77.98417034, -77.98417034, -77.56062102, -77.56062102],
         [-77.98417034, -77.98417034, -77.56062102, -77.56062102],
         [-77.98417034, -77.98417034, -77.56062102, -77.56062102],
         ...,
         [-77.98417034, -77.98417034, -77.56062102, -77.56062102],
         [-77.98417034, -77.98417034, -77.56062102, -77.56062102],
         [-77.98417034, -77.98417034, -77.56062102, -77.56062102]],

        [[-77.56062102, -77.56062102, -77.12238545, -77.12238545],
         [-77.56062102, -77.56062102, -77.12238545, -77.12238545],
         [-77.56062102, -77.56062102, -77.12238545, -77.12238545],
         ...,
         [-77.56062102, -77.56062102, -77.12238545, -77.12238545],
         [-77.56062102, -77.56062102, -77.12238545, -77.12238545],
         [-77.56062102, -77.56062102, -77.12238545, -77.12238545]],

        ...,

        [[ 50.15806078,  50.15806078,  50.19469569,  50.19469569],
         [ 50.15806078,  50.79547732,  50.83460864,  50.19469569],
         [ 50.79547732,  51.48856036,  51.52871073,  50.83460864],
         ...,
         [ 52.20935206,  51.48856036,  51.52871073,  52.25038138],
         [ 51.48856036,  50.79547732,  50.83460864,  51.52871073],
         [ 50.79547732,  50.15806078,  50.19469569,  50.83460864]],

        [[ 50.19469569,  50.19469569,  50.21356616,  50.21356616],
         [ 50.19469569,  50.83460864,  50.85387334,  50.21356616],
         [ 50.83460864,  51.52871073,  51.54816469,  50.85387334],
         ...,
         [ 52.25038138,  51.52871073,  51.54816469,  52.27036589],
         [ 51.52871073,  50.83460864,  50.85387334,  51.54816469],
         [ 50.83460864,  50.19469569,  50.21356616,  50.85387334]],

        [[ 50.21356616,  50.21356616,  50.21356616,  50.21356616],
         [ 50.21356616,  50.85387334,  50.85387334,  50.21356616],
         [ 50.85387334,  51.54816469,  51.54816469,  50.85387334],
         ...,
         [ 52.27036589,  51.54816469,  51.54816469,  52.27036589],
         [ 51.54816469,  50.85387334,  50.85387334,  51.54816469],
         [ 50.85387334,  50.21356616,  50.21356616,  50.85387334]]],
  mask=False,
  fill_value=1e+20), data=masked_array(
  data=[[--, --, --, ..., --, --, --],
        [--, --, --, ..., --, --, --],
        [--, --, --, ..., --, --, --],
        ...,
        [--, --, --, ..., --, --, --],
        [--, --, --, ..., --, --, --],
        [--, --, --, ..., --, --, --]],
  mask=[[ True,  True,  True, ...,  True,  True,  True],
        [ True,  True,  True, ...,  True,  True,  True],
        [ True,  True,  True, ...,  True,  True,  True],
        ...,
        [ True,  True,  True, ...,  True,  True,  True],
        [ True,  True,  True, ...,  True,  True,  True],
        [ True,  True,  True, ...,  True,  True,  True]],
  fill_value=9.96921e+36,
  dtype=float32), name='Sea Water Potential Temperature', units='degC', steps=None, ndim=2)
Create the mesh from the sample data.
mesh = gv.Transform.from_2d(sample.lons, sample.lats, data=sample.data)
Remove cells from the mesh with NaN values.
mesh = mesh.threshold()
Plot the mesh.
plotter = gv.GeoPlotter()
sargs = {"title": f"{sample.name} / {sample.units}"}
plotter.add_mesh(mesh, show_edges=True, scalar_bar_args=sargs)
plotter.add_base_layer(texture=gv.natural_earth_1())
plotter.add_coastlines(resolution="10m")
plotter.view_xy()
plotter.add_axes()
plotter.show()
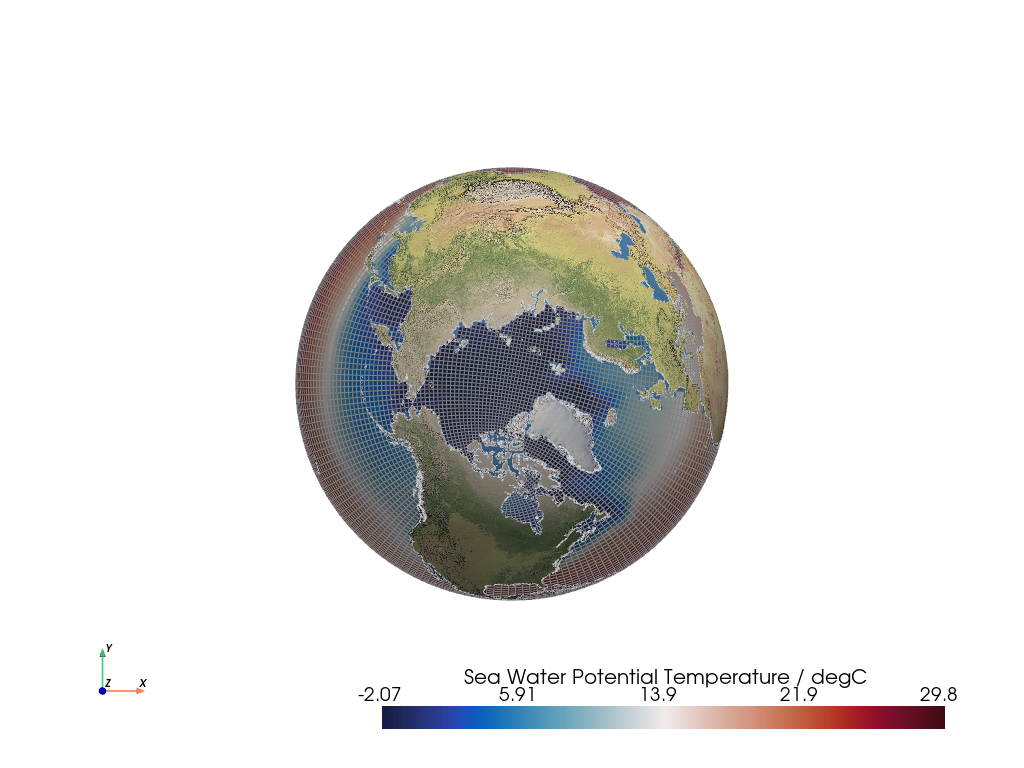
Important
Experimental
GeoVista is still in the experimental stages. They would love your feedback, but as immature packages their API, documentation, test coverage and CI are still ‘under construction’.
Whilst you’re here, why not hop on over to the pyvista-xarray project and check it out!
xarray DataArray accessors for PyVista to visualize datasets in 3D
You must import pvxarray in order to register the DataArray accessor with xarray. After which, a pyvista namespace of accessors will be available.
import pvxarray  # noqa
import xarray as xr
Load mean sea surface temperature dataset
ds = xr.open_dataset("sst.mnmean.nc", engine="netcdf4")
Plot in 3D
ds.sst[0].pyvista.plot(x="lon", y="lat", show_edges=True, cpos="xy")

Or grab the mesh object for use with PyVista and GeoVista.
mesh = ds.sst[0].pyvista.mesh(x="lon", y="lat")

plotter = gv.GeoPlotter()
plotter.add_mesh(mesh, show_edges=True)
plotter.add_coastlines()
plotter.add_base_layer(texture=gv.natural_earth_hypsometric())
plotter.view_xz()
plotter.show_axes()
plotter.show(cpos="xy")
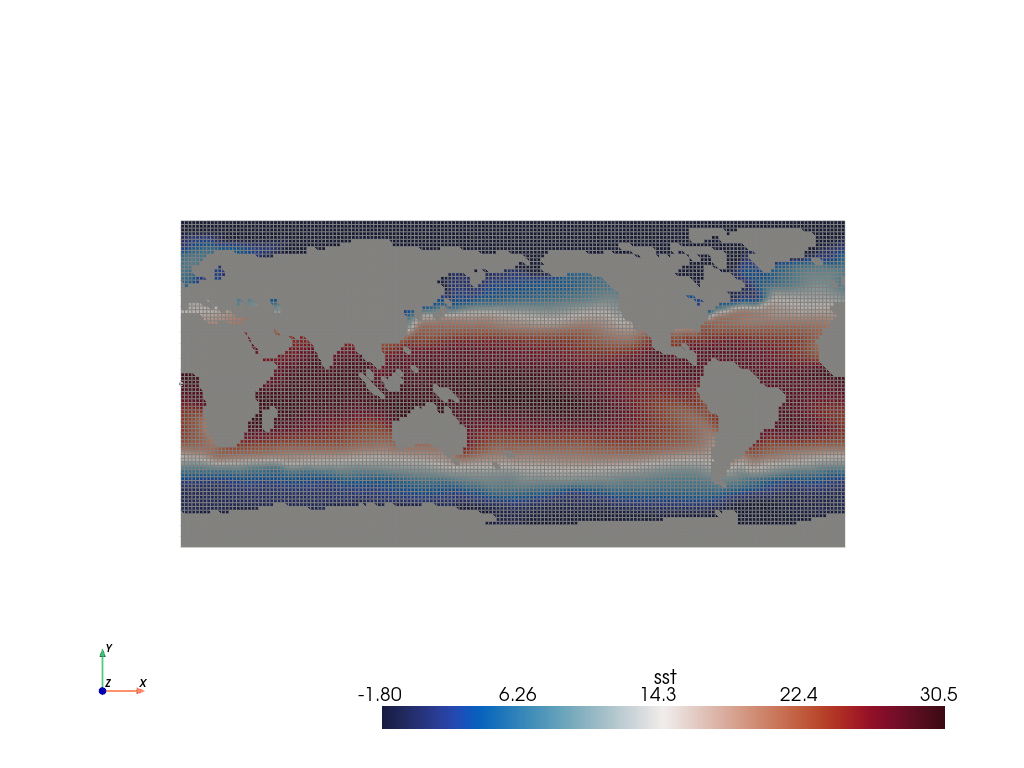
Note
This is inspired by Xarray Fundamentals in Xarray Tutorial.
Total running time of the script: (1 minutes 2.894 seconds)