Note
Go to the end to download the full example code. or to run this example in your browser via Binder
PyVista and VTK Together#
PyVista is best known for is easy to use plotting API – being familiar to most Python users already experienced with libraries like Matplotlib. Many people benefit from combining the power of VTK’s Python bindings for their data pipelines and the flexibility and simplicity of PyVista for 3D rendering. The following section demonstrates this usage scenario.
Tip
In case it was not made clear in the What is a Mesh? section, PyVista mesh classes are subclasses of their VTK counterparts - which means PyVista can be intermixed with VTK workflows.
Nothing stops you from using VTK classes and then wrapping the output with PyVista for streamlined plotting. For example:
import pyvista as pv
import vtk
from pyvista import examples
Create a circle using vtk
polygonSource = vtk.vtkRegularPolygonSource()  # noqa: N816
polygonSource.GeneratePolygonOff()
polygonSource.SetNumberOfSides(50)
polygonSource.SetRadius(5.0)
polygonSource.SetCenter(0.0, 0.0, 0.0)
polygonSource.Update()
wrap and plot using pyvista
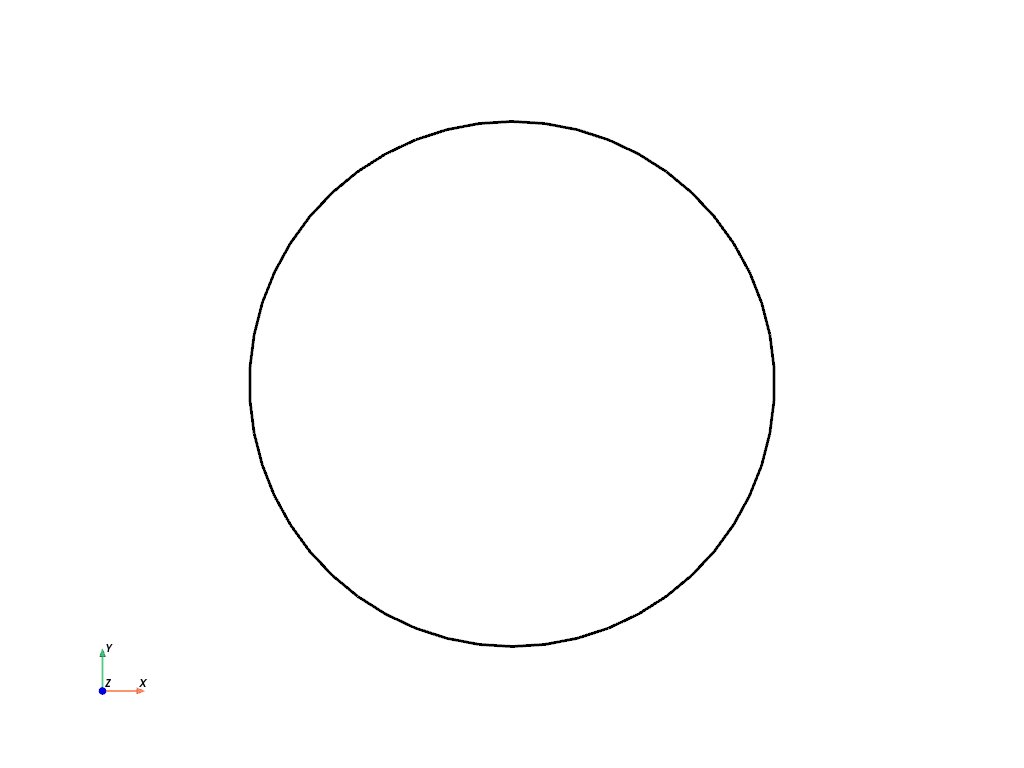
In this manner, you can get the “best of both worlds” should you need the flexibility of PyVista and the raw power of VTK.
Note
You can use pyvista.Polygon() for a one line replacement of
the above VTK code.
VTK Algorithms#
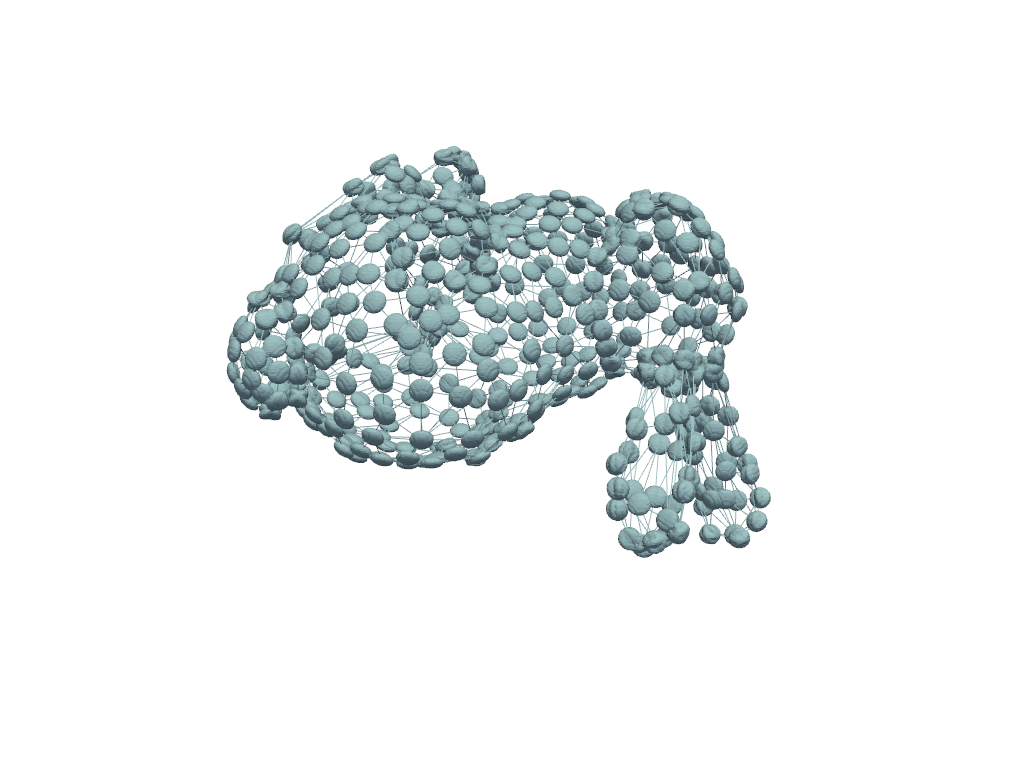
Perhaps there is a VTK algorithm that is not (yet) exposed in PyVista that you’d like to use. This is easy enough to work with since PyVista objects are VTK objects. We can pass our PyVista meshes to the VTK algorithm, then wrap the output for plotting, further filtering, or anything.
mesh = examples.download_bunny_coarse()
Initialize VTK algorithm
splatter = vtk.vtkGaussianSplatter()
Pass PyVista object as input to VTK
splatter.SetInputData(mesh)
Set parameters
Retrieve output and wrap with PyVista
Use PyVista to produce contours
cntrs = vol.contour([0.95 * splatter.GetRadius()])
Use PyVista to plot
pl = pv.Plotter()
pl.add_mesh(mesh, style="wireframe")
pl.add_mesh(cntrs, color=True)
pl.show()
Note
The above example was adapted from VTK’s Embed Points Into Volume
Total running time of the script: (0 minutes 1.962 seconds)