Note
Go to the end to download the full example code. or to run this example in your browser via Binder
Sphere Widget#
The sphere widget can be enabled and disabled by the
pyvista.Plotter.add_sphere_widget() and
pyvista.Plotter.clear_sphere_widgets() methods respectively.
This is a very versatile widget as it can control vertex location that can
be used to control or update the location of just about anything.
We don’t have any convenient helper methods that utilize this widget out of the box, but we have added a lot of ways to use this widget so that you can easily add several widgets to a scene.
Let’s look at a few use cases that all update a surface mesh.
Example A#
Use a single sphere widget
import numpy as np
import pyvista as pv

# Create a triangle surface
surf = pv.PolyData()
surf.points = np.array(
    [
        [-10, -10, -10],
        [10, 10, -10],
        [-10, 10, 0],
    ]
)
surf.faces = np.array([3, 0, 1, 2])

pl = pv.Plotter()


def callback(point) -> None:
    surf.points[0] = point


pl.add_sphere_widget(callback)
pl.add_mesh(surf, color=True)

pl.show_grid()
pl.show()
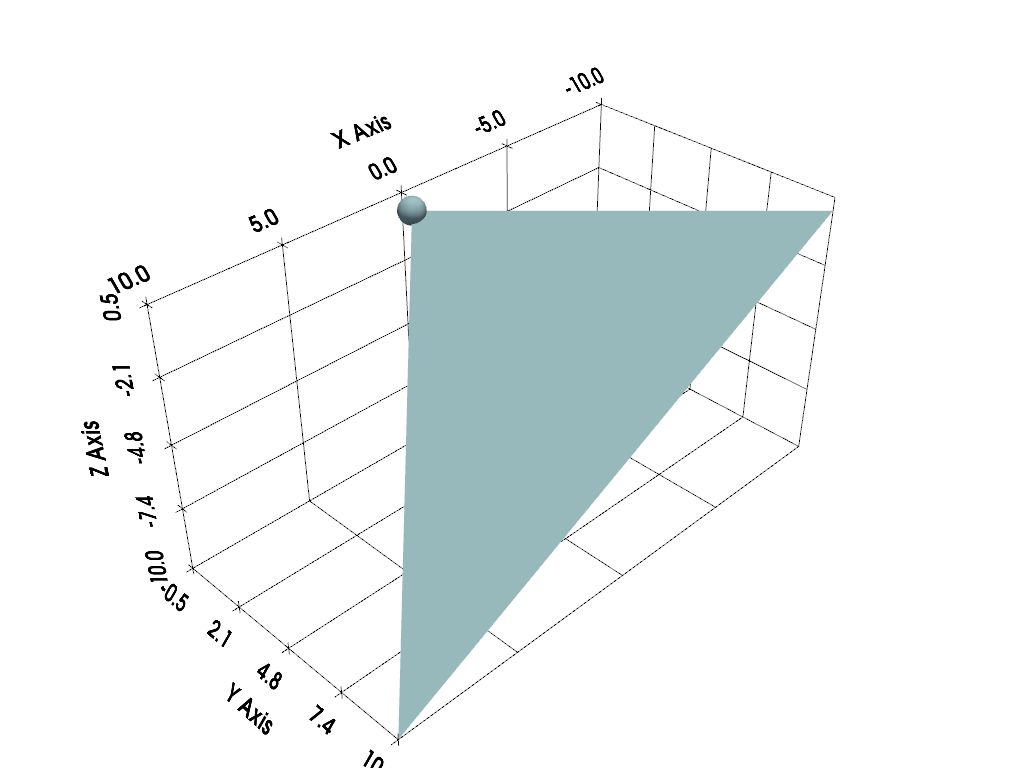
And here is a screen capture of a user interacting with this
Example B#
Use several sphere widgets at once
import numpy as np
import pyvista as pv

# Create a triangle surface
surf = pv.PolyData()
surf.points = np.array(
    [
        [-10, -10, -10],
        [10, 10, -10],
        [-10, 10, 0],
    ]
)
surf.faces = np.array([3, 0, 1, 2])


pl = pv.Plotter()


def callback(point, i) -> None:
    surf.points[i] = point


pl.add_sphere_widget(callback, center=surf.points)
pl.add_mesh(surf, color=True)

pl.show_grid()
pl.show()
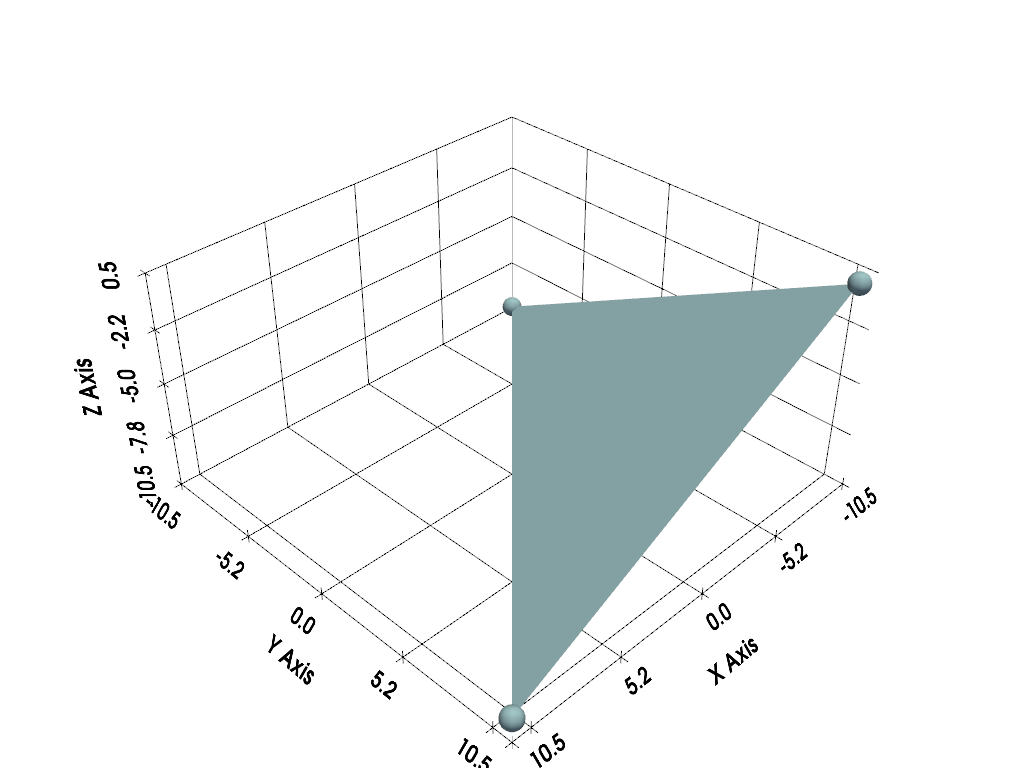
And here is a screen capture of a user interacting with this
Example C#
This one is the coolest - use four sphere widgets to update perturbations on a surface and interpolate between them with some boundary conditions
from itertools import cycle

import matplotlib as mpl
import numpy as np
import pyvista as pv
from scipy.interpolate import griddata


def get_colors(n):
    """A helper function to get n colors."""
    cycler = mpl.rcParams["axes.prop_cycle"]
    colors = cycle(cycler)
    return [next(colors)["color"] for i in range(n)]


# Create a grid to interpolate to
xmin, xmax, ymin, ymax = 0, 100, 0, 100
x = np.linspace(xmin, xmax, num=25)
y = np.linspace(ymin, ymax, num=25)
xx, yy, zz = np.meshgrid(x, y, [0])

# Make sure boundary conditions exist
boundaries = np.array([[xmin, ymin, 0], [xmin, ymax, 0], [xmax, ymin, 0], [xmax, ymax, 0]])

# Create the PyVista mesh to hold this grid
surf = pv.StructuredGrid(xx, yy, zz)

# Create some initial perturbations
# - this array will be updated inplace
points = np.array([[33, 25, 45], [70, 80, 13], [51, 57, 10], [25, 69, 20]])


# Create an interpolation function to update that surface mesh
def update_surface(point, i) -> None:
    points[i] = point
    tp = np.vstack((points, boundaries))
    zz = griddata(tp[:, 0:2], tp[:, 2], (xx[:, :, 0], yy[:, :, 0]), method="cubic")
    surf.points[:, -1] = zz.ravel(order="F")


# Get a list of unique colors for each widget
colors = get_colors(len(points))
# Begin the plotting routine
pl = pv.Plotter()

# Add the surface to the scene
pl.add_mesh(surf, color=True)

# Add the widgets which will update the surface
pl.add_sphere_widget(update_surface, center=points, color=colors, radius=3)
# Add axes grid
pl.show_grid()

# Show it!
pl.show()
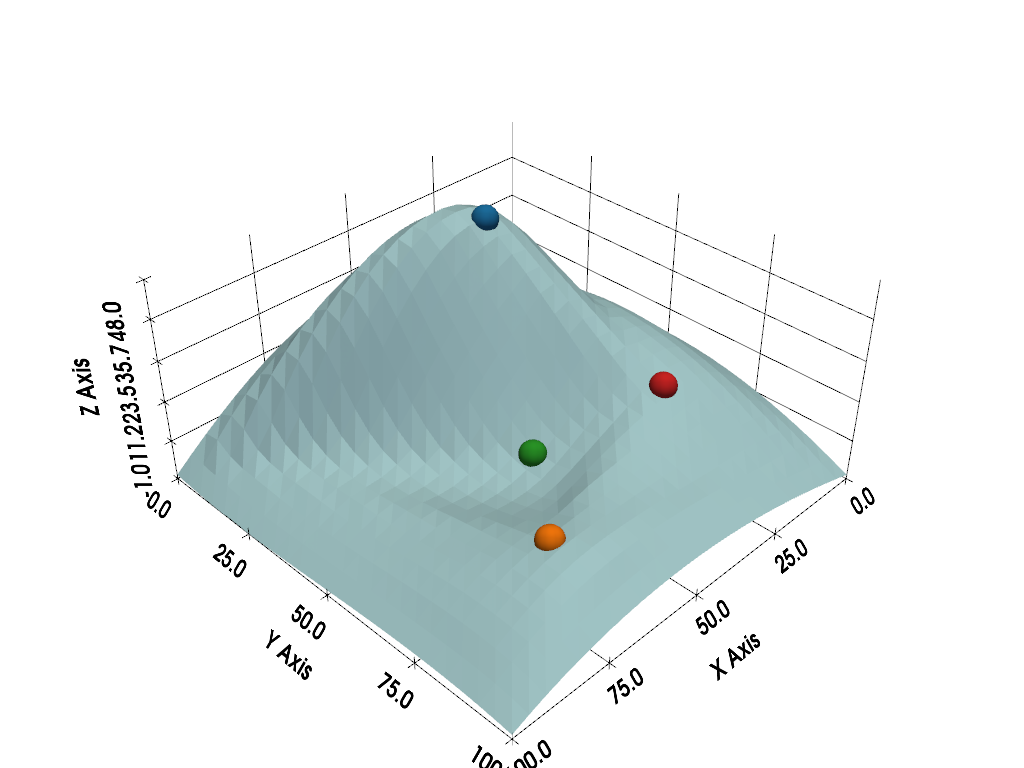
And here is a screen capture of a user interacting with this
Total running time of the script: (0 minutes 1.026 seconds)