Note
Go to the end to download the full example code. or to run this example in your browser via Binder
Test out PyVista’s Jupyter Backend#
Become familiar with PyVista Jupyter backend.
import pyvista as pv

# Set/enable the backed
pv.set_jupyter_backend("trame")
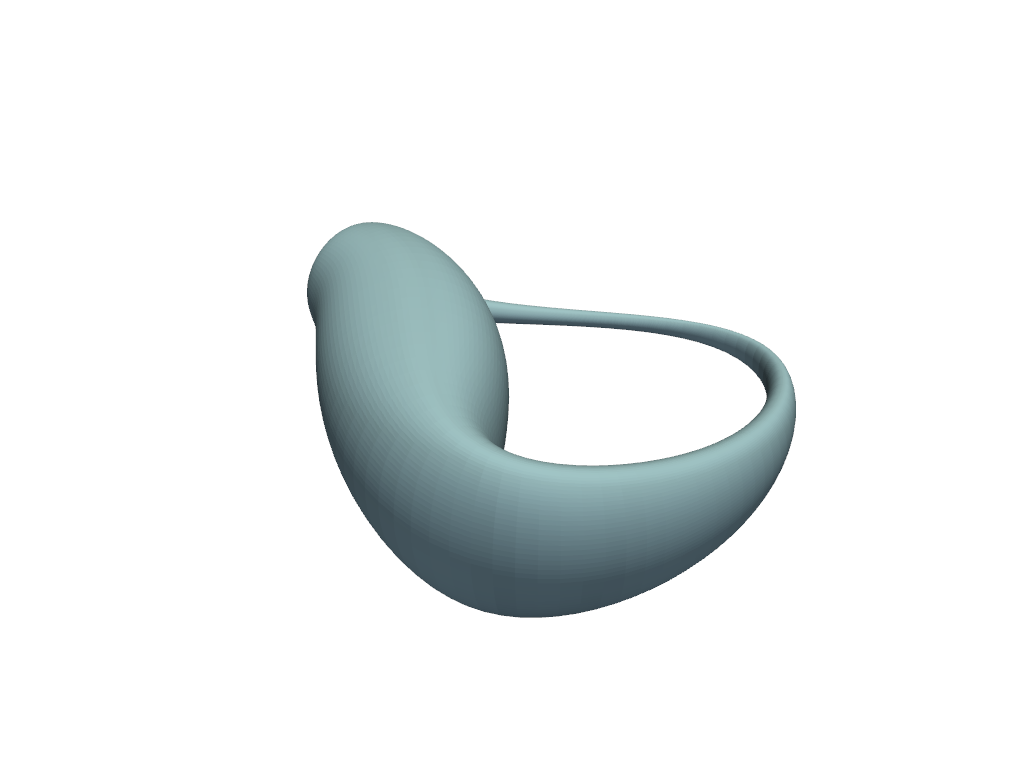
pl = pv.Plotter()
pl.add_mesh(pv.ParametricKlein())
pl.show()
Client-side rendering only (in browser)
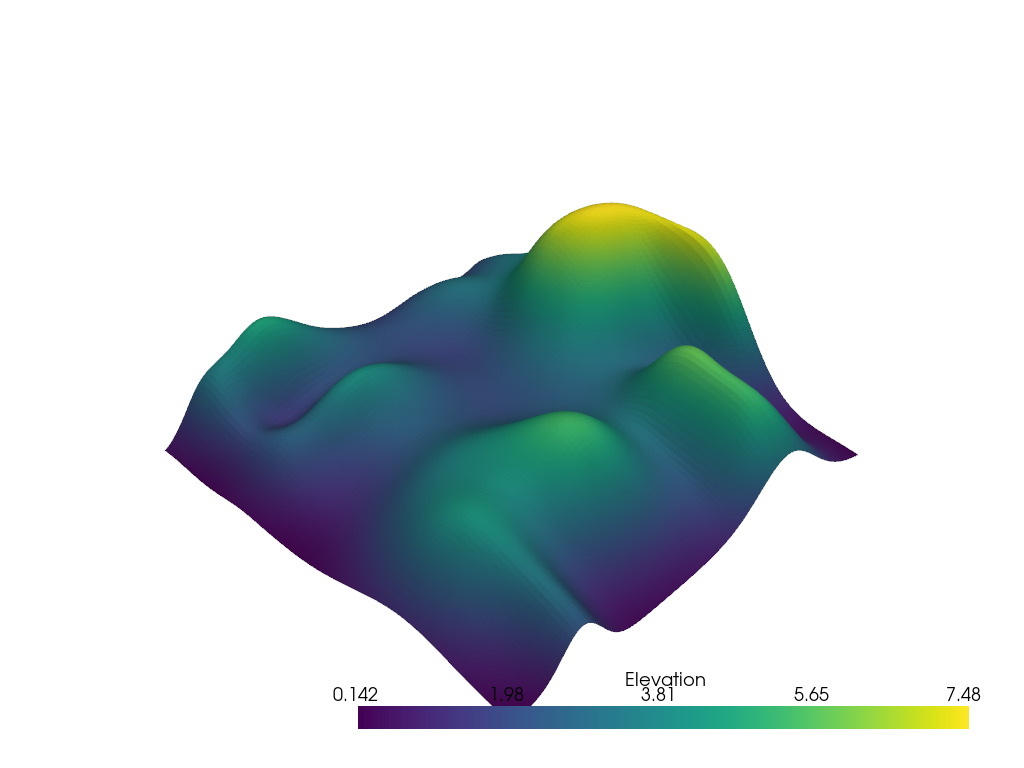
pl = pv.Plotter()
pl.add_mesh(pv.ParametricRandomHills().elevation())
pl.show(jupyter_backend="client")
/home/runner/work/pyvista-tutorial/pyvista-tutorial/tutorial/00_jupyter/jupyter.py:25: UserWarning: Not within a jupyter notebook environment.
Ignoring ``jupyter_backend``.
  pl.show(jupyter_backend="client")
Server-side rendering only
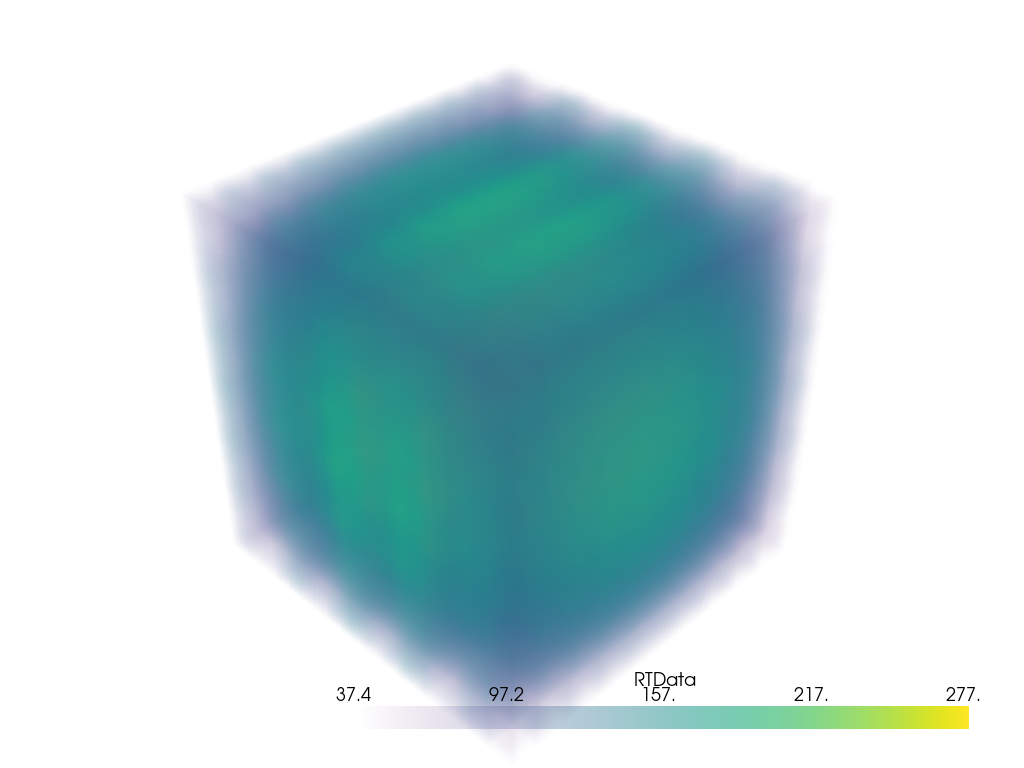
pl = pv.Plotter()
pl.add_volume(pv.Wavelet())
pl.show(jupyter_backend="server")
/home/runner/work/pyvista-tutorial/pyvista-tutorial/tutorial/00_jupyter/jupyter.py:33: UserWarning: Not within a jupyter notebook environment.
Ignoring ``jupyter_backend``.
  pl.show(jupyter_backend="server")
Total running time of the script: (0 minutes 1.598 seconds)