Note
Go to the end to download the full example code. or to run this example in your browser via Binder
Create VTK Objects#
This exercise walks through the creation of a few different types of VTK datasets.
import numpy as np
import pyvista as pv
import vtk

try:
    from vtkmodules.util.numpy_support import numpy_to_vtk
except:  # noqa: E722
    from vtk.util.numpy_support import numpy_to_vtk
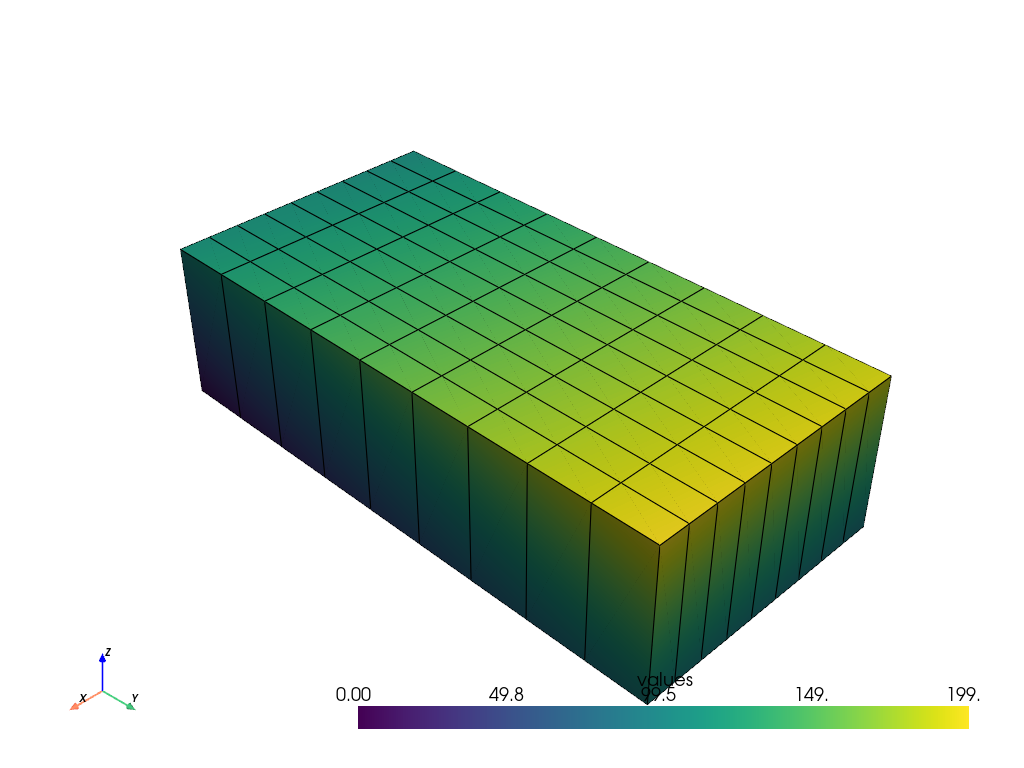
Create vtkImageData#
image = vtk.vtkImageData()
image.SetDimensions(10, 10, 2)
image.SetSpacing(1, 2, 5)
image.SetOrigin(-0.5, -3, 0)
Add point data
<vtkmodules.vtkCommonDataModel.vtkImageData(0x564bfd2f8f30) at 0x7fcb4b963c40>
Plot with PyVista for simplicity
pv.plot(image, show_edges=True)
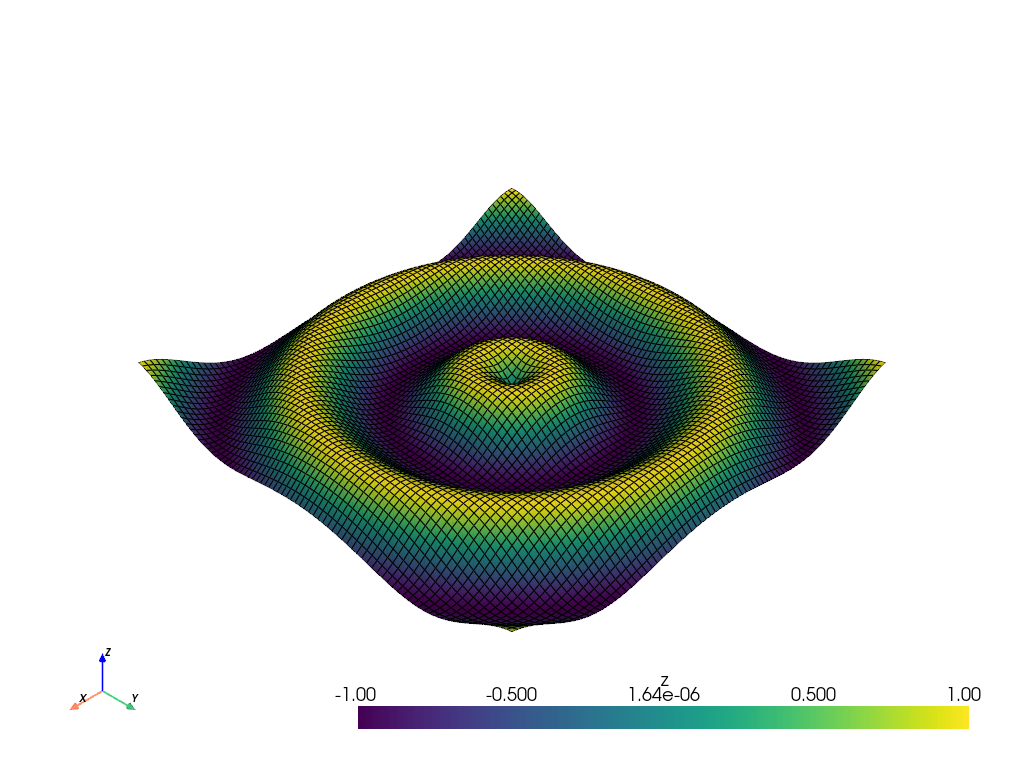
Create vtkStructuredGrid#
# Define structured points with NumPy
x = np.arange(-10, 10, 0.25)
y = np.arange(-10, 10, 0.25)
x, y = np.meshgrid(x, y)
r = np.sqrt(x**2 + y**2)
z = np.sin(r)

# Join the points
values = np.c_[x.ravel(), y.ravel(), z.ravel()]

coords = numpy_to_vtk(values)

points = vtk.vtkPoints()
points.SetData(coords)

grid = vtk.vtkStructuredGrid()
grid.SetDimensions(*z.shape, 1)
grid.SetPoints(points)
grid
<vtkmodules.vtkCommonDataModel.vtkStructuredGrid(0x564bf68cbf90) at 0x7fcb2fda8700>
Add point data
arr = numpy_to_vtk(z.ravel())
arr.SetName("z")  # CRITICAL
grid.GetPointData().SetScalars(arr)
0
Plot with PyVista for simplicity
pv.plot(grid, show_edges=True)
Total running time of the script: (0 minutes 0.406 seconds)