PyVista Tutorial#
Welcome to PyVista’s tutorial!
Here you can find all the resources to be up and running with PyVista in no time. Feel free to reference our dedicated documentation at PyVista Documentation
Here’s a quick demo of PyVista running within Jupyterlab.
Here’s a quick demo of PyVista running within a terminal using IPython.
Quick Links#
Jump right to the tutorial content.
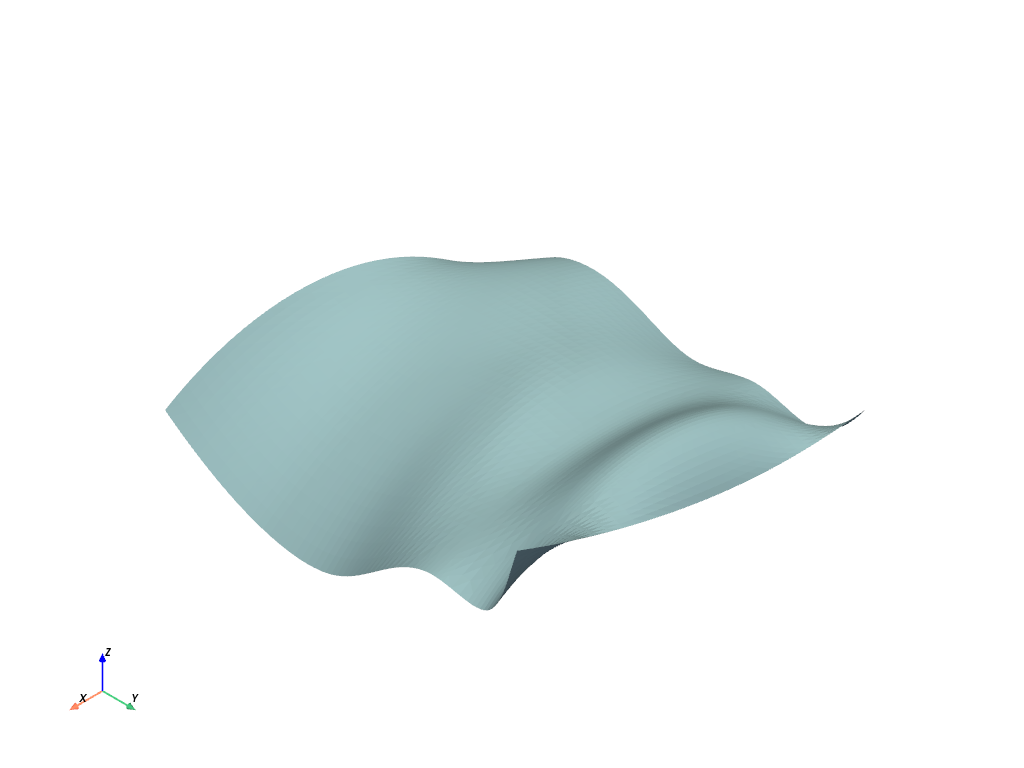
from pyvista import examples
dataset = examples.download_saddle_surface()
dataset.plot()
Get PyVista setup on your environment.
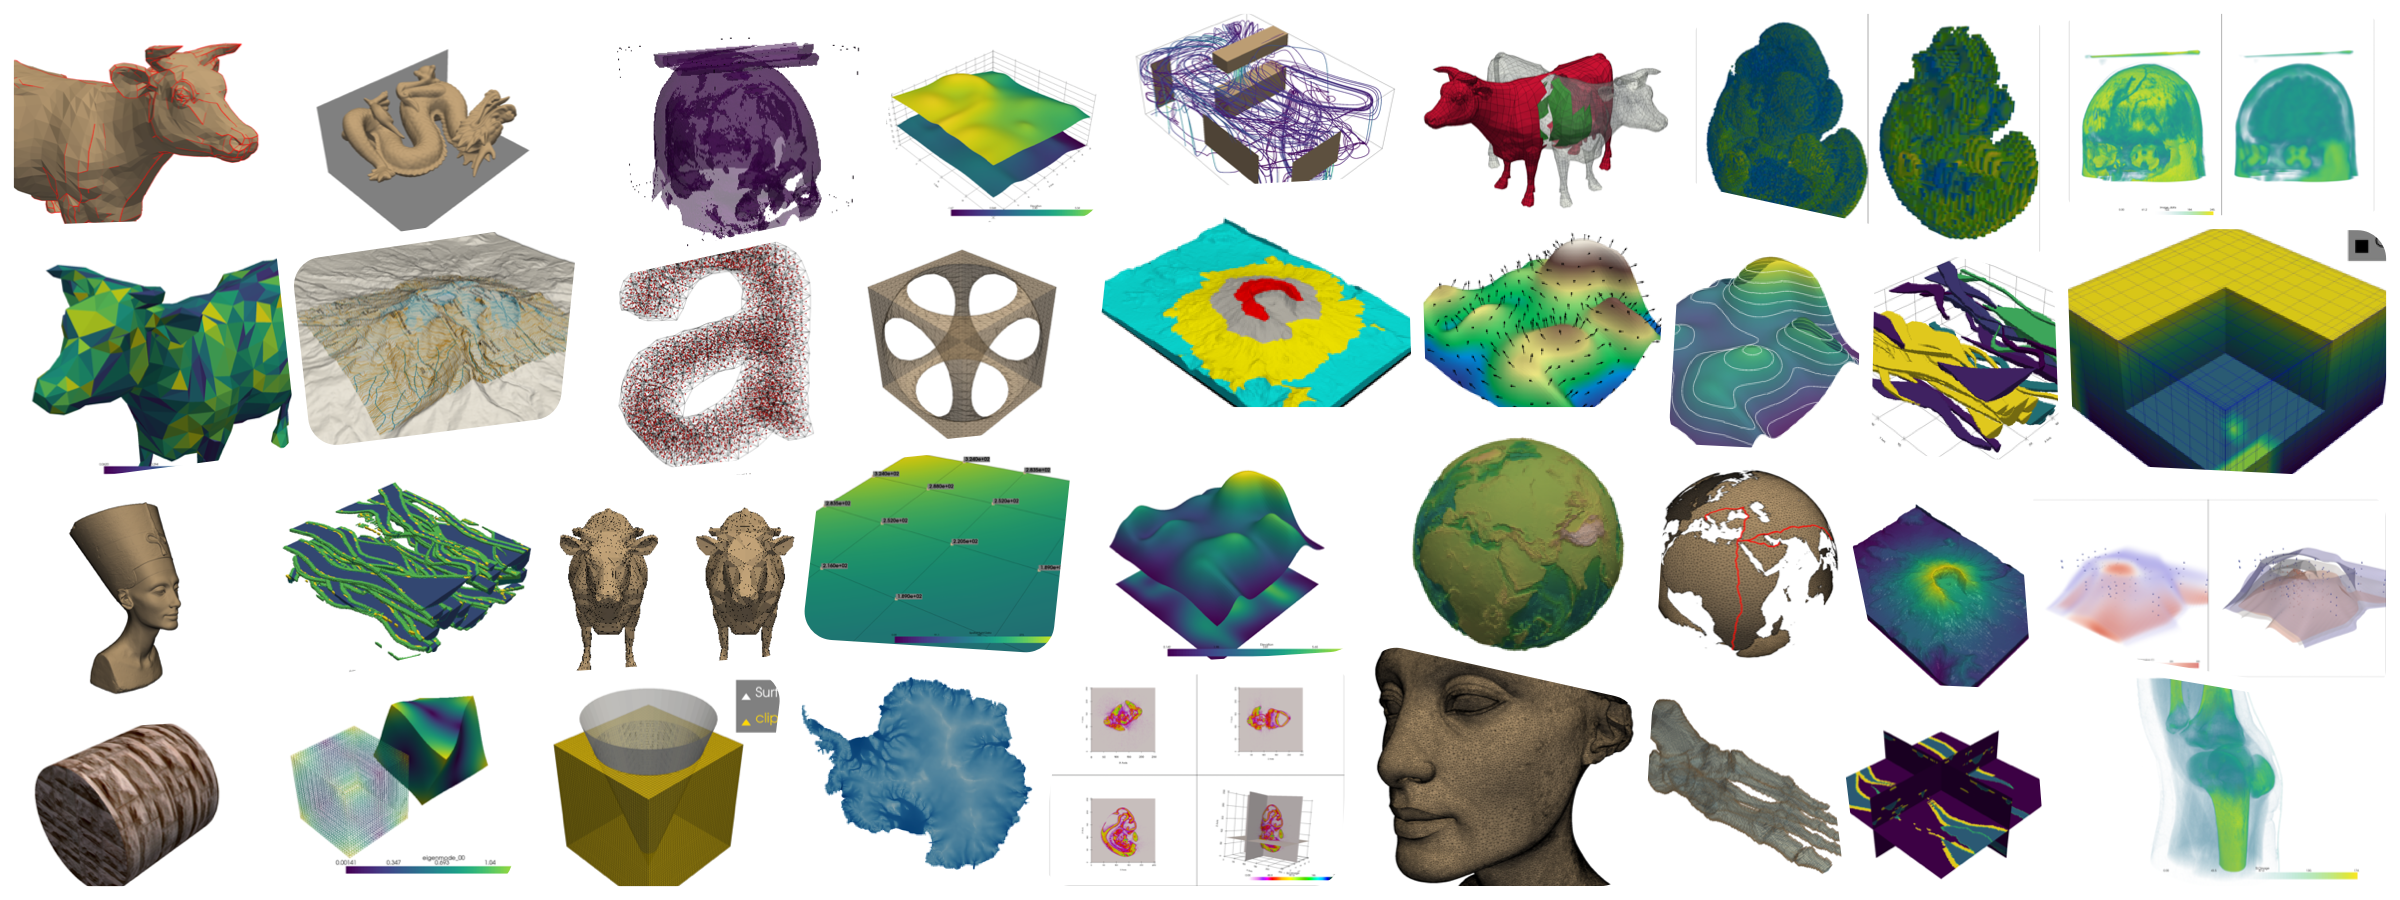
Example Gallery#
Click below for our extensive example gallery!
PyVista Overview#
PyVista is a general purpose 3D visualization library used for over 500+ open source projects and many closed source projects for the visualization of everything from computer aided engineering and geophysics to volcanoes and digital artwork.
PyVista exposes a Pythonic API to the Visualization Toolkit (VTK) to provide tooling that is immediately usable without any prior knowledge of VTK and is being built as the 3D equivalent of Matplotlib, with plugins to Jupyter to enable visualization of 3D data using both server and client-side rendering.
We will provide a hands-on tutorial accessible to anyone with internet access and a computer via many of PyVista’s existing example Jupyter notebooks and new material through a comprehensive overview highlighting popular 3D visualization use cases.
Tutorial Description#
Use PyVista to create 3D visualizations from a variety of datasets in common formats.
Overview the classes and data structures of PyVista with real-world examples.
Be familiar with the various filters and features of PyVista.
Know which Python libraries are used and can be used by PyVista (meshio, trimesh etc).
We see this tutorial catering to anyone who wants to visualize data in any domain, and this ranges from basic Python users to advanced power users.
Basic knowledge of Python to get started. Be able to install Jupyter Lab on your machine and be up and running.
Intermediate users will want to be familiar with NumPy and other libraries that are compatible with PyVista, like trimesh or meshio.
Advanced users should be familiar with the Visualization Toolkit (VTK), general data science, and GUI frameworks like Qt.
Instructor Bios#
Alexander Kaszynski#
Alex Kaszynski, co-creator of PyVista and creator of the PyAnsys organization.
Advocate for all things open source and has contributed to the creation of Ansys’s open source projects at Ansys and PyMAPDL. Enjoys presenting and demoing Python, especially 3D visualization but also its application to CAE and automation.
Bane Sullivan#
Bane Sullivan, co-creator of PyVista, is a Research Software Engineer working at the intersection of geoscience, visualization, and data science.
Bane is a geophysicist/hydrologist by training and has been working to grow PyVista’s adoption within the subsurface geoscience communities, previously presenting PyVista at Transform 2021.
Tetsuo Koyama#
Tetsuo Koyama is interested in scientific computing and visualization with computer graphics. Developer team member of PyVista. Past experience as a speaker:
Bill Little#
Bill Little, creator of GeoVista, is a software engineer working at the UK Met Office and a core developer on SciTools, which includes Cartopy and Iris.
Tutorial Prerequisites#
We see this tutorial catering to anyone who wants to visualize data in any domain, and this ranges from basic Python users to advanced power users. In fact, our tutorial instructors and community members are involved in any domain.
Basic knowledge of Python to get started. Be able to install Jupyter Lab on your machine and be up and running.
Intermediate users will want to be familiar with NumPy and other libraries that are compatible with PyVista, like trimesh or meshio.
Advanced users will be familiar with GUI frameworks like Qt, VTK, and advanced data science.