Introduction#
This section includes a brief explanation of the background and history of PyVista.
Tip
This section of the tutorial was adopted from Getting Started chapter of the PyVista documentation.
PyVista is one of many visualization libraries built on top VTK - The Visualization Toolkit. It’s primary intent was to be an abstraction layer over VTK to provide convenience and functionality to VTK exposed “Pythonically”.
Brief History#
PyVista was created out of a desire to make a reusable higher level abstraction layer that “wraps” the lower level functionality of VTK.
Originally created as a sub-libary for femorph by @akaszynski in 2016.
First posted to GitHub as akaszynski/vtki back in 2017.
@banesullivan joined the project in 2018 to expand functionality, features, and improve the documentation with examples.
First release of PyVista on PyPI in 2019.
As of July 2025, Over 190+ contributors and ~3.2k Stars on GitHub.
Used by at least 4.6k other libraries, examples, and repositories on GitHub.
Greatly expanded internal presence and continuing support thanks to
Greatly expanded PyVista ecosystem thanks to


Please take a look at the contributors page and the active list of authors to learn more about the developers of PyVista.
Made with contrib rocks.
Who is PyVista for?#
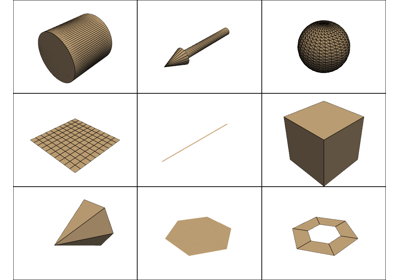
Anyone who wants to visualize 3D data using Python.
Here’s how people are using PyVista:
Feel free to write about what you have achieved with PyVista or what you would like to achieve in the future.
Brief Examples#
Read and Plot a Surface Mesh#
VTK is powerful, really powerful! You can do just about anything within VTK and
PyVista just wants to make it easier to do it using numpy-like and
Matplotlib-like syntax. For example, if you wanted to be able to plot a
simple surface mesh:
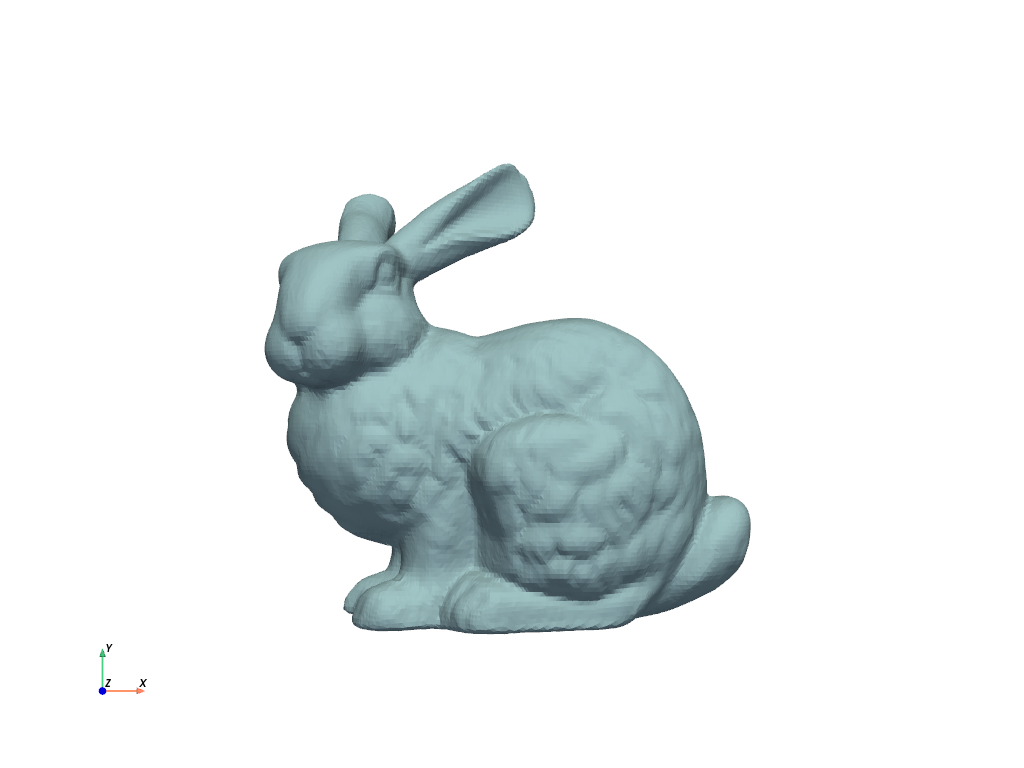
Load and plot a surface dataset
Using |
Using PyVista |
|---|---|
import vtk
reader = vtk.vtkSTLReader()
reader.SetFileName("bunny.stl")
mapper = vtk.vtkPolyDataMapper()
output_port = reader.GetOutputPort()
mapper.SetInputConnection(output_port)
actor = vtk.vtkActor()
actor.SetMapper(mapper)
ren = vtk.vtkRenderer()
renWin = vtk.vtkRenderWindow()
renWin.AddRenderer(ren)
iren = vtk.vtkRenderWindowInteractor()
iren.SetRenderWindow(renWin)
ren.AddActor(actor)
iren.Initialize()
renWin.Render()
iren.Start()
del iren, renWin
|
from pyvista import examples
mesh = examples.download_bunny()
mesh.plot(cpos='xy')
|
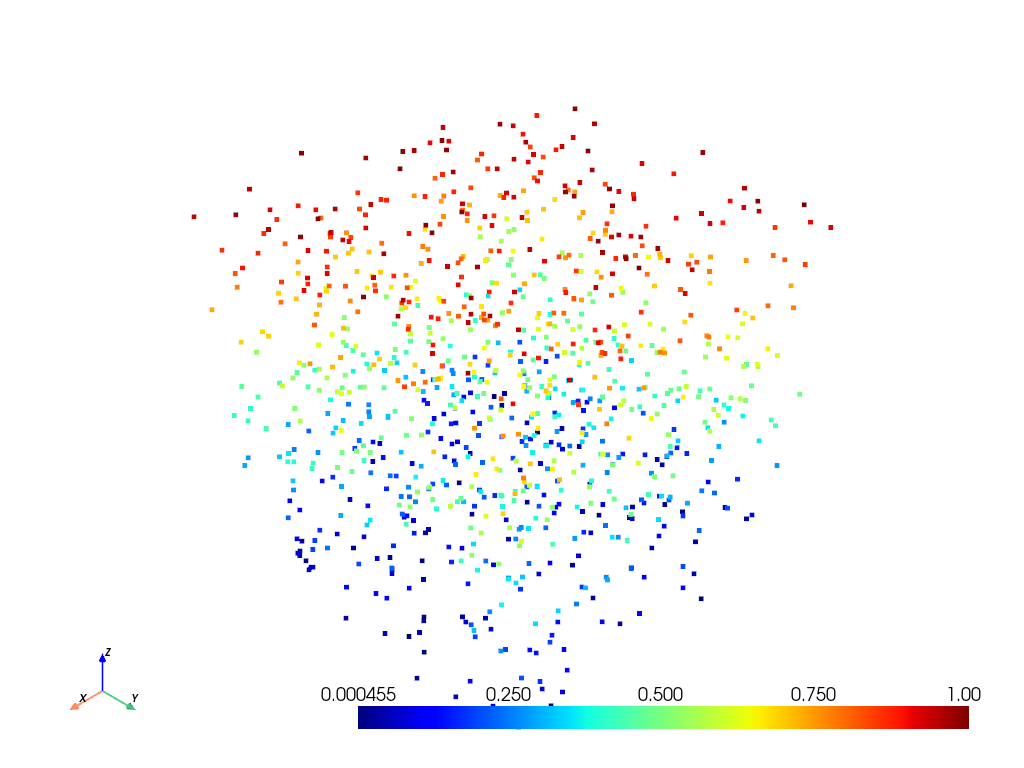
Construct a Simple Point Cloud with Color#
These examples demonstrate how you can use both PyVista and VTK to construct
and visualize a point cloud using numpy. Here, we demonstrate how easy it
is to work directly with NumPy arrays.
This example was taken from this SO Answer.
import vtk
from numpy import random

class VtkPointCloud:

    def __init__(self, zMin=-10.0, zMax=10.0, maxNumPoints=1e6):
        self.maxNumPoints = maxNumPoints
        self.vtkPolyData = vtk.vtkPolyData()
        self.clearPoints()
        mapper = vtk.vtkPolyDataMapper()
        mapper.SetInputData(self.vtkPolyData)
        mapper.SetColorModeToDefault()
        mapper.SetScalarRange(zMin, zMax)
        mapper.SetScalarVisibility(1)
        self.vtkActor = vtk.vtkActor()
        self.vtkActor.SetMapper(mapper)

    def addPoint(self, point):
        if self.vtkPoints.GetNumberOfPoints() < self.maxNumPoints:
            pointId = self.vtkPoints.InsertNextPoint(point[:])
            self.vtkDepth.InsertNextValue(point[2])
            self.vtkCells.InsertNextCell(1)
            self.vtkCells.InsertCellPoint(pointId)
        else:
            r = random.randint(0, self.maxNumPoints)
            self.vtkPoints.SetPoint(r, point[:])
        self.vtkCells.Modified()
        self.vtkPoints.Modified()
        self.vtkDepth.Modified()

    def clearPoints(self):
        self.vtkPoints = vtk.vtkPoints()
        self.vtkCells = vtk.vtkCellArray()
        self.vtkDepth = vtk.vtkDoubleArray()
        self.vtkDepth.SetName('DepthArray')
        self.vtkPolyData.SetPoints(self.vtkPoints)
        self.vtkPolyData.SetVerts(self.vtkCells)
        self.vtkPolyData.GetPointData().SetScalars(self.vtkDepth)
        self.vtkPolyData.GetPointData().SetActiveScalars('DepthArray')

pointCloud = VtkPointCloud()
for k in range(1000):
    point = 20*(random.rand(3)-0.5)
    pointCloud.addPoint(point)
pointCloud.addPoint([0,0,0])
pointCloud.addPoint([0,0,0])
pointCloud.addPoint([0,0,0])
pointCloud.addPoint([0,0,0])

# Renderer
renderer = vtk.vtkRenderer()
renderer.AddActor(pointCloud.vtkActor)
renderer.SetBackground(.2, .3, .4)
renderer.ResetCamera()

# Render Window
renderWindow = vtk.vtkRenderWindow()
renderWindow.AddRenderer(renderer)

# Interactor
renderWindowInteractor = vtk.vtkRenderWindowInteractor()
renderWindowInteractor.SetRenderWindow(renderWindow)

# Begin Interaction
renderWindow.Render()
renderWindowInteractor.Start()
import pyvista as pv
import numpy as np
points = np.random.random((1000, 3))
pc = pv.PolyData(points)
pc.plot(scalars=points[:, 2], point_size=5.0, cmap='jet')
How other Libraries Compare#
There are a ton of excellent visualization libraries out there and if you’re interested in data visualization, I’d encourage you for explore them all!
Here’s a few of them:
The Visualization Toolkit (VTK) is open source software for manipulating and displaying scientific data. It comes with state-of-the-art tools for 3D rendering, a suite of widgets for 3D interaction, and extensive 2D plotting capability.
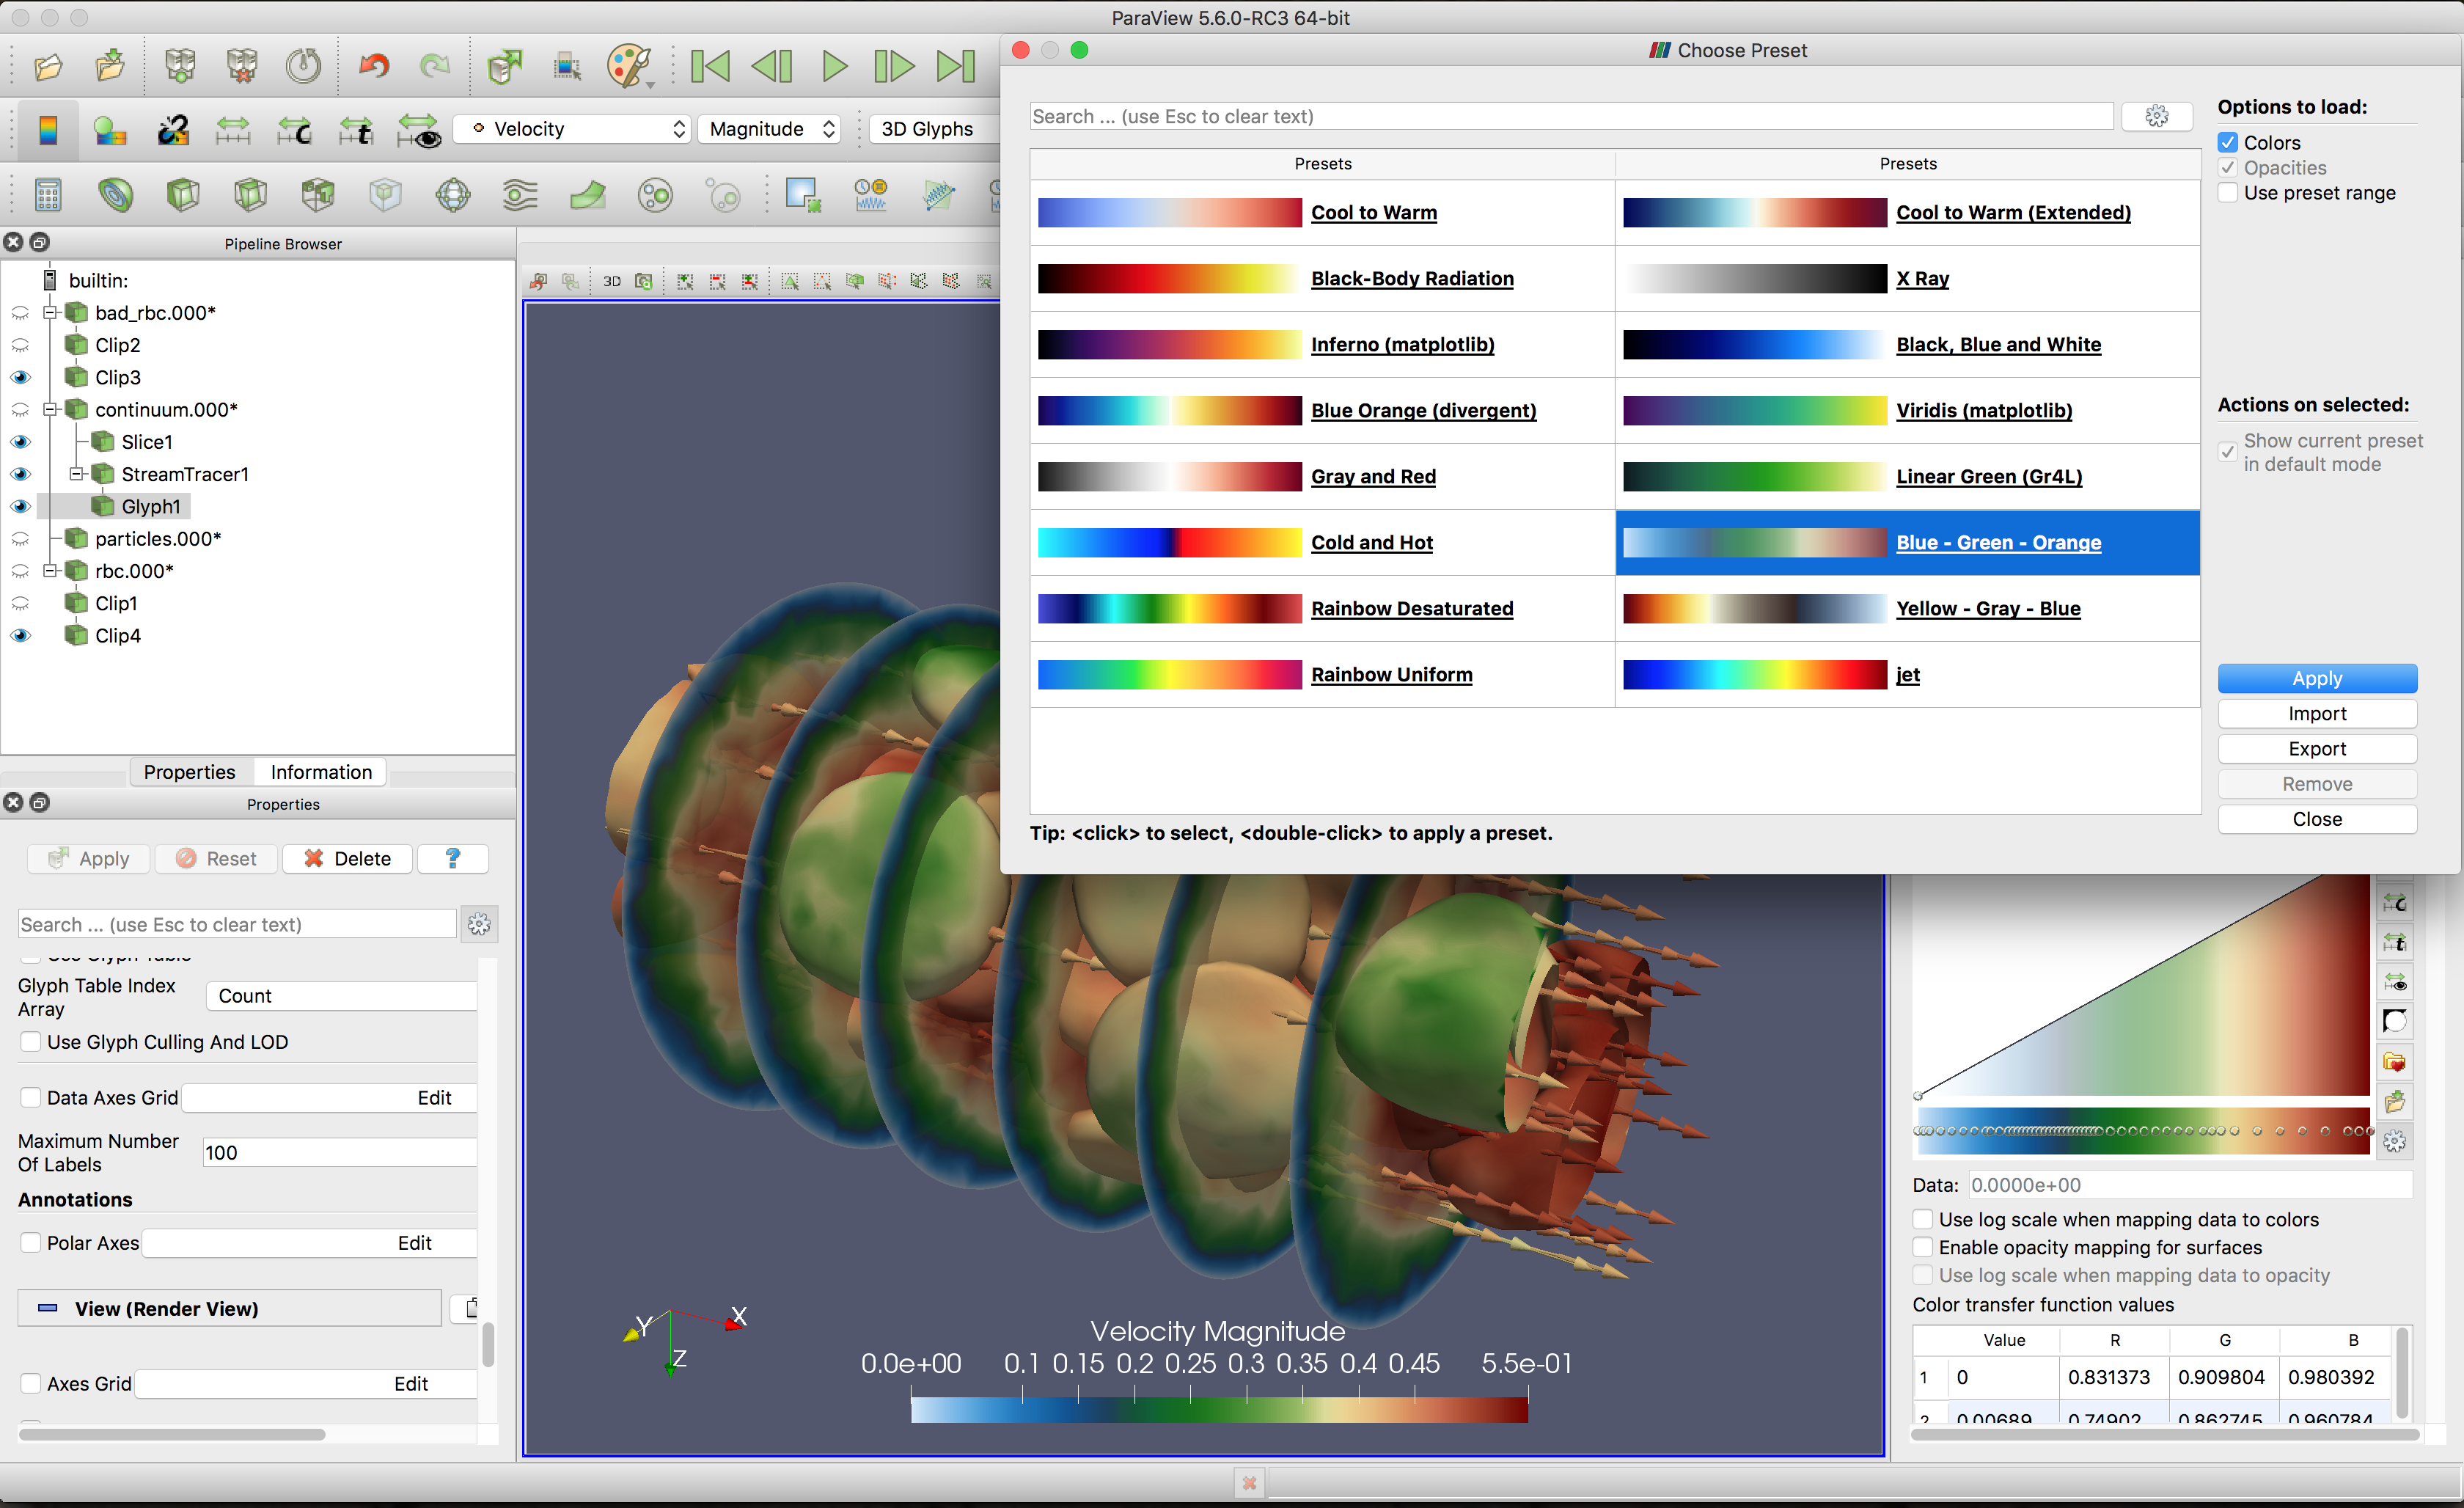
ParaView is an open-source, multi-platform data analysis and visualization application. ParaView users can quickly build visualizations to analyze their data using qualitative and quantitative techniques. The data exploration can be done interactively in 3D or programmatically using ParaView’s batch processing capabilities.
vedo is a Python library for scientific analysis of 3D objects and point clouds based on VTK and numpy.
Mayavi is a general purpose, cross-platform tool for 2-D and 3-D scientific data visualization.
Exercises#
Install PyVista by visiting Getting Started.
Once you’ve installed PyVista, open the example below and see if you can run
the “Hello World” of PyVista. You can download the example by scrolling to the
bottom of the page and clicking on either the *.py (script) or *.ipynb
(notebook) file format.