Note
Go to the end to download the full example code. or to run this example in your browser via Binder
Creating a Uniform Grid#
Create a simple uniform grid from a 3D NumPy array of values.
import numpy as np
import pyvista as pv
Take a 3D NumPy array of data values that holds some spatial data where each
axis corresponds to the XYZ cartesian axes. This example will create a
pyvista.ImageData that will hold the spatial reference for
a 3D grid by which a 3D NumPy array of values can be plotted against.
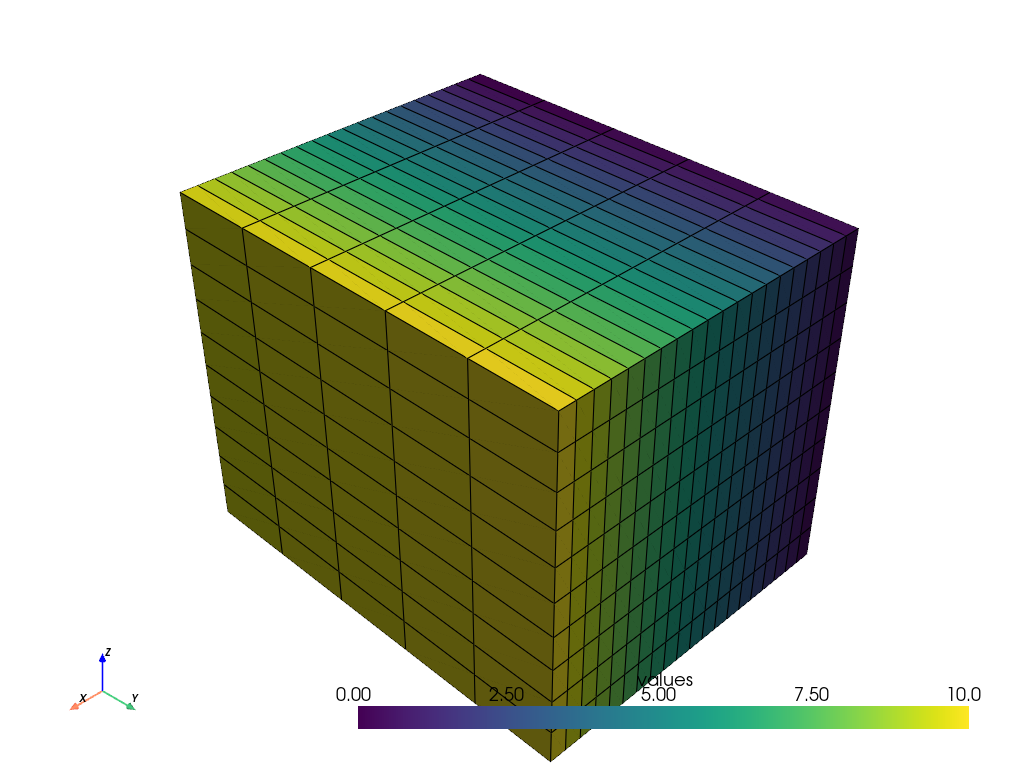
Create the 3D NumPy array of spatially referenced data. This is spatially
referenced such that the grid is (20, 5, 10) (nx, ny, nz).
values = np.linspace(0, 10, 1000).reshape((20, 5, 10))
values.shape
(20, 5, 10)
Create the ImageData
grid = pv.ImageData()
Set the grid dimensions to shape + 1 because we want to inject our values
on the CELL data.
grid.dimensions = np.array(values.shape) + 1
Edit the spatial reference
grid.origin = (100, 33, 55.6)  # The bottom left corner of the data set
grid.spacing = (1, 5, 2)  # These are the cell sizes along each axis
Assign the data to the cell data. Be sure to flatten the data for
ImageData objects using Fortran ordering.
grid.cell_data["values"] = values.flatten(order="F")
grid
Now plot the grid!
grid.plot(show_edges=True)
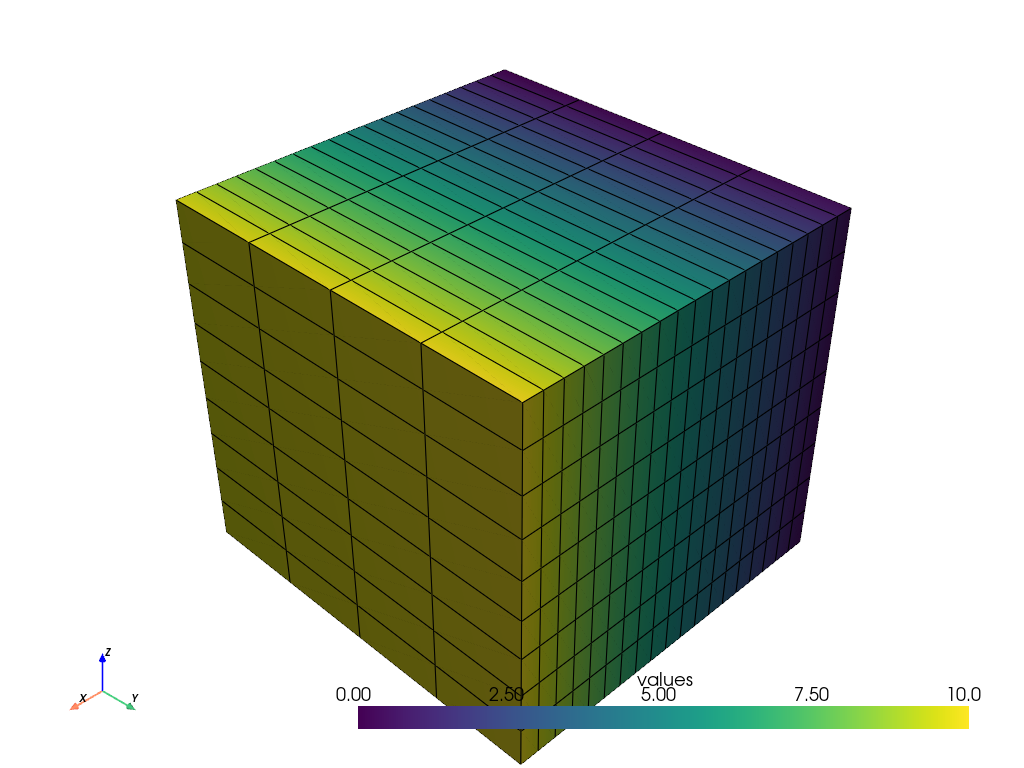
Don’t like cell data? You could also add the NumPy array to the point data of
a pyvista.ImageData. Take note of the subtle difference when
setting the grid dimensions upon initialization.
# Create the 3D NumPy array of spatially referenced data again.
values = np.linspace(0, 10, 1000).reshape((20, 5, 10))
values.shape
(20, 5, 10)
Create the PyVista object and set the same attributes as earlier.
grid = pv.ImageData()

# Set the grid dimensions to ``shape`` because we want to inject our values on
# the POINT data
grid.dimensions = values.shape

# Edit the spatial reference
grid.origin = (100, 33, 55.6)  # The bottom left corner of the data set
grid.spacing = (1, 5, 2)  # These are the cell sizes along each axis
Add the data values to the cell data
grid.point_data["values"] = values.flatten(order="F")  # Flatten the array!
grid
Now plot the grid!
grid.plot(show_edges=True)
Exercise#
Now create your own pyvista.ImageData from a 3D NumPy array!
help(pv.ImageData)
Help on class ImageData in module pyvista.core.grid:
class ImageData(Grid, pyvista.core.filters.image_data.ImageDataFilters, vtkmodules.vtkCommonDataModel.vtkImageData)
| ImageData(*args, **kwargs) -> '_T'
|
| Models datasets with uniform spacing in the three coordinate directions.
|
| Can be initialized in one of several ways:
|
| - Create empty grid
| - Initialize from a :vtk:`vtkImageData` object
| - Initialize based on dimensions, cell spacing, and origin.
|
| .. versionchanged:: 0.33.0
| First argument must now be either a path or
| :vtk:`vtkImageData`. Use keyword arguments to specify the
| dimensions, spacing, and origin of the uniform grid.
|
| .. versionchanged:: 0.37.0
| The ``dims`` parameter has been renamed to ``dimensions``.
|
| Parameters
| ----------
| uinput : str | :vtk:`vtkImageData` | ImageData, optional
| Filename or dataset to initialize the uniform grid from. If
| set, remainder of arguments are ignored.
|
| dimensions : sequence[int], optional
| :attr:`dimensions` of the uniform grid.
|
| spacing : sequence[float], default: (1.0, 1.0, 1.0)
| :attr:`spacing` of the uniform grid in each dimension. Must be positive.
|
| origin : sequence[float], default: (0.0, 0.0, 0.0)
| :attr:`origin` of the uniform grid.
|
| deep : bool, default: False
| Whether to deep copy a :vtk:`vtkImageData` object. Keyword only.
|
| direction_matrix : RotationLike, optional
| The :attr:`direction_matrix` is a 3x3 matrix which controls the orientation of
| the image data.
|
| .. versionadded:: 0.45
|
| offset : int | VectorLike[int], default: (0, 0, 0)
| The offset defines the minimum :attr:`extent` of the image. Offset values
| can be positive or negative. In physical space, the offset is relative
| to the image's :attr:`origin`.
|
| .. versionadded:: 0.45
|
| validate : bool | MeshValidationFields | sequence[MeshValidationFields], default: False
| Validate the mesh using :meth:`~pyvista.DataObjectFilters.validate_mesh` after
| initialization. Set this to ``True`` to validate all fields, or specify any
| combination of fields allowed by ``validate_mesh``.
|
| .. versionadded:: 0.47
|
| See Also
| --------
| :ref:`create_uniform_grid_example`
|
| Examples
| --------
| Create an empty ImageData.
|
| >>> import pyvista as pv
| >>> grid = pv.ImageData()
|
| Initialize from a :vtk:`vtkImageData` object.
|
| >>> import vtk
| >>> vtkgrid = vtk.vtkImageData()
| >>> grid = pv.ImageData(vtkgrid)
|
| Initialize using just the grid dimensions and default
| spacing and origin. These must be keyword arguments.
|
| >>> grid = pv.ImageData(dimensions=(10, 10, 10))
|
| Initialize using dimensions and spacing.
|
| >>> grid = pv.ImageData(
| ... dimensions=(10, 10, 10),
| ... spacing=(2, 1, 5),
| ... )
|
| Initialize using dimensions, spacing, and an origin.
|
| >>> grid = pv.ImageData(
| ... dimensions=(10, 10, 10),
| ... spacing=(2, 1, 5),
| ... origin=(10, 35, 50),
| ... )
|
| Initialize from another ImageData.
|
| >>> grid = pv.ImageData(
| ... dimensions=(10, 10, 10),
| ... spacing=(2, 1, 5),
| ... origin=(10, 35, 50),
| ... )
| >>> grid_from_grid = pv.ImageData(grid)
| >>> grid_from_grid == grid
| True
|
| Method resolution order:
| ImageData
| Grid
| pyvista.core.dataset.DataSet
| pyvista.core.filters.image_data.ImageDataFilters
| pyvista.core.filters.data_set.DataSetFilters
| pyvista.core.utilities.misc._BoundsSizeMixin
| pyvista.core.filters.data_object.DataObjectFilters
| pyvista.core.dataobject.DataObject
| pyvista.core.utilities.misc._NoNewAttrMixin
| pyvista.core._vtk_utilities.DisableVtkSnakeCase
| pyvista.core._vtk_utilities.vtkPyVistaOverride
| vtkmodules.vtkCommonDataModel.vtkImageData
| vtkmodules.vtkCommonDataModel.vtkCartesianGrid
| vtkmodules.vtkCommonDataModel.vtkDataSet
| vtkmodules.vtkCommonDataModel.vtkDataObject
| vtkmodules.vtkCommonCore.vtkObject
| vtkmodules.vtkCommonCore.vtkObjectBase
| builtins.object
|
| Methods defined here:
|
| __getitem__(self, key: "tuple[str, Literal['cell', 'point', 'field']] | str | tuple[int, int, int]") -> 'ImageData | pyvista_ndarray'
| Search for a data array or slice with IJK indexing.
|
| __init__(self: 'Self', uinput: 'ImageData | str | Path | None' = None, dimensions: 'VectorLike[int] | None' = None, spacing: 'VectorLike[float]' = (1.0, 1.0, 1.0), origin: 'VectorLike[float]' = (0.0, 0.0, 0.0), deep: 'bool' = False, direction_matrix: 'RotationLike | None' = None, offset: 'int | VectorLike[int] | None' = None, *, validate: 'bool | _NestedMeshValidationFields' = False) -> 'None'
| Initialize the uniform grid.
|
| __repr__(self: 'Self') -> 'str'
| Return the default representation.
|
| __str__(self: 'Self') -> 'str'
| Return the default str representation.
|
| cast_to_rectilinear_grid(self: 'Self') -> 'RectilinearGrid'
| Cast this uniform grid to a rectilinear grid.
|
| Returns
| -------
| pyvista.RectilinearGrid
| This uniform grid as a rectilinear grid.
|
| cast_to_structured_grid(self: 'Self') -> 'StructuredGrid'
| Cast this image data to a :class:`~pyvista.StructuredGrid`.
|
| .. note::
|
| Casting converts :class:`~pyvista.CellType.PIXEL` cells to
| :class:`~pyvista.CellType.QUAD` cells for 2D inputs, and
| :class:`~pyvista.CellType.VOXEL` cells to :class:`~pyvista.CellType.HEXAHEDRON` cells
| for 3D inputs. To preserve cell type, use
| :meth:`~pyvista.DataSet.cast_to_unstructured_grid` instead.
|
| Returns
| -------
| pyvista.StructuredGrid
| This grid as a structured grid.
|
| to_tetrahedra(self, tetra_per_cell: 'int' = 5, mixed: 'str | Sequence[int] | bool' = False, pass_cell_ids: 'bool' = True, pass_data: 'bool' = True, progress_bar: 'bool' = False) from pyvista.core.filters.rectilinear_grid.RectilinearGridFilters
| Create a tetrahedral mesh structured grid.
|
| Parameters
| ----------
| tetra_per_cell : int, default: 5
| The number of tetrahedrons to divide each cell into. Can be
| either ``5``, ``6``, or ``12``. If ``mixed=True``, this value is
| overridden.
|
| mixed : str, bool, sequence, default: False
| When set, subdivides some cells into 5 and some cells into 12. Set
| to ``True`` to use the active cell scalars of the
| :class:`pyvista.RectilinearGrid` to be either 5 or 12 to
| determining the number of tetrahedra to generate per cell.
|
| When a sequence, uses these values to subdivide the cells. When a
| string uses a cell array rather than the active array to determine
| the number of tetrahedra to generate per cell.
|
| pass_cell_ids : bool, default: True
| Set to ``True`` to make the tetrahedra have scalar data indicating
| which cell they came from in the original
| :class:`pyvista.RectilinearGrid`. The name of this array is
| ``'vtkOriginalCellIds'`` within the ``cell_data``.
|
| pass_data : bool, default: True
| Set to ``True`` to make the tetrahedra mesh have the cell data from
| the original :class:`pyvista.RectilinearGrid`. This uses
| ``pass_cell_ids=True`` internally. If ``True``, ``pass_cell_ids``
| will also be set to ``True``.
|
| progress_bar : bool, default: False
| Display a progress bar to indicate progress.
|
| Returns
| -------
| pyvista.UnstructuredGrid
| UnstructuredGrid containing the tetrahedral cells.
|
| Examples
| --------
| Divide a rectangular grid into tetrahedrons. Each cell contains by
| default 5 tetrahedrons.
|
| First, create and plot the grid.
|
| >>> import numpy as np
| >>> import pyvista as pv
| >>> xrng = np.linspace(0, 1, 2)
| >>> yrng = np.linspace(0, 1, 2)
| >>> zrng = np.linspace(0, 2, 3)
| >>> grid = pv.RectilinearGrid(xrng, yrng, zrng)
| >>> grid.plot()
|
| Now, generate the tetrahedra plot in the exploded view of the cell.
|
| >>> tet_grid = grid.to_tetrahedra()
| >>> tet_grid.explode(factor=0.5).plot(show_edges=True)
|
| Take the same grid but divide the first cell into 5 cells and the other
| cell into 12 tetrahedrons per cell.
|
| >>> tet_grid = grid.to_tetrahedra(mixed=[5, 12])
| >>> tet_grid.explode(factor=0.5).plot(show_edges=True)
|
| ----------------------------------------------------------------------
| Readonly properties defined here:
|
| x
| Return all the X points.
|
| Examples
| --------
| >>> import pyvista as pv
| >>> grid = pv.ImageData(dimensions=(2, 2, 2))
| >>> grid.x
| array([0., 1., 0., 1., 0., 1., 0., 1.])
|
| y
| Return all the Y points.
|
| Examples
| --------
| >>> import pyvista as pv
| >>> grid = pv.ImageData(dimensions=(2, 2, 2))
| >>> grid.y
| array([0., 0., 1., 1., 0., 0., 1., 1.])
|
| z
| Return all the Z points.
|
| Examples
| --------
| >>> import pyvista as pv
| >>> grid = pv.ImageData(dimensions=(2, 2, 2))
| >>> grid.z
| array([0., 0., 0., 0., 1., 1., 1., 1.])
|
| ----------------------------------------------------------------------
| Data descriptors defined here:
|
| direction_matrix
| Set or get the direction matrix.
|
| The direction matrix is a 3x3 matrix which controls the orientation of the
| image data.
|
| .. versionadded:: 0.45
|
| Returns
| -------
| np.ndarray
| Direction matrix as a 3x3 NumPy array.
|
| extent
| Return or set the extent of the ImageData.
|
| The extent is simply the first and last indices for each of the three axes.
| It encodes information about the image's :attr:`offset` and :attr:`dimensions`.
|
| Examples
| --------
| Create a ``ImageData`` and show its extent.
|
| >>> import pyvista as pv
| >>> grid = pv.ImageData(dimensions=(10, 10, 10))
| >>> grid.extent
| (0, 9, 0, 9, 0, 9)
|
| >>> grid.extent = (2, 5, 2, 5, 2, 5)
| >>> grid.extent
| (2, 5, 2, 5, 2, 5)
|
| Note how this also modifies the grid's :attr:`offset`, :attr:`dimensions`,
| and :attr:`bounds`. Since we use default spacing of 1 here, the bounds
| match the extent exactly.
|
| >>> grid.offset
| (2, 2, 2)
|
| >>> grid.dimensions
| (4, 4, 4)
|
| >>> grid.bounds
| BoundsTuple(x_min = 2.0,
| x_max = 5.0,
| y_min = 2.0,
| y_max = 5.0,
| z_min = 2.0,
| z_max = 5.0)
|
| index_to_physical_matrix
| Return or set 4x4 matrix to transform index space (ijk) to physical space (xyz).
|
| .. note::
| Setting this property modifies the object's :class:`~pyvista.ImageData.origin`,
| :class:`~pyvista.ImageData.spacing`, and :class:`~pyvista.ImageData.direction_matrix`
| properties.
|
| .. versionadded:: 0.45
|
| Returns
| -------
| np.ndarray
| 4x4 transformation matrix.
|
| offset
| Return or set the index offset of the ImageData.
|
| The offset is simply the first indices for each of the three axes
| and defines the minimum :attr:`extent` of the image. Offset values
| can be positive or negative. In physical space, the offset is relative
| to the image's :attr:`origin`.
|
| .. versionadded:: 0.45
|
| Examples
| --------
| Create a ``ImageData`` and show that the offset is zeros by default.
|
| >>> import pyvista as pv
| >>> grid = pv.ImageData(dimensions=(10, 10, 10))
| >>> grid.offset
| (0, 0, 0)
|
| The offset defines the minimum extent.
|
| >>> grid.extent
| (0, 9, 0, 9, 0, 9)
|
| Set the offset to a new value for all axes.
|
| >>> grid.offset = 2
| >>> grid.offset
| (2, 2, 2)
|
| Show the extent again. Note how all values have increased by the offset value.
|
| >>> grid.extent
| (2, 11, 2, 11, 2, 11)
|
| Set the offset for each axis separately and show the extent again.
|
| >>> grid.offset = (-1, -2, -3)
| >>> grid.extent
| (-1, 8, -2, 7, -3, 6)
|
| origin
| Return the origin of the grid (bottom southwest corner).
|
| Examples
| --------
| >>> import pyvista as pv
| >>> grid = pv.ImageData(dimensions=(5, 5, 5))
| >>> grid.origin
| (0.0, 0.0, 0.0)
|
| Show how the origin is in the bottom "southwest" corner of the
| ImageData.
|
| >>> pl = pv.Plotter()
| >>> _ = pl.add_mesh(grid, show_edges=True)
| >>> _ = pl.add_axes_at_origin(ylabel=None)
| >>> pl.camera_position = 'xz'
| >>> pl.show()
|
| Set the origin to ``(1, 1, 1)`` and show how this shifts the
| ImageData.
|
| >>> grid.origin = (1, 1, 1)
| >>> pl = pv.Plotter()
| >>> _ = pl.add_mesh(grid, show_edges=True)
| >>> _ = pl.add_axes_at_origin(ylabel=None)
| >>> pl.camera_position = 'xz'
| >>> pl.show()
|
| physical_to_index_matrix
| Return or set 4x4 matrix to transform from physical space (xyz) to index space (ijk).
|
| .. note::
| Setting this property modifies the object's :class:`~pyvista.ImageData.origin`,
| :class:`~pyvista.ImageData.spacing`, and :class:`~pyvista.ImageData.direction_matrix`
| properties.
|
| .. versionadded:: 0.45
|
| Returns
| -------
| np.ndarray
| 4x4 transformation matrix.
|
| points
| Build a copy of the implicitly defined points as a numpy array.
|
| Returns
| -------
| numpy.ndarray
| Array of points representing the image data.
|
| Notes
| -----
| The ``points`` for a :class:`pyvista.ImageData` cannot be set.
|
| Examples
| --------
| >>> import pyvista as pv
| >>> grid = pv.ImageData(dimensions=(2, 2, 2))
| >>> grid.points
| array([[0., 0., 0.],
| [1., 0., 0.],
| [0., 1., 0.],
| [1., 1., 0.],
| [0., 0., 1.],
| [1., 0., 1.],
| [0., 1., 1.],
| [1., 1., 1.]])
|
| spacing
| Return or set the spacing for each axial direction.
|
| Notes
| -----
| Spacing must be non-negative. While VTK accepts negative
| spacing, this results in unexpected behavior. See:
| https://github.com/pyvista/pyvista/issues/1967
|
| Examples
| --------
| Create a 5 x 5 x 5 uniform grid.
|
| >>> import pyvista as pv
| >>> grid = pv.ImageData(dimensions=(5, 5, 5))
| >>> grid.spacing
| (1.0, 1.0, 1.0)
| >>> grid.plot(show_edges=True)
|
| Modify the spacing to ``(1, 2, 3)``
|
| >>> grid.spacing = (1, 2, 3)
| >>> grid.plot(show_edges=True)
|
| ----------------------------------------------------------------------
| Data and other attributes defined here:
|
| __abstractmethods__ = frozenset()
|
| __annotations__ = {'_WRITERS': 'ClassVar[dict[str, type[BaseWriter]]]'...
|
| ----------------------------------------------------------------------
| Methods inherited from Grid:
|
| __new__(cls, *args, **kwargs) from pyvista.core.utilities.misc.abstract_class.<locals>
|
| to_hexahedra(self: 'Self') -> 'UnstructuredGrid'
| Convert voxels to hexahedra.
|
| Convert this mesh to :class:`~pyvista.UnstructuredGrid` with
| :attr:`~pyvista.CellType.HEXAHEDRON` cells. Equivalent to
| :meth:`~pyvista.DataSet.cast_to_unstructured_grid` except the output has
| hexahedra instead of :attr:`~pyvista.CellType.VOXEL` cells.
|
| .. versionadded:: 0.48
|
| Returns
| -------
| pyvista.UnstructuredGrid
| Mesh with :attr:`~pyvista.CellType.HEXAHEDRON` cells.
|
| Raises
| ------
| ValueError
| If the input is not 3-dimensional.
|
| See Also
| --------
| to_quads, to_tetrahedra
| pyvista.DataSet.cast_to_unstructured_grid
|
| Examples
| --------
| Convert a 3D :class:`~pyvista.ImageData` to hexahedra.
|
| >>> import pyvista as pv
| >>> image = pv.ImageData(dimensions=(2, 2, 2))
| >>> hexes = image.to_hexahedra()
| >>> hexes.distinct_cell_types == {pv.CellType.HEXAHEDRON}
| True
|
| to_quads(self: 'Self') -> 'UnstructuredGrid'
| Convert pixels to quads.
|
| Convert this mesh to :class:`~pyvista.UnstructuredGrid` with
| :attr:`~pyvista.CellType.QUAD` cells. Equivalent to
| :meth:`~pyvista.DataSet.cast_to_unstructured_grid` except the output has
| quads instead of :attr:`~pyvista.CellType.PIXEL` cells.
|
| .. versionadded:: 0.48
|
| Returns
| -------
| pyvista.UnstructuredGrid
| Mesh with :attr:`~pyvista.CellType.QUAD` cells.
|
| Raises
| ------
| ValueError
| If the input is not 2-dimensional.
|
| See Also
| --------
| to_hexahedra, to_tetrahedra
| pyvista.DataSet.cast_to_unstructured_grid
|
| Examples
| --------
| Convert a 2D :class:`~pyvista.ImageData` to quads.
|
| >>> import pyvista as pv
| >>> image = pv.ImageData(dimensions=(3, 2, 1))
| >>> quads = image.to_quads()
| >>> quads.distinct_cell_types == {pv.CellType.QUAD}
| True
|
| ----------------------------------------------------------------------
| Data descriptors inherited from Grid:
|
| dimensions
| Return the grid's dimensions.
|
| These are effectively the number of points along each of the
| three dataset axes.
|
| Returns
| -------
| tuple[int]
| Dimensions of the grid.
|
| Examples
| --------
| Create a uniform grid with dimensions ``(1, 2, 3)``.
|
| >>> import pyvista as pv
| >>> grid = pv.ImageData(dimensions=(2, 3, 4))
| >>> grid.dimensions
| (2, 3, 4)
| >>> grid.plot(show_edges=True)
|
| Set the dimensions to ``(3, 4, 5)``
|
| >>> grid.dimensions = (3, 4, 5)
| >>> grid.plot(show_edges=True)
|
| ----------------------------------------------------------------------
| Methods inherited from pyvista.core.dataset.DataSet:
|
| __arrow_c_stream__(self: 'Self', requested_schema: 'object | None' = None) -> 'object'
| Export :attr:`point_data` via the Arrow PyCapsule interface.
|
| Delegates to :meth:`DataSetAttributes.__arrow_c_stream__` on
| :attr:`point_data`. Callers wanting :attr:`cell_data` should use
| ``mesh.cell_data`` directly or ``mesh.to_arrow('cell')``.
|
| Requires :mod:`pyarrow`.
|
| __getattr__(self: 'Self', item: 'str') -> 'Any'
| Get attribute from base class if not found.
|
| Before falling through to the VTK base class, check whether
| ``item`` matches a pending ``pyvista.accessors`` entry point.
| A match triggers a one-shot plugin import, after which normal
| attribute resolution finds the newly-attached accessor
| descriptor.
|
| __setitem__(self: 'Self', name: 'str', scalars: '_ArrayLikeOrScalar[NumberType]') -> 'None'
| Add/set an array in the point_data, or cell_data accordingly.
|
| It depends on the array's length, or specified mode.
|
| cast_to_pointset(self: 'Self', pass_cell_data: 'bool' = False) -> 'PointSet'
| Extract the points of this dataset and return a :class:`pyvista.PointSet`.
|
| Parameters
| ----------
| pass_cell_data : bool, default: False
| Run the :func:`cell_data_to_point_data()
| <pyvista.DataObjectFilters.cell_data_to_point_data>` filter and pass
| cell data fields to the new pointset.
|
| Returns
| -------
| pyvista.PointSet
| Dataset cast into a :class:`pyvista.PointSet`.
|
| Notes
| -----
| This will produce a deep copy of the points and point/cell data of
| the original mesh.
|
| See Also
| --------
| :ref:`create_pointset_example`
|
| Examples
| --------
| >>> import pyvista as pv
| >>> mesh = pv.Wavelet()
| >>> pointset = mesh.cast_to_pointset()
| >>> type(pointset)
| <class 'pyvista.core.pointset.PointSet'>
|
| cast_to_poly_points(self: 'Self', pass_cell_data: 'bool' = False) -> 'pv.PolyData'
| Extract the points of this dataset and return a :class:`pyvista.PolyData`.
|
| Parameters
| ----------
| pass_cell_data : bool, default: False
| Run the :func:`cell_data_to_point_data()
| <pyvista.DataObjectFilters.cell_data_to_point_data>` filter and pass
| cell data fields to the new pointset.
|
| Returns
| -------
| pyvista.PolyData
| Dataset cast into a :class:`pyvista.PolyData`.
|
| Notes
| -----
| This will produce a deep copy of the points and point/cell data of
| the original mesh.
|
| Examples
| --------
| >>> from pyvista import examples
| >>> mesh = examples.load_uniform()
| >>> points = mesh.cast_to_poly_points(pass_cell_data=True)
| >>> type(points)
| <class 'pyvista.core.pointset.PolyData'>
| >>> points.n_arrays
| 2
| >>> points.point_data
| pyvista DataSetAttributes
| Association : POINT
| Active Scalars : Spatial Point Data
| Active Vectors : None
| Active Texture : None
| Active Normals : None
| Contains arrays :
| Spatial Point Data float64 (1000,) SCALARS
| >>> points.cell_data
| pyvista DataSetAttributes
| Association : CELL
| Active Scalars : None
| Active Vectors : None
| Active Texture : None
| Active Normals : None
| Contains arrays :
| Spatial Cell Data float64 (1000,)
|
| cast_to_unstructured_grid(self: 'Self') -> 'pv.UnstructuredGrid'
| Get a new representation of this object as a :class:`~pyvista.UnstructuredGrid`.
|
| .. note::
|
| Casting preserves the cell type(s) of the input. This means that any
| :class:`~pyvista.CellType.PIXEL` and :class:`~pyvista.CellType.VOXEL` cells from
| :class:`~pyvista.ImageData` or :class:`~pyvista.RectilinearGrid` are preserved.
| Use ``to_quads`` or ``to_hexahedra`` instead to convert the cell
| type for these cases.
|
| Returns
| -------
| pyvista.UnstructuredGrid
| Dataset cast into a :class:`pyvista.UnstructuredGrid`.
|
| Examples
| --------
| Cast a :class:`pyvista.PolyData` to a
| :class:`pyvista.UnstructuredGrid`.
|
| >>> import pyvista as pv
| >>> mesh = pv.Sphere()
| >>> type(mesh)
| <class 'pyvista.core.pointset.PolyData'>
| >>> grid = mesh.cast_to_unstructured_grid()
| >>> type(grid)
| <class 'pyvista.core.pointset.UnstructuredGrid'>
|
| cell_neighbors(self: 'Self', ind: 'int', connections: 'str' = 'points') -> 'list[int]'
| Get the cell neighbors of the ind-th cell.
|
| Concrete implementation of :vtk:`vtkDataSet.GetCellNeighbors`.
|
| Parameters
| ----------
| ind : int
| Cell ID.
|
| connections : str, default: "points"
| Describe how the neighbor cell(s) must be connected to the current
| cell to be considered as a neighbor.
| Can be either ``'points'``, ``'edges'`` or ``'faces'``.
|
| Returns
| -------
| list[int]
| List of neighbor cells IDs for the ind-th cell.
|
| Warnings
| --------
| For a :class:`pyvista.ExplicitStructuredGrid`, use
| :func:`pyvista.ExplicitStructuredGrid.neighbors`.
|
| See Also
| --------
| pyvista.DataSet.cell_neighbors_levels
|
| Examples
| --------
| >>> from pyvista import examples
| >>> mesh = examples.load_airplane()
|
| Get the neighbor cell ids that have at least one point in common with
| the 0-th cell.
|
| >>> mesh.cell_neighbors(0, 'points')
| [1, 2, 3, 388, 389, 11, 12, 395, 14, 209, 211, 212]
|
| Get the neighbor cell ids that have at least one edge in common with
| the 0-th cell.
|
| >>> mesh.cell_neighbors(0, 'edges')
| [1, 3, 12]
|
| For unstructured grids with cells of dimension 3 (Tetrahedron for example),
| cell neighbors can be defined using faces.
|
| >>> mesh = examples.download_tetrahedron()
| >>> mesh.cell_neighbors(0, 'faces')
| [1, 5, 7]
|
| Show a visual example.
|
| >>> from functools import partial
| >>> import pyvista as pv
| >>> mesh = pv.Sphere(theta_resolution=10)
| >>>
| >>> pl = pv.Plotter(shape=(1, 2))
| >>> pl.link_views()
| >>> add_point_labels = partial(
| ... pl.add_point_labels,
| ... text_color='white',
| ... font_size=20,
| ... shape=None,
| ... show_points=False,
| ... )
| >>>
| >>> for i, connection in enumerate(['points', 'edges']):
| ... pl.subplot(0, i)
| ... pl.view_xy()
| ... _ = pl.add_title(
| ... f'{connection.capitalize()} neighbors',
| ... color='red',
| ... shadow=True,
| ... font_size=8,
| ... )
| ...
| ... # Add current cell
| ... i_cell = 0
| ... current_cell = mesh.extract_cells(i_cell)
| ... _ = pl.add_mesh(current_cell, show_edges=True, color='blue')
| ... _ = add_point_labels(
| ... current_cell.cell_centers().points,
| ... labels=[f'{i_cell}'],
| ... )
| ...
| ... # Add neighbors
| ... ids = mesh.cell_neighbors(i_cell, connection)
| ... cells = mesh.extract_cells(ids)
| ... _ = pl.add_mesh(cells, color='red', show_edges=True)
| ... _ = add_point_labels(
| ... cells.cell_centers().points,
| ... labels=[f'{i}' for i in ids],
| ... )
| ...
| ... # Add other cells
| ... ids.append(i_cell)
| ... others = mesh.extract_cells(ids, invert=True)
| ... _ = pl.add_mesh(others, show_edges=True)
| >>> pl.show()
|
| cell_neighbors_levels(self: 'Self', ind: 'int', connections: 'str' = 'points', n_levels: 'int' = 1) -> 'Generator[list[int], None, None]'
| Get consecutive levels of cell neighbors.
|
| Parameters
| ----------
| ind : int
| Cell ID.
|
| connections : str, default: "points"
| Describe how the neighbor cell(s) must be connected to the current
| cell to be considered as a neighbor.
| Can be either ``'points'``, ``'edges'`` or ``'faces'``.
|
| n_levels : int, default: 1
| Number of levels to search for cell neighbors.
| When equal to 1, it is equivalent to :func:`pyvista.DataSet.cell_neighbors`.
|
| Returns
| -------
| generator[list[int]]
| A generator of list of cell IDs for each level.
|
| Warnings
| --------
| For a :class:`pyvista.ExplicitStructuredGrid`, use
| :func:`pyvista.ExplicitStructuredGrid.neighbors`.
|
| See Also
| --------
| pyvista.DataSet.cell_neighbors
|
| Examples
| --------
| Get the cell neighbors IDs starting from the 0-th cell
| up until the third level.
|
| >>> import pyvista as pv
| >>> mesh = pv.Sphere(theta_resolution=10)
| >>> nbr_levels = mesh.cell_neighbors_levels(0, connections='edges', n_levels=3)
| >>> nbr_levels = list(nbr_levels)
| >>> nbr_levels[0]
| [1, 21, 9]
| >>> nbr_levels[1]
| [2, 8, 74, 75, 20, 507]
| >>> nbr_levels[2]
| [128, 129, 3, 453, 7, 77, 23, 506]
|
| Visualize these cells IDs.
|
| >>> from functools import partial
| >>> pv.global_theme.color_cycler = [
| ... 'red',
| ... 'green',
| ... 'blue',
| ... 'purple',
| ... ]
| >>> pl = pv.Plotter()
| >>>
| >>> # Define partial function to add point labels
| >>> add_point_labels = partial(
| ... pl.add_point_labels,
| ... text_color='white',
| ... font_size=40,
| ... shape=None,
| ... show_points=False,
| ... )
| >>>
| >>> # Add the 0-th cell to the plotter
| >>> cell = mesh.extract_cells(0)
| >>> _ = pl.add_mesh(cell, show_edges=True)
| >>> _ = add_point_labels(cell.cell_centers().points, labels=['0'])
| >>> other_ids = [0]
| >>>
| >>> # Add the neighbors to the plot
| >>> neighbors = mesh.cell_neighbors_levels(0, connections='edges', n_levels=3)
| >>> for i, ids in enumerate(neighbors, start=1):
| ... cells = mesh.extract_cells(ids)
| ... _ = pl.add_mesh(cells, show_edges=True)
| ... _ = add_point_labels(
| ... cells.cell_centers().points, labels=[f'{i}'] * len(ids)
| ... )
| ... other_ids.extend(ids)
| >>>
| >>> # Add the cell IDs that are not neighbors (ie. the rest of the sphere)
| >>> cells = mesh.extract_cells(other_ids, invert=True)
| >>> _ = pl.add_mesh(cells, color='white', show_edges=True)
| >>>
| >>> pl.view_xy()
| >>> pl.camera.zoom(6.0)
| >>> pl.show()
|
| clear_cell_data(self: 'Self') -> 'None'
| Remove all cell arrays.
|
| clear_data(self: 'Self') -> 'None'
| Remove all arrays from point/cell/field data.
|
| Examples
| --------
| Clear all arrays from a mesh.
|
| >>> import pyvista as pv
| >>> import numpy as np
| >>> mesh = pv.Sphere()
| >>> mesh.point_data.keys()
| ['Normals']
| >>> mesh.clear_data()
| >>> mesh.point_data.keys()
| []
|
| clear_point_data(self: 'Self') -> 'None'
| Remove all point arrays.
|
| Examples
| --------
| Clear all point arrays from a mesh.
|
| >>> import pyvista as pv
| >>> import numpy as np
| >>> mesh = pv.Sphere()
| >>> mesh.point_data.keys()
| ['Normals']
| >>> mesh.clear_point_data()
| >>> mesh.point_data.keys()
| []
|
| copy_from(self: 'Self', mesh: '_vtk.vtkDataSet', deep: 'bool' = True) -> 'None'
| Overwrite this dataset inplace with the new dataset's geometries and data.
|
| Parameters
| ----------
| mesh : :vtk:`vtkDataSet`
| The overwriting mesh.
|
| deep : bool, default: True
| Whether to perform a deep or shallow copy.
|
| Examples
| --------
| Create two meshes and overwrite ``mesh_a`` with ``mesh_b``.
| Show that ``mesh_a`` is equal to ``mesh_b``.
|
| >>> import pyvista as pv
| >>> mesh_a = pv.Sphere()
| >>> mesh_b = pv.Cube()
| >>> mesh_a.copy_from(mesh_b)
| >>> mesh_a == mesh_b
| True
|
| copy_meta_from(self: 'Self', ido: 'DataSet', deep: 'bool' = True) -> 'None'
| Copy pyvista meta data onto this object from another object.
|
| Parameters
| ----------
| ido : pyvista.DataSet
| Dataset to copy the metadata from.
|
| deep : bool, default: True
| Deep or shallow copy.
|
| find_cells_along_line(self: 'Self', pointa: 'VectorLike[float]', pointb: 'VectorLike[float]', tolerance: 'float' = 0.0) -> 'NumpyArray[int]'
| Find the index of cells whose bounds intersect a line.
|
| Line is defined from ``pointa`` to ``pointb``.
|
| Parameters
| ----------
| pointa : VectorLike
| Length 3 coordinate of the start of the line.
|
| pointb : VectorLike
| Length 3 coordinate of the end of the line.
|
| tolerance : float, default: 0.0
| The absolute tolerance to use to find cells along line.
|
| Returns
| -------
| numpy.ndarray
| Index or indices of the cell(s) whose bounds intersect
| the line.
|
| Warnings
| --------
| This method returns cells whose bounds intersect the line.
| This means that the line may not intersect the cell itself.
| To obtain cells that intersect the line, use
| :func:`pyvista.DataSet.find_cells_intersecting_line`.
|
| See Also
| --------
| DataSet.find_closest_point
| DataSet.find_closest_cell
| DataSet.find_containing_cell
| DataSet.find_cells_within_bounds
| DataSet.find_cells_intersecting_line
|
| Examples
| --------
| >>> import pyvista as pv
| >>> mesh = pv.Sphere()
| >>> mesh.find_cells_along_line([0.0, 0, 0], [1.0, 0, 0])
| array([ 86, 87, 1652, 1653])
|
| find_cells_intersecting_line(self: 'Self', pointa: 'VectorLike[float]', pointb: 'VectorLike[float]', tolerance: 'float' = 0.0) -> 'NumpyArray[int]'
| Find the index of cells that intersect a line.
|
| Line is defined from ``pointa`` to ``pointb``. This
| method requires vtk version >=9.2.0.
|
| Parameters
| ----------
| pointa : sequence[float]
| Length 3 coordinate of the start of the line.
|
| pointb : sequence[float]
| Length 3 coordinate of the end of the line.
|
| tolerance : float, default: 0.0
| The absolute tolerance to use to find cells along line.
|
| Returns
| -------
| numpy.ndarray
| Index or indices of the cell(s) that intersect
| the line.
|
| See Also
| --------
| DataSet.find_closest_point
| DataSet.find_closest_cell
| DataSet.find_containing_cell
| DataSet.find_cells_within_bounds
| DataSet.find_cells_along_line
|
| Examples
| --------
| >>> import pyvista as pv
| >>> mesh = pv.Sphere()
| >>> mesh.find_cells_intersecting_line([0.0, 0, 0], [1.0, 0, 0])
| array([ 86, 1653])
|
| find_cells_within_bounds(self: 'Self', bounds: 'BoundsTuple') -> 'NumpyArray[int]'
| Find the index of cells in this mesh within bounds.
|
| Parameters
| ----------
| bounds : sequence[float]
| Bounding box. The form is: ``(x_min, x_max, y_min, y_max, z_min, z_max)``.
|
| Returns
| -------
| numpy.ndarray
| Index or indices of the cell in this mesh that are closest
| to the given point.
|
| See Also
| --------
| DataSet.find_closest_point
| DataSet.find_closest_cell
| DataSet.find_containing_cell
| DataSet.find_cells_along_line
|
| Examples
| --------
| >>> import pyvista as pv
| >>> mesh = pv.Cube()
| >>> index = mesh.find_cells_within_bounds([-2.0, 2.0, -2.0, 2.0, -2.0, 2.0])
|
| find_closest_cell(self: 'Self', point: 'VectorLike[float] | MatrixLike[float]', return_closest_point: 'bool' = False) -> 'int | NumpyArray[int] | tuple[int | NumpyArray[int], NumpyArray[int]]'
| Find index of closest cell in this mesh to the given point.
|
| Parameters
| ----------
| point : VectorLike[float] | MatrixLike[float]
| Coordinates of point to query (length 3) or a
| :class:`numpy.ndarray` of ``n`` points with shape ``(n, 3)``.
|
| return_closest_point : bool, default: False
| If ``True``, the closest point within a mesh cell to that point is
| returned. This is not necessarily the closest nodal point on the
| mesh. Default is ``False``.
|
| Returns
| -------
| int or numpy.ndarray
| Index or indices of the cell in this mesh that is/are closest
| to the given point(s).
|
| .. versionchanged:: 0.35.0
| Inputs of shape ``(1, 3)`` now return a :class:`numpy.ndarray`
| of shape ``(1,)``.
|
| numpy.ndarray
| Point or points inside a cell of the mesh that is/are closest
| to the given point(s). Only returned if
| ``return_closest_point=True``.
|
| .. versionchanged:: 0.35.0
| Inputs of shape ``(1, 3)`` now return a :class:`numpy.ndarray`
| of the same shape.
|
| Warnings
| --------
| This method may still return a valid cell index even if the point
| contains a value like ``numpy.inf`` or ``numpy.nan``.
|
| See Also
| --------
| DataSet.find_closest_point
| DataSet.find_containing_cell
| DataSet.find_cells_along_line
| DataSet.find_cells_within_bounds
| :ref:`distance_between_surfaces_example`
|
| Examples
| --------
| Find nearest cell on a sphere centered on the
| origin to the point ``[0.1, 0.2, 0.3]``.
|
| >>> import pyvista as pv
| >>> mesh = pv.Sphere()
| >>> point = [0.1, 0.2, 0.3]
| >>> index = mesh.find_closest_cell(point)
| >>> index
| 338
|
| Make sure that this cell indeed is the closest to
| ``[0.1, 0.2, 0.3]``.
|
| >>> import numpy as np
| >>> cell_centers = mesh.cell_centers()
| >>> relative_position = cell_centers.points - point
| >>> distance = np.linalg.norm(relative_position, axis=1)
| >>> np.argmin(distance)
| np.int64(338)
|
| Find the nearest cells to several random points that
| are centered on the origin.
|
| >>> points = 2 * np.random.default_rng().random((5000, 3)) - 1
| >>> indices = mesh.find_closest_cell(points)
| >>> indices.shape
| (5000,)
|
| For the closest cell, find the point inside the cell that is
| closest to the supplied point. The rectangle is a unit square
| with 1 cell and 4 nodal points at the corners in the plane with
| ``z`` normal and ``z=0``. The closest point inside the cell is
| not usually at a nodal point.
|
| >>> unit_square = pv.Rectangle()
| >>> index, closest_point = unit_square.find_closest_cell(
| ... [0.25, 0.25, 0.5], return_closest_point=True
| ... )
| >>> closest_point
| array([0.25, 0.25, 0. ])
|
| But, the closest point can be a nodal point, although the index of
| that point is not returned. If the closest nodal point by index is
| desired, see :func:`DataSet.find_closest_point`.
|
| >>> index, closest_point = unit_square.find_closest_cell(
| ... [1.0, 1.0, 0.5], return_closest_point=True
| ... )
| >>> closest_point
| array([1., 1., 0.])
|
| find_closest_point(self: 'Self', point: 'Iterable[float]', n: 'int' = 1) -> 'int | VectorLike[int]'
| Find index of closest point in this mesh to the given point.
|
| If wanting to query many points, use a KDTree with scipy or another
| library as those implementations will be easier to work with.
|
| See: https://github.com/pyvista/pyvista-support/issues/107
|
| Parameters
| ----------
| point : sequence[float]
| Length 3 coordinate of the point to query.
|
| n : int, optional
| If greater than ``1``, returns the indices of the ``n`` closest
| points.
|
| Returns
| -------
| int
| The index of the point in this mesh that is closest to the given point.
|
| See Also
| --------
| DataSet.find_closest_cell
| DataSet.find_containing_cell
| DataSet.find_cells_along_line
| DataSet.find_cells_within_bounds
| :ref:`point_cloud_distance_example`
| :ref:`point_cloud_neighbors_example`
|
| Examples
| --------
| Find the index of the closest point to ``(0, 1, 0)``.
|
| >>> import pyvista as pv
| >>> mesh = pv.Sphere()
| >>> index = mesh.find_closest_point((0, 1, 0))
| >>> index
| 239
|
| Get the coordinate of that point.
|
| >>> mesh.points[index]
| pyvista_ndarray([-0.05218758, 0.49653167, 0.02706946], dtype=float32)
|
| find_containing_cell(self: 'Self', point: 'VectorLike[float] | MatrixLike[float]') -> 'int | NumpyArray[int]'
| Find index of a cell that contains the given point.
|
| Parameters
| ----------
| point : VectorLike[float] | MatrixLike[float],
| Coordinates of point to query (length 3) or a
| :class:`numpy.ndarray` of ``n`` points with shape ``(n, 3)``.
|
| Returns
| -------
| output : int | numpy.ndarray
| Index or indices of the cell in this mesh that contains
| the given point.
|
| .. versionchanged:: 0.35.0
| Inputs of shape ``(1, 3)`` now return a :class:`numpy.ndarray`
| of shape ``(1,)``.
|
| See Also
| --------
| DataSet.find_closest_point
| DataSet.find_closest_cell
| DataSet.find_cells_along_line
| DataSet.find_cells_within_bounds
|
| Examples
| --------
| A unit square with 16 equal sized cells is created and a cell
| containing the point ``[0.3, 0.3, 0.0]`` is found.
|
| >>> import pyvista as pv
| >>> mesh = pv.ImageData(dimensions=[5, 5, 1], spacing=[1 / 4, 1 / 4, 0])
| >>> mesh
| ImageData...
| >>> mesh.find_containing_cell([0.3, 0.3, 0.0])
| 5
|
| A point outside the mesh domain will return ``-1``.
|
| >>> mesh.find_containing_cell([0.3, 0.3, 1.0])
| -1
|
| Find the cells that contain 1000 random points inside the mesh.
|
| >>> import numpy as np
| >>> points = np.random.default_rng().random((1000, 3))
| >>> indices = mesh.find_containing_cell(points)
| >>> indices.shape
| (1000,)
|
| get_array(self: 'Self', name: 'str', preference: 'CellLiteral | PointLiteral | FieldLiteral' = 'cell') -> 'pyvista_ndarray'
| Search both point, cell and field data for an array.
|
| Parameters
| ----------
| name : str
| Name of the array.
|
| preference : str, default: "cell"
| When scalars is specified, this is the preferred array
| type to search for in the dataset. Must be either
| ``'point'``, ``'cell'``, or ``'field'``.
|
| Returns
| -------
| pyvista.pyvista_ndarray
| Requested array.
|
| Examples
| --------
| Create a DataSet with a variety of arrays.
|
| >>> import pyvista as pv
| >>> mesh = pv.Cube()
| >>> mesh.clear_data()
| >>> mesh.point_data['point-data'] = range(mesh.n_points)
| >>> mesh.cell_data['cell-data'] = range(mesh.n_cells)
| >>> mesh.field_data['field-data'] = ['a', 'b', 'c']
| >>> mesh.array_names
| ['point-data', 'field-data', 'cell-data']
|
| Get the point data array.
|
| >>> mesh.get_array('point-data')
| pyvista_ndarray([0, 1, 2, 3, 4, 5, 6, 7])
|
| Get the cell data array.
|
| >>> mesh.get_array('cell-data')
| pyvista_ndarray([0, 1, 2, 3, 4, 5])
|
| Get the field data array.
|
| >>> mesh.get_array('field-data')
| pyvista_ndarray(['a', 'b', 'c'], dtype='<U1')
|
| get_array_association(self: 'Self', name: 'str', preference: "Literal['cell', 'point', 'field']" = 'cell') -> 'FieldAssociation'
| Get the association of an array.
|
| Parameters
| ----------
| name : str
| Name of the array.
|
| preference : str, default: "cell"
| When ``name`` is specified, this is the preferred array
| association to search for in the dataset. Must be either
| ``'point'``, ``'cell'``, or ``'field'``.
|
| Returns
| -------
| pyvista.core.utilities.arrays.FieldAssociation
| Field association of the array.
|
| Examples
| --------
| Create a DataSet with a variety of arrays.
|
| >>> import pyvista as pv
| >>> mesh = pv.Cube()
| >>> mesh.clear_data()
| >>> mesh.point_data['point-data'] = range(mesh.n_points)
| >>> mesh.cell_data['cell-data'] = range(mesh.n_cells)
| >>> mesh.field_data['field-data'] = ['a', 'b', 'c']
| >>> mesh.array_names
| ['point-data', 'field-data', 'cell-data']
|
| Get the point data array association.
|
| >>> mesh.get_array_association('point-data')
| <FieldAssociation.POINT: 0>
|
| Get the cell data array association.
|
| >>> mesh.get_array_association('cell-data')
| <FieldAssociation.CELL: 1>
|
| Get the field data array association.
|
| >>> mesh.get_array_association('field-data')
| <FieldAssociation.NONE: 2>
|
| get_cell(self: 'Self', index: 'int') -> 'Cell'
| Return a :class:`pyvista.Cell` object.
|
| Parameters
| ----------
| index : int
| Cell ID.
|
| Returns
| -------
| pyvista.Cell
| The i-th pyvista.Cell.
|
| Notes
| -----
| Cells returned from this method are deep copies of the original
| cells. Changing properties (for example, ``points``) will not affect
| the dataset they originated from.
|
| Examples
| --------
| Get the 0-th cell.
|
| >>> from pyvista import examples
| >>> mesh = examples.load_airplane()
| >>> cell = mesh.get_cell(0)
| >>> cell
| Cell ...
|
| Get the point ids of the first cell
|
| >>> cell.point_ids
| [0, 1, 2]
|
| Get the point coordinates of the first cell
|
| >>> cell.points
| array([[897.0, 48.8, 82.3],
| [906.6, 48.8, 80.7],
| [907.5, 55.5, 83.7]])
|
| For the first cell, get the points associated with the first edge
|
| >>> cell.edges[0].point_ids
| [0, 1]
|
| For a Tetrahedron, get the point ids of the last face
|
| >>> mesh = examples.cells.Tetrahedron()
| >>> cell = mesh.get_cell(0)
| >>> cell.faces[-1].point_ids
| [0, 2, 1]
|
| get_data_range(self: 'Self', arr_var: 'str | NumpyArray[float] | None' = None, preference: 'PointLiteral | CellLiteral | FieldLiteral' = 'cell') -> 'tuple[float, float]'
| Get the min and max of a named array.
|
| Parameters
| ----------
| arr_var : str, np.ndarray, optional
| The name of the array to get the range. If ``None``, the
| active scalars is used.
|
| preference : str, default: "cell"
| When scalars is specified, this is the preferred array type
| to search for in the dataset. Must be either ``'point'``,
| ``'cell'``, or ``'field'``.
|
| Returns
| -------
| tuple
| ``(min, max)`` of the named array.
|
| plot(var_item: 'list[PlottableType] | PlottableType', off_screen: 'bool | None' = None, full_screen: 'bool | None' = None, screenshot: 'str | bool | None' = None, interactive: 'bool' = True, cpos: 'CameraPositionOptions | None' = None, window_size: 'list[int] | None' = None, show_bounds: 'bool' = False, show_axes: 'bool | None' = None, notebook: 'bool | None' = None, background: 'ColorLike | None' = None, text: 'str' = '', return_img: 'bool' = False, eye_dome_lighting: 'bool' = False, volume: 'bool' = False, parallel_projection: 'bool' = False, jupyter_backend: 'JupyterBackendOptions | None' = None, return_viewer: 'bool' = False, return_cpos: 'bool' = False, jupyter_kwargs: 'dict | None' = None, theme: 'Theme | None' = None, anti_aliasing: "Literal['ssaa', 'msaa', 'fxaa'] | bool | None" = None, zoom: 'str | float | None' = None, border: 'bool' = False, border_color: 'ColorLike' = 'k', border_width: 'float' = 2.0, ssao: 'bool' = False, **kwargs) from pyvista._plot
| Plot a PyVista, numpy, or vtk object.
|
| .. versionadded:: 0.47
|
| ``plot`` can be invoked with the shell command:
|
| .. code-block:: shell
|
| pyvista plot <files> --screenshot output.png --off-screen
|
| Run ``pyvista plot --help`` for more details on available parameters.
|
| .. note::
| Providing multiple files renders them inside the same window.
|
| Parameters
| ----------
| var_item : pyvista.DataSet
| See :func:`Plotter.add_mesh <pyvista.Plotter.add_mesh>` for all
| supported types.
|
|
| off_screen : bool, optional
| Plots off screen when ``True``. Helpful for saving
| screenshots without a window popping up. Defaults to the
| global setting ``pyvista.OFF_SCREEN``.
|
| full_screen : bool, default: :attr:`pyvista.plotting.themes.Theme.full_screen`
| Opens window in full screen. When enabled, ignores
| ``window_size``.
|
| screenshot : str | bool, optional
| Saves screenshot to file when enabled. See:
| :func:`Plotter.screenshot() <pyvista.Plotter.screenshot>`.
| Default ``False``.
|
| When ``True``, takes screenshot and returns ``numpy`` array of
| image.
|
| interactive : bool, default: :attr:`pyvista.plotting.themes.Theme.interactive`
| Allows user to pan and move figure.
|
| cpos : CameraPositionOptions, optional
| List of camera position, focal point, and view up.
| See the :attr:`pyvista.Plotter.camera_position` for concrete examples
| on how to use this parameter and :ref:`cameras_api` for a detailed
| documentation on :class:`pyvista.Camera`.
|
| window_size : list[int], default: :attr:`pyvista.plotting.themes.Theme.window_size`
| Window size in pixels.
|
| show_bounds : bool, default: False
| Shows mesh bounds when ``True``.
|
| show_axes : bool, default: :attr:`pyvista.plotting.themes._AxesConfig.show`
| Shows a vtk axes widget.
|
| notebook : bool, default: :attr:`pyvista.plotting.themes.Theme.notebook`
| When ``True``, the resulting plot is placed inline a jupyter
| notebook. Assumes a jupyter console is active.
|
| background : ColorLike, default: :attr:`pyvista.plotting.themes.Theme.background`
| Color of the background.
|
| text : str, optional
| Adds text at the bottom of the plot.
|
| return_img : bool, default: False
| Returns numpy array of the last image rendered.
|
| eye_dome_lighting : bool, optional
| Enables eye dome lighting.
|
| volume : bool, default: False
| Use the :func:`Plotter.add_volume()
| <pyvista.Plotter.add_volume>` method for volume rendering.
|
| parallel_projection : bool, default: False
| Enable parallel projection.
|
| jupyter_backend : JupyterBackendOptions, optional
| Jupyter notebook plotting backend to use.
| See available documentation at :func:`pyvista.set_jupyter_backend`
| to see all valid values for this parameter along with a detailed documentation.
|
| Defaults to :attr:`pyvista.plotting.themes.Theme.jupyter_backend`
|
| return_viewer : bool, default: False
| Return the jupyterlab viewer, scene, or display object
| when plotting with jupyter notebook.
|
| return_cpos : bool, default: False
| Return the last camera position from the render window
| when enabled. Defaults to value in theme settings.
|
| jupyter_kwargs : dict, optional
| Keyword arguments for the Jupyter notebook plotting backend.
| See :ref:`customize_trame_toolbar_example` for an example
| using this keyword.
|
| theme : pyvista.plotting.themes.Theme, optional
| Plot-specific theme.
|
| anti_aliasing : Literal['ssaa', 'msaa', 'fxaa'] | bool, optional
| Enable or disable anti-aliasing. If ``True``, uses ``"msaa"``. If False,
| disables anti_aliasing. If a string, should be one of the following:
|
| * ``"ssaa"`` - Super-Sample Anti-Aliasing
| * ``"msaa"`` - Multi-Sample Anti-Aliasing
| * ``"fxaa"`` - Fast Approximate Anti-Aliasing
|
| Defaults to :attr:`pyvista.plotting.themes.Theme.anti_aliasing`
|
| zoom : float | str, optional
| Camera zoom. Either ``'tight'`` or a float. A value greater than 1
| is a zoom-in, a value less than 1 is a zoom-out. Must be greater
| than 0.
|
| border : bool, default: False
| Draw a border around each render window.
|
| border_color : ColorLike, default: "k"
| Either a string, rgb list, or hex color string. For example:
|
| * ``color='white'``
| * ``color='w'``
| * ``color=[1.0, 1.0, 1.0]``
| * ``color='#FFFFFF'``
|
| border_width : float, default: 2.0
| Width of the border in pixels when enabled.
|
| ssao : bool, optional
| Enable surface space ambient occlusion (SSAO). See
| :func:`Plotter.enable_ssao` for more details.
|
| **kwargs : dict, optional
| See :func:`pyvista.Plotter.add_mesh` for additional options.
|
| Returns
| -------
| cpos : list
| List of camera position, focal point, and view up.
| Returned only when ``return_cpos=True`` or set in the
| default global or plot theme. Not returned when in a
| jupyter notebook and ``return_viewer=True``.
|
| image : np.ndarray
| Numpy array of the last image when either ``return_img=True``
| or ``screenshot=True`` is set. Not returned when in a
| jupyter notebook with ``return_viewer=True``. Optionally
| contains alpha values. Sized:
|
| * [Window height x Window width x 3] if the theme sets
| ``transparent_background=False``.
| * [Window height x Window width x 4] if the theme sets
| ``transparent_background=True``.
|
| widget : ipywidgets.Widget
| IPython widget when ``return_viewer=True``.
|
| Examples
| --------
| Plot a simple sphere while showing its edges.
|
| >>> import pyvista as pv
| >>> mesh = pv.Sphere()
| >>> mesh.plot(show_edges=True)
|
| Plot a volume mesh. Color by distance from the center of the
| ImageData. Note ``volume=True`` is passed.
|
| >>> import numpy as np
| >>> grid = pv.ImageData(dimensions=(32, 32, 32), spacing=(0.5, 0.5, 0.5))
| >>> grid['data'] = np.linalg.norm(grid.center - grid.points, axis=1)
| >>> grid['data'] = np.abs(grid['data'] - grid['data'].max()) ** 3
| >>> grid.plot(volume=True)
|
| point_cell_ids(self: 'Self', ind: 'int') -> 'list[int]'
| Get the cell IDs that use the ind-th point.
|
| Implements :vtk:`vtkDataSet.GetPointCells`.
|
| Parameters
| ----------
| ind : int
| Point ID.
|
| Returns
| -------
| list[int]
| List of cell IDs using the ind-th point.
|
| Examples
| --------
| Get the cell ids using the 0-th point.
|
| >>> import pyvista as pv
| >>> mesh = pv.Sphere(theta_resolution=10)
| >>> mesh.point_cell_ids(0)
| [0, 1, 2, 3, 4, 5, 6, 7, 8, 9]
|
| Plot them.
|
| >>> pl = pv.Plotter()
| >>> _ = pl.add_mesh(mesh, show_edges=True)
| >>>
| >>> # Label the 0-th point
| >>> _ = pl.add_point_labels(
| ... mesh.points[0], ['0'], text_color='blue', font_size=20
| ... )
| >>>
| >>> # Get the cells ids using the 0-th point
| >>> ids = mesh.point_cell_ids(0)
| >>> cells = mesh.extract_cells(ids)
| >>> _ = pl.add_mesh(cells, color='red', show_edges=True)
| >>> centers = cells.cell_centers().points
| >>> _ = pl.add_point_labels(
| ... centers,
| ... labels=[f'{i}' for i in ids],
| ... text_color='white',
| ... font_size=20,
| ... shape=None,
| ... show_points=False,
| ... )
| >>>
| >>> # Plot the other cells
| >>> others = mesh.extract_cells(
| ... [i for i in range(mesh.n_cells) if i not in ids]
| ... )
| >>> _ = pl.add_mesh(others, show_edges=True)
| >>>
| >>> pl.camera_position = 'xy'
| >>> pl.camera.zoom(7.0)
| >>> pl.show()
|
| point_is_inside_cell(self: 'Self', ind: 'int', point: 'VectorLike[float] | MatrixLike[float]') -> 'bool | NumpyArray[np.bool_]'
| Return whether one or more points are inside a cell.
|
| .. versionadded:: 0.35.0
|
| Parameters
| ----------
| ind : int
| Cell ID.
|
| point : VectorLike[float] | MatrixLike[float]
| Point or points to query if are inside a cell.
|
| Returns
| -------
| output : bool | numpy.ndarray
| Whether point(s) is/are inside cell. A single bool is only returned if
| the input point has shape ``(3,)``.
|
| Examples
| --------
| >>> from pyvista import examples
| >>> mesh = examples.load_hexbeam()
| >>> mesh.get_cell(0).bounds
| BoundsTuple(x_min = 0.0,
| x_max = 0.5,
| y_min = 0.0,
| y_max = 0.5,
| z_min = 0.0,
| z_max = 0.5)
| >>> mesh.point_is_inside_cell(0, [0.2, 0.2, 0.2])
| True
|
| point_neighbors(self: 'Self', ind: 'int') -> 'list[int]'
| Get the point neighbors of the ind-th point.
|
| Parameters
| ----------
| ind : int
| Point ID.
|
| Returns
| -------
| list[int]
| List of neighbor points IDs for the ind-th point.
|
| See Also
| --------
| pyvista.DataSet.point_neighbors_levels
|
| Examples
| --------
| Get the point neighbors of the 0-th point.
|
| >>> import pyvista as pv
| >>> mesh = pv.Sphere(theta_resolution=10)
| >>> mesh.point_neighbors(0)
| [2, 226, 198, 170, 142, 114, 86, 254, 58, 30]
|
| Plot them.
|
| >>> pl = pv.Plotter()
| >>> _ = pl.add_mesh(mesh, show_edges=True)
| >>>
| >>> # Label the 0-th point
| >>> _ = pl.add_point_labels(
| ... mesh.points[0], ['0'], text_color='blue', font_size=40
| ... )
| >>>
| >>> # Get the point neighbors and plot them
| >>> neighbors = mesh.point_neighbors(0)
| >>> _ = pl.add_point_labels(
| ... mesh.points[neighbors],
| ... labels=[f'{i}' for i in neighbors],
| ... text_color='red',
| ... font_size=40,
| ... )
| >>> pl.camera_position = 'xy'
| >>> pl.camera.zoom(7.0)
| >>> pl.show()
|
| point_neighbors_levels(self: 'Self', ind: 'int', n_levels: 'int' = 1) -> 'Generator[list[int], None, None]'
| Get consecutive levels of point neighbors.
|
| Parameters
| ----------
| ind : int
| Point ID.
|
| n_levels : int, default: 1
| Number of levels to search for point neighbors.
| When equal to 1, it is equivalent to :func:`pyvista.DataSet.point_neighbors`.
|
| Returns
| -------
| generator[list[[int]]
| A generator of list of neighbor points IDs for the ind-th point.
|
| See Also
| --------
| pyvista.DataSet.point_neighbors
|
| Examples
| --------
| Get the point neighbors IDs starting from the 0-th point
| up until the third level.
|
| >>> import pyvista as pv
| >>> mesh = pv.Sphere(theta_resolution=10)
| >>> pt_nbr_levels = mesh.point_neighbors_levels(0, 3)
| >>> pt_nbr_levels = list(pt_nbr_levels)
| >>> pt_nbr_levels[0]
| [2, 226, 198, 170, 142, 114, 86, 30, 58, 254]
| >>> pt_nbr_levels[1]
| [3, 227, 255, 199, 171, 143, 115, 87, 59, 31]
| >>> pt_nbr_levels[2]
| [256, 32, 4, 228, 200, 172, 144, 116, 88, 60]
|
| Visualize these points IDs.
|
| >>> from functools import partial
| >>> pl = pv.Plotter()
| >>> _ = pl.add_mesh(mesh, show_edges=True)
| >>>
| >>> # Define partial function to add point labels
| >>> add_point_labels = partial(
| ... pl.add_point_labels,
| ... text_color='white',
| ... font_size=40,
| ... point_size=10,
| ... always_visible=True,
| ... )
| >>>
| >>> # Add the first point label
| >>> _ = add_point_labels(mesh.points[0], labels=['0'], text_color='blue')
| >>>
| >>> # Add the neighbors to the plot
| >>> neighbors = mesh.point_neighbors_levels(0, n_levels=3)
| >>> for i, ids in enumerate(neighbors, start=1):
| ... _ = add_point_labels(
| ... mesh.points[ids],
| ... labels=[f'{i}'] * len(ids),
| ... text_color='red',
| ... )
| >>>
| >>> pl.view_xy()
| >>> pl.camera.zoom(4.0)
| >>> pl.show()
|
| rename_array(self: 'Self', old_name: 'str', new_name: 'str', preference: 'PointLiteral | CellLiteral | FieldLiteral' = 'cell') -> 'None'
| Change array name by searching for the array then renaming it.
|
| Parameters
| ----------
| old_name : str
| Name of the array to rename.
|
| new_name : str
| Name to rename the array to.
|
| preference : str, default: "cell"
| If there are two arrays of the same name associated with
| points, cells, or field data, it will prioritize an array
| matching this type. Can be either ``'cell'``,
| ``'field'``, or ``'point'``.
|
| Examples
| --------
| Create a cube, assign a point array to the mesh named
| ``'my_array'``, and rename it to ``'my_renamed_array'``.
|
| >>> import pyvista as pv
| >>> import numpy as np
| >>> cube = pv.Cube()
| >>> cube['my_array'] = range(cube.n_points)
| >>> cube.rename_array('my_array', 'my_renamed_array')
| >>> cube['my_renamed_array']
| pyvista_ndarray([0, 1, 2, 3, 4, 5, 6, 7])
|
| set_active_scalars(self: 'Self', name: 'str | None', preference: 'PointLiteral | CellLiteral' = 'cell') -> 'tuple[FieldAssociation, NumpyArray[float] | None]'
| Find the scalars by name and appropriately sets it as active.
|
| To deactivate any active scalars, pass ``None`` as the ``name``.
|
| Parameters
| ----------
| name : str, optional
| Name of the scalars array to assign as active. If
| ``None``, deactivates active scalars for both point and
| cell data.
|
| preference : str, default: "cell"
| If there are two arrays of the same name associated with
| points or cells, it will prioritize an array matching this
| type. Can be either ``'cell'`` or ``'point'``.
|
| Returns
| -------
| pyvista.core.utilities.arrays.FieldAssociation
| Association of the scalars matching ``name``.
|
| pyvista_ndarray
| An array from the dataset matching ``name``.
|
| set_active_tensors(self: 'Self', name: 'str | None', preference: 'PointLiteral | CellLiteral' = 'point') -> 'None'
| Find the tensors by name and appropriately sets it as active.
|
| To deactivate any active tensors, pass ``None`` as the ``name``.
|
| Parameters
| ----------
| name : str, optional
| Name of the tensors array to assign as active.
|
| preference : str, default: "point"
| If there are two arrays of the same name associated with
| points, cells, or field data, it will prioritize an array
| matching this type. Can be either ``'cell'``,
| ``'field'``, or ``'point'``.
|
| set_active_vectors(self: 'Self', name: 'str | None', preference: 'PointLiteral | CellLiteral' = 'point') -> 'None'
| Find the vectors by name and appropriately sets it as active.
|
| To deactivate any active vectors, pass ``None`` as the ``name``.
|
| Parameters
| ----------
| name : str, optional
| Name of the vectors array to assign as active.
|
| preference : str, default: "point"
| If there are two arrays of the same name associated with
| points, cells, or field data, it will prioritize an array
| matching this type. Can be either ``'cell'``,
| ``'field'``, or ``'point'``.
|
| to_arrow(self: 'Self', association: 'PointLiteral | CellLiteral' = 'point') -> 'pyarrow.Table'
| Return this dataset's point or cell arrays as a :class:`pyarrow.Table`.
|
| Thin wrapper around :meth:`DataSetAttributes.to_arrow`.
|
| Requires :mod:`pyarrow`.
|
| Parameters
| ----------
| association : str | pyvista.core.utilities.arrays.FieldAssociation, default: 'point'
| Which attribute set to convert. Accepts ``'point'`` /
| ``FieldAssociation.POINT`` or ``'cell'`` / ``FieldAssociation.CELL``.
|
| Returns
| -------
| pyarrow.Table
| Table with one column per (expanded) array.
|
| Examples
| --------
| >>> import pyvista as pv
| >>> mesh = pv.Cube()
| >>> mesh.clear_data()
| >>> mesh.point_data['scalars'] = range(mesh.n_points)
| >>> mesh.to_arrow().num_rows
| 8
|
| to_pandas(self: 'Self', association: 'PointLiteral | CellLiteral' = 'point') -> 'pandas.DataFrame'
| Return this dataset's point or cell arrays as a :class:`pandas.DataFrame`.
|
| Thin wrapper around :meth:`DataSetAttributes.to_pandas`. See that
| method for column-expansion rules and dtype handling.
|
| Requires :mod:`pandas`.
|
| Parameters
| ----------
| association : str | pyvista.core.utilities.arrays.FieldAssociation, default: 'point'
| Which attribute set to convert. Accepts ``'point'`` or
| ``FieldAssociation.POINT``, which maps to :attr:`point_data`
| (``n_points`` rows); or ``'cell'`` or ``FieldAssociation.CELL``,
| which maps to :attr:`cell_data` (``n_cells`` rows). Field data is
| not supported because its arrays may have differing lengths.
|
| Returns
| -------
| pandas.DataFrame
| DataFrame with one column per (expanded) array.
|
| See Also
| --------
| :ref:`dataframe_export_example`
|
| Examples
| --------
| >>> import pyvista as pv
| >>> mesh = pv.Cube()
| >>> mesh.clear_data()
| >>> mesh.point_data['scalars'] = range(mesh.n_points)
| >>> df = mesh.to_pandas()
| >>> list(df.columns)
| ['scalars']
|
| ----------------------------------------------------------------------
| Readonly properties inherited from pyvista.core.dataset.DataSet:
|
| active_normals
| Return the active normals as an array.
|
| Returns
| -------
| pyvista_ndarray
| Active normals of this dataset.
|
| Notes
| -----
| If both point and cell normals exist, this returns point
| normals by default.
|
| Examples
| --------
| Compute normals on an example sphere mesh and return the
| active normals for the dataset. Show that this is the same size
| as the number of points.
|
| >>> import pyvista as pv
| >>> mesh = pv.Sphere()
| >>> mesh = mesh.compute_normals()
| >>> normals = mesh.active_normals
| >>> normals.shape
| (842, 3)
| >>> mesh.n_points
| 842
|
| active_scalars
| Return the active scalars as an array.
|
| Returns
| -------
| Optional[pyvista_ndarray]
| Active scalars as an array.
|
| active_scalars_info
| Return the active scalar's association and name.
|
| Association refers to the data association (e.g. point, cell, or
| field) of the active scalars.
|
| Returns
| -------
| ActiveArrayInfo
| The scalars info in an object with namedtuple semantics,
| with attributes ``association`` and ``name``.
|
| Notes
| -----
| If both cell and point scalars are present and neither have
| been set active within at the dataset level, point scalars
| will be made active.
|
| Examples
| --------
| Create a mesh, add scalars to the mesh, and return the active
| scalars info. Note how when the scalars are added, they
| automatically become the active scalars.
|
| >>> import pyvista as pv
| >>> mesh = pv.Sphere()
| >>> mesh['Z Height'] = mesh.points[:, 2]
| >>> mesh.active_scalars_info
| ActiveArrayInfoTuple(association=<FieldAssociation.POINT: 0>, name='Z Height')
|
| active_tensors
| Return the active tensors array.
|
| Returns
| -------
| Optional[np.ndarray]
| Active tensors array.
|
| active_tensors_info
| Return the active tensor's field and name: [field, name].
|
| Returns
| -------
| ActiveArrayInfo
| Active tensor's field and name: [field, name].
|
| active_vectors
| Return the active vectors array.
|
| Returns
| -------
| Optional[pyvista_ndarray]
| Active vectors array.
|
| Examples
| --------
| Create a mesh, compute the normals inplace, and return the
| normals vector array.
|
| >>> import pyvista as pv
| >>> mesh = pv.Sphere()
| >>> _ = mesh.compute_normals(inplace=True)
| >>> mesh.active_vectors # doctest:+SKIP
| pyvista_ndarray([[-2.48721432e-10, -1.08815623e-09, -1.00000000e+00],
| [-2.48721432e-10, -1.08815623e-09, 1.00000000e+00],
| [-1.18888125e-01, 3.40539310e-03, -9.92901802e-01],
| ...,
| [-3.11940581e-01, -6.81432486e-02, 9.47654784e-01],
| [-2.09880397e-01, -4.65070531e-02, 9.76620376e-01],
| [-1.15582108e-01, -2.80492082e-02, 9.92901802e-01]],
| dtype=float32)
|
| active_vectors_info
| Return the active vector's association and name.
|
| Association refers to the data association (e.g. point, cell, or
| field) of the active vectors.
|
| Returns
| -------
| ActiveArrayInfo
| The vectors info in an object with namedtuple semantics,
| with attributes ``association`` and ``name``.
|
| Notes
| -----
| If both cell and point vectors are present and neither have
| been set active within at the dataset level, point vectors
| will be made active.
|
| Examples
| --------
| Create a mesh, compute the normals inplace, set the active
| vectors to the normals, and show that the active vectors are
| the ``'Normals'`` array associated with points.
|
| >>> import pyvista as pv
| >>> mesh = pv.Sphere()
| >>> _ = mesh.compute_normals(inplace=True)
| >>> mesh.active_vectors_name = 'Normals'
| >>> mesh.active_vectors_info
| ActiveArrayInfoTuple(association=<FieldAssociation.POINT: 0>, name='Normals')
|
| area
| Return the mesh area if 2D.
|
| This will return 0 for meshes with 3D cells.
|
| Returns
| -------
| float
| Total area of the mesh.
|
| Examples
| --------
| Get the area of a square of size 2x2.
| Note 5 points in each direction.
|
| >>> import pyvista as pv
| >>> mesh = pv.ImageData(dimensions=(5, 5, 1))
| >>> mesh.area
| 16.0
|
| A mesh with 3D cells does not have an area. To get
| the outer surface area, first extract the surface using
| :func:`~pyvista.DataObjectFilters.extract_surface`.
|
| >>> mesh = pv.ImageData(dimensions=(5, 5, 5))
| >>> mesh.area
| 0.0
|
| Get the area of a sphere. Discretization error results
| in slight difference from ``pi``.
|
| >>> mesh = pv.Sphere()
| >>> mesh.area
| 3.13
|
| array_names
| Return a list of array names for the dataset.
|
| This makes sure to put the active scalars' name first in the list.
|
| Returns
| -------
| list[str]
| List of array names for the dataset.
|
| Examples
| --------
| Return the array names for a mesh.
|
| >>> import pyvista as pv
| >>> mesh = pv.Sphere()
| >>> mesh.point_data['my_array'] = range(mesh.n_points)
| >>> mesh.array_names
| ['my_array', 'Normals']
|
| arrows
| Return a glyph representation of the active vector data as arrows.
|
| Arrows will be located at the points or cells of the mesh and
| their size will be dependent on the norm of the vector.
| Their direction will be the "direction" of the vector.
|
| If there are both active point and cell vectors, preference is
| given to the point vectors.
|
| Returns
| -------
| pyvista.PolyData
| Active vectors represented as arrows.
|
| Examples
| --------
| Create a mesh, compute the normals and set them active.
|
| >>> import pyvista as pv
| >>> mesh = pv.Cube()
| >>> mesh_w_normals = mesh.compute_normals()
| >>> mesh_w_normals.active_vectors_name = 'Normals'
|
| Plot the active vectors as arrows. Show the original mesh as wireframe for
| context.
|
| >>> arrows = mesh_w_normals.arrows
| >>> pl = pv.Plotter()
| >>> _ = pl.add_mesh(mesh, style='wireframe')
| >>> _ = pl.add_mesh(arrows, color='red')
| >>> pl.show()
|
| bounding_sphere
| Compute the radius and center of a bounding sphere.
|
| The sphere is exact for meshes with 4 points or less, and is otherwise approximated
| using Ritter's algorithm. Returns NaN values if there are no points.
|
| Uses :vtk:`vtkCell.ComputeBoundingSphere` internally for the computation.
|
| .. versionadded:: 0.48
|
| Returns
| -------
| float, tuple
| Sphere radius as a float and center as a tuple of floats.
|
| Examples
| --------
| Get the bounding sphere geometry of a mesh.
|
| >>> import pyvista as pv
| >>> from pyvista import examples
| >>> mesh = examples.load_airplane()
| >>> radius, center = mesh.bounding_sphere
|
| Create a sphere and plot it along with the original mesh.
|
| >>> sphere = pv.Icosphere(radius=radius, center=center)
| >>> pl = pv.Plotter()
| >>> _ = pl.add_mesh(mesh)
| >>> _ = pl.add_mesh(sphere, style='wireframe', color='black')
| >>> pl.view_xy()
| >>> pl.camera.zoom(1.5)
| >>> pl.show()
|
| bounds
| Return the bounding box of this dataset.
|
| Returns
| -------
| BoundsLike
| Bounding box of this dataset.
| The form is: ``(x_min, x_max, y_min, y_max, z_min, z_max)``.
|
| Examples
| --------
| Create a cube and return the bounds of the mesh.
|
| >>> import pyvista as pv
| >>> cube = pv.Cube()
| >>> cube.bounds
| BoundsTuple(x_min = -0.5,
| x_max = 0.5,
| y_min = -0.5,
| y_max = 0.5,
| z_min = -0.5,
| z_max = 0.5)
|
| cell
| A generator that provides an easy way to loop over all cells.
|
| To access a single cell, use :func:`pyvista.DataSet.get_cell`.
|
| .. versionchanged:: 0.39.0
| Now returns a generator instead of a list.
| Use ``get_cell(i)`` instead of ``cell[i]``.
|
| Yields
| ------
| pyvista.Cell
|
| See Also
| --------
| pyvista.DataSet.get_cell
|
| Examples
| --------
| Loop over the cells
|
| >>> import pyvista as pv
| >>> # Create a grid with 9 points and 4 cells
| >>> mesh = pv.ImageData(dimensions=(3, 3, 1))
| >>> for cell in mesh.cell: # doctest: +SKIP
| ... cell
|
| cell_data
| Return cell data as DataSetAttributes.
|
| Returns
| -------
| DataSetAttributes
| Cell data as DataSetAttributes.
|
| Examples
| --------
| Add cell arrays to a mesh and list the available ``cell_data``.
|
| >>> import pyvista as pv
| >>> import numpy as np
| >>> mesh = pv.Cube()
| >>> mesh.clear_data()
| >>> mesh.cell_data['my_array'] = np.random.default_rng().random(mesh.n_cells)
| >>> mesh.cell_data['my_other_array'] = np.arange(mesh.n_cells)
| >>> mesh.cell_data
| pyvista DataSetAttributes
| Association : CELL
| Active Scalars : my_array
| Active Vectors : None
| Active Texture : None
| Active Normals : None
| Contains arrays :
| my_array float64 (6,) SCALARS
| my_other_array int64 (6,)
|
| Access an array from ``cell_data``.
|
| >>> mesh.cell_data['my_other_array']
| pyvista_ndarray([0, 1, 2, 3, 4, 5])
|
| Or access it directly from the mesh.
|
| >>> mesh['my_array'].shape
| (6,)
|
| dimensionality
| Return the number of spatial dimensions spanned by this dataset's points.
|
| This is equivalent to computing the matrix rank of the points.
|
| .. versionchanged:: 0.47
|
| This property is now generalized for all datasets. Previously, it was only available
| for datasets with a ``dimensions`` property.
|
| Notes
| -----
| :attr:`dimensionality`:
|
| - ranges from ``0`` to ``3`` for all mesh types.
| - is equivalent to :attr:`max_cell_dimensionality` and :attr:`min_cell_dimensionality`
| for gridded data types :class:`~pyvista.ImageData` and :class:`~pyvista.RectilinearGrid`.
|
| Returns
| -------
| int
| The dimensionality of the dataset.
|
| See Also
| --------
| max_cell_dimensionality, min_cell_dimensionality
|
| Examples
| --------
| A single point has ``0`` dimensionality.
|
| >>> import pyvista as pv
| >>> mesh = pv.PointSet([[0.0, 0.0, 0.0]])
| >>> mesh.dimensionality
| 0
|
| With two points, the dimensionality is ``1``.
|
| >>> mesh = pv.PointSet([[0.0, 0.0, 0.0], [1.0, 1.0, 1.0]])
| >>> mesh.dimensionality
| 1
|
| Two-dimensional :class:`~pyvista.ImageData` (i.e. where one of its dimensions is one) has
| a dimensionality of ``2``.
|
| >>> mesh = pv.ImageData(dimensions=(100, 100, 1))
| >>> mesh.dimensionality
| 2
|
| A :func:`~pyvista.Plane` also has dimensionality of ``2``, even if it's arbitrarily
| rotated in space.
|
| >>> mesh = pv.Plane().rotate_vector((1, 2, 3), 30)
| >>> mesh.dimensionality
| 2
|
| A :func:`~pyvista.Cube` has a dimensionality of 3.
|
| >>> mesh = pv.Cube()
| >>> mesh.dimensionality
| 3
|
| distinct_cell_types
| Return the set of distinct cell types in this dataset.
|
| The set contains :class:`~pyvista.CellType` values corresponding to the
| :attr:`pyvista.Cell.type` of each distinct cell in the dataset.
|
| .. warning::
| Computing distinct cell types can be very slow for complex meshes with VTK version
| less than 9.6.
|
| .. versionadded:: 0.47
|
| Returns
| -------
| set[CellType]
| Set of :class:`~pyvista.CellType` values.
|
| See Also
| --------
| min_cell_dimensionality
| max_cell_dimensionality
| pyvista.UnstructuredGrid.celltypes
|
| Examples
| --------
| Load a mesh with linear :attr:`pyvista.CellType.HEXAHEDRON` cells.
|
| >>> from pyvista import examples
| >>> hex_beam = examples.load_hexbeam()
| >>> hex_beam.distinct_cell_types
| {<CellType.HEXAHEDRON: 12>}
|
| Load a mesh with mixed cells.
|
| >>> mesh = examples.download_cow()
| >>> sorted(mesh.distinct_cell_types)
| [<CellType.TRIANGLE: 5>, <CellType.POLYGON: 7>, <CellType.QUAD: 9>]
|
| Load 2D image.
|
| >>> mesh = examples.load_logo()
| >>> mesh.distinct_cell_types
| {<CellType.PIXEL: 8>}
|
| has_nonlinear_cells
| Return True if the mesh contains any non-linear cells.
|
| .. note::
| Only :class:`~pyvista.UnstructuredGrid` can have non-linear cells. This property is
| therefore always False for all other dataset types.
|
| .. warning::
| Checking for non-linear cells can be very slow for complex meshes with VTK version
| less than 9.6.
|
| .. versionadded:: 0.47
|
| Examples
| --------
| >>> from pyvista import examples
| >>> mesh = examples.cells.Hexahedron()
| >>> mesh.has_nonlinear_cells
| False
|
| >>> mesh = examples.cells.QuadraticHexahedron()
| >>> mesh.has_nonlinear_cells
| True
|
| is_empty
| Return ``True`` if there are no points.
|
| .. versionadded:: 0.45
|
| Examples
| --------
| >>> import pyvista as pv
| >>> mesh = pv.PolyData()
| >>> mesh.is_empty
| True
|
| >>> mesh = pv.Sphere()
| >>> mesh.is_empty
| False
|
| length
| Return the length of the diagonal of the bounding box.
|
| Returns
| -------
| float
| Length of the diagonal of the bounding box.
|
| Examples
| --------
| Get the length of the bounding box of a cube. This should
| match ``3**(1/2)`` since it is the diagonal of a cube that is
| ``1 x 1 x 1``.
|
| >>> import pyvista as pv
| >>> mesh = pv.Cube()
| >>> mesh.length
| 1.7320508075688772
|
| max_cell_dimensionality
| Return the maximum spatial dimensionality of all cells in this mesh.
|
| .. versionadded:: 0.47
|
| Notes
| -----
| :attr:`max_cell_dimensionality`:
|
| - is always ``0`` for :class:`~pyvista.PointSet`
| - ranges from ``0`` to ``2`` for :class:`~pyvista.PolyData`.
| - ranges from ``0`` to ``3`` for all other mesh types.
| - is equivalent to :attr:`dimensionality` for gridded data types
| :class:`~pyvista.ImageData` and :class:`~pyvista.RectilinearGrid`.
|
| See Also
| --------
| min_cell_dimensionality, dimensionality, distinct_cell_types
|
| Returns
| -------
| int
| The maximum dimensionality of the dataset's cells.
|
| Examples
| --------
| :class:`~pyvista.PointSet` has no cells, so its :attr:`max_cell_dimensionality` is always
| ``0``.
|
| >>> import pyvista as pv
| >>> from pyvista import examples
| >>> mesh = pv.Sphere().cast_to_pointset()
| >>> mesh.max_cell_dimensionality
| 0
|
| A :class:`~pyvista.PolyData` surface mesh with 2D polygonal cells such as
| :func:`~pyvista.Sphere` has max cell dimensionality of ``2``.
|
| >>> mesh = pv.Sphere()
| >>> mesh.max_cell_dimensionality
| 2
|
| Since there are no 1D :attr:`~pyvista.CellType.LINE` or 0D
| :attr:`~pyvista.CellType.VERTEX` cells, the :attr:`min_cell_dimensionality` is also ``2``
| in this case.
|
| >>> mesh.min_cell_dimensionality
| 2
|
| A :class:`~pyvista.UnstructuredGrid` with 3D cells such as :func:`~pyvista.SolidSphere`
| has max and min cell dimensionality of ``3``.
|
| >>> mesh = pv.SolidSphere()
| >>> mesh.max_cell_dimensionality
| 3
| >>> mesh.min_cell_dimensionality
| 3
|
| A :func:`~pyvista.Line` or :func:`~pyvista.Spline` with 1D cells has a max and min
| cell dimensionality of ``1``.
|
| >>> mesh = pv.Line([0.0, 0.0, 0.0], [1.0, 1.0, 1.0])
| >>> mesh.max_cell_dimensionality
| 1
| >>> mesh.min_cell_dimensionality
| 1
|
| A curvilinear :class:`~pyvista.StructuredGrid` such as the one from
| :func:`~pyvista.examples.downloads.download_wavy` has 2D cells.
|
| >>> mesh = examples.download_wavy()[0]
| >>> mesh.max_cell_dimensionality
| 2
| >>> mesh.min_cell_dimensionality
| 2
|
| But it has a spatial :attr:`dimensionality` of ``3`` since its points span three
| dimensions.
|
| >>> mesh.dimensionality
| 3
|
| The dimensionality can vary if there are mixed cell types. E.g. load
| :func:`~pyvista.examples.downloads.download_prostar`.
|
| >>> mesh = examples.download_prostar()
| >>> sorted(mesh.distinct_cell_types) # doctest:+NORMALIZE_WHITESPACE
| [<CellType.VERTEX: 1>, <CellType.LINE: 3>, <CellType.TRIANGLE: 5>, <CellType.POLYGON: 7>,
| <CellType.QUAD: 9>, <CellType.TETRA: 10>, <CellType.HEXAHEDRON: 12>, <CellType.WEDGE: 13>,
| <CellType.PYRAMID: 14>, <CellType.POLYHEDRON: 42>]
|
| There are 3D volumetric cells, so the max dimensionality is ``3``.
|
| >>> mesh.max_cell_dimensionality
| 3
|
| And since there are :attr:`~pyvista.CellType.VERTEX` cells its
| :attr:`min_cell_dimensionality` is ``0``.
|
| >>> mesh.min_cell_dimensionality
| 0
|
| min_cell_dimensionality
| Get the minimum spatial dimensionality of all cells in this mesh.
|
| .. versionadded:: 0.47
|
| Notes
| -----
| :attr:`min_cell_dimensionality`:
|
| - is always ``0`` for :class:`~pyvista.PointSet`
| - ranges from ``0`` to ``2`` for :class:`~pyvista.PolyData`.
| - ranges from ``0`` to ``3`` for all other mesh types.
| - is equivalent to :attr:`dimensionality` for gridded data types
| :class:`~pyvista.ImageData` and :class:`~pyvista.RectilinearGrid`.
|
| See Also
| --------
| max_cell_dimensionality, dimensionality, distinct_cell_types
|
| Returns
| -------
| int
| The minimum dimensionality of the dataset's cells.
|
| Examples
| --------
| Show the max and min cell dimensionality of a :attr:`~pyvista.CellType.LINE` cell and
| :attr:`~pyvista.CellType.TRIANGLE` cell.
|
| >>> from pyvista.examples import cells
| >>> line = cells.Line()
| >>> line.max_cell_dimensionality
| 1
| >>> line.min_cell_dimensionality
| 1
|
| >>> tri = cells.Triangle()
| >>> tri.max_cell_dimensionality
| 2
| >>> tri.min_cell_dimensionality
| 2
|
| Merge the two cells and show the max and min cell dimensionality.
|
| >>> merged = line + tri
| >>> merged.max_cell_dimensionality
| 2
| >>> merged.min_cell_dimensionality
| 1
|
| n_arrays
| Return the number of arrays present in the dataset.
|
| Returns
| -------
| int
| Number of arrays present in the dataset.
|
| n_cells
| Return the number of cells in the entire dataset.
|
| Returns
| -------
| int :
| Number of cells in the entire dataset.
|
| Notes
| -----
| This returns the total number of cells -- for :class:`pyvista.PolyData`
| this includes vertices, lines, triangle strips and polygonal faces.
|
| Examples
| --------
| Create a mesh and return the number of cells in the
| mesh.
|
| >>> import pyvista as pv
| >>> cube = pv.Cube()
| >>> cube.n_cells
| 6
|
| n_points
| Return the number of points in the entire dataset.
|
| Returns
| -------
| int
| Number of points in the entire dataset.
|
| Examples
| --------
| Create a mesh and return the number of points in the
| mesh.
|
| >>> import pyvista as pv
| >>> cube = pv.Cube()
| >>> cube.n_points
| 8
|
| number_of_cells
| Return the number of cells.
|
| Returns
| -------
| int :
| Number of cells.
|
| number_of_points
| Return the number of points.
|
| Returns
| -------
| int :
| Number of points.
|
| point_data
| Return point data as DataSetAttributes.
|
| Returns
| -------
| DataSetAttributes
| Point data as DataSetAttributes.
|
| Examples
| --------
| Add point arrays to a mesh and list the available ``point_data``.
|
| >>> import pyvista as pv
| >>> import numpy as np
| >>> mesh = pv.Cube()
| >>> mesh.clear_data()
| >>> mesh.point_data['my_array'] = np.random.default_rng().random(mesh.n_points)
| >>> mesh.point_data['my_other_array'] = np.arange(mesh.n_points)
| >>> mesh.point_data
| pyvista DataSetAttributes
| Association : POINT
| Active Scalars : my_array
| Active Vectors : None
| Active Texture : None
| Active Normals : None
| Contains arrays :
| my_array float64 (8,) SCALARS
| my_other_array int64 (8,)
|
| Access an array from ``point_data``.
|
| >>> mesh.point_data['my_other_array']
| pyvista_ndarray([0, 1, 2, 3, 4, 5, 6, 7])
|
| Or access it directly from the mesh.
|
| >>> mesh['my_array'].shape
| (8,)
|
| volume
| Return the mesh volume.
|
| This will return 0 for meshes with 2D cells.
|
| Returns
| -------
| float
| Total volume of the mesh.
|
| Examples
| --------
| Get the volume of a cube of size 4x4x4.
| Note that there are 5 points in each direction.
|
| >>> import pyvista as pv
| >>> mesh = pv.ImageData(dimensions=(5, 5, 5))
| >>> mesh.volume
| 64.0
|
| A mesh with 2D cells has no volume.
|
| >>> mesh = pv.ImageData(dimensions=(5, 5, 1))
| >>> mesh.volume
| 0.0
|
| :class:`pyvista.PolyData` is special as a 2D surface can
| enclose a 3D volume. This case uses a different methodology,
| see :func:`pyvista.PolyData.volume`.
|
| >>> mesh = pv.Sphere()
| >>> mesh.volume
| 0.51825
|
| ----------------------------------------------------------------------
| Data descriptors inherited from pyvista.core.dataset.DataSet:
|
| active_scalars_name
| Return the name of the active scalars.
|
| Returns
| -------
| str
| Name of the active scalars.
|
| Examples
| --------
| Create a mesh, add scalars to the mesh, and return the name of
| the active scalars.
|
| >>> import pyvista as pv
| >>> mesh = pv.Sphere()
| >>> mesh['Z Height'] = mesh.points[:, 2]
| >>> mesh.active_scalars_name
| 'Z Height'
|
| active_tensors_name
| Return the name of the active tensor array.
|
| Returns
| -------
| str
| Name of the active tensor array.
|
| active_texture_coordinates
| Return the active texture coordinates on the points.
|
| Returns
| -------
| Optional[pyvista_ndarray]
| Active texture coordinates on the points.
|
| Examples
| --------
| Return the active texture coordinates from the globe example.
|
| >>> from pyvista import examples
| >>> globe = examples.load_globe()
| >>> globe.active_texture_coordinates
| pyvista_ndarray([[0. , 0. ],
| [0. , 0.07142857],
| [0. , 0.14285714],
| ...,
| [1. , 0.85714286],
| [1. , 0.92857143],
| [1. , 1. ]], shape=(540, 2))
|
| active_vectors_name
| Return the name of the active vectors array.
|
| Returns
| -------
| str
| Name of the active vectors array.
|
| Examples
| --------
| Create a mesh, compute the normals, set them as active, and
| return the name of the active vectors.
|
| >>> import pyvista as pv
| >>> mesh = pv.Sphere()
| >>> mesh_w_normals = mesh.compute_normals()
| >>> mesh_w_normals.active_vectors_name = 'Normals'
| >>> mesh_w_normals.active_vectors_name
| 'Normals'
|
| center
| Set or return the center of the bounding box.
|
| .. versionchanged:: 0.47
| Center can now be set.
|
| Returns
| -------
| tuple[float, float, float]
| Center of the bounding box.
|
| Examples
| --------
| Get the center of a mesh.
|
| >>> import pyvista as pv
| >>> mesh = pv.Sphere(center=(1, 2, 0))
| >>> mesh.center
| (1.0, 2.0, 0.0)
|
| ----------------------------------------------------------------------
| Methods inherited from pyvista.core.filters.image_data.ImageDataFilters:
|
| cells_to_points(self: 'ImageData', scalars: 'str | None' = None, *, dimensionality: "VectorLike[bool] | Literal[0, 1, 2, 3, '0D', '1D', '2D', '3D', 'preserve']" = 'preserve', copy: 'bool' = True)
| Re-mesh image data from a cell-based to a point-based representation.
|
| This filter changes how image data is represented. Data represented as cells
| at the input is re-meshed into an alternative representation as points at the
| output. Only the :class:`~pyvista.ImageData` container is modified so that
| the number of input cells equals the number of output points. The re-meshing is
| otherwise lossless in the sense that cell data at the input is passed through
| unmodified and stored as point data at the output. Any point data at the input is
| ignored and is not used by this filter.
|
| To change the image data's representation, the input cell centers are used to
| represent the output points. This has the effect of "shrinking" the
| input image dimensions by one along each axis (i.e. half the cell width on each
| side). For example, an image with 101 points and 100 cells along an axis at the
| input will have 100 points and 99 cells at the output. If the input has 1mm
| spacing, the axis size will also decrease from 100mm to 99mm.
|
| Since filters may be inherently cell-based (e.g. some :class:`~pyvista.DataSetFilters`)
| or may operate on point data exclusively (e.g. most :class:`~pyvista.ImageDataFilters`),
| re-meshing enables the same data to be used with either kind of filter while
| ensuring the input data to those filters has the appropriate representation.
| This filter is also useful when plotting image data to achieve a desired visual
| effect, such as plotting images as points instead of as voxel cells.
|
| .. note::
| Only the input's :attr:`~pyvista.ImageData.dimensions`, and
| :attr:`~pyvista.ImageData.origin` are modified by this filter. Other spatial
| properties such as :attr:`~pyvista.ImageData.spacing` and
| :attr:`~pyvista.ImageData.direction_matrix` are not affected.
|
| .. versionadded:: 0.44.0
|
| See Also
| --------
| points_to_cells
| Inverse of this filter to represent points as cells.
| :meth:`~pyvista.DataObjectFilters.cell_data_to_point_data`
| Resample cell data as point data without modifying the container.
| :meth:`~pyvista.DataObjectFilters.cell_data_to_point_data`
| Resample point data as cell data without modifying the container.
|
| Parameters
| ----------
| scalars : str, optional
| Name of cell data scalars to pass through to the output as point data. Use
| this parameter to restrict the output to only include the specified array.
| By default, all cell data arrays at the input are passed through as point
| data at the output.
|
| dimensionality : VectorLike[bool], Literal[0, 1, 2, 3, "0D", "1D", "2D", "3D", "preserve"]
| Control which dimensions will be modified by the filter.
| ``'preserve'`` is used by default.
|
| - Can be specified as a sequence of 3 boolean to allow modification on a per
| dimension basis.
| - ``0`` or ``'0D'``: convenience alias to output a 0D ImageData with
| dimensions ``(1, 1, 1)``. Only valid for 0D inputs.
| - ``1`` or ``'1D'``: convenience alias to output a 1D ImageData where
| exactly one dimension is greater than one, e.g. ``(>1, 1, 1)``. Only valid
| for 0D or 1D inputs.
| - ``2`` or ``'2D'``: convenience alias to output a 2D ImageData where
| exactly two dimensions are greater than one, e.g. ``(>1, >1, 1)``. Only
| valid for 0D, 1D, or 2D inputs.
| - ``3`` or ``'3D'``: convenience alias to output a 3D ImageData, where all
| three dimensions are greater than one, e.g. ``(>1, >1, >1)``. Valid for
| any 0D, 1D, 2D, or 3D inputs.
| - ``'preserve'`` (default): convenience alias to not modify singleton
| dimensions.
|
| .. note::
| This filter does not modify singleton dimensions with ``dimensionality``
| set as ``'preserve'`` by default.
|
| copy : bool, default: True
| Copy the input cell data before associating it with the output point data.
| If ``False``, the input and output will both refer to the same data array(s).
|
| Returns
| -------
| pyvista.ImageData
| Image with a point-based representation.
|
| Examples
| --------
| Load an image with cell data.
|
| >>> from pyvista import examples
| >>> image = examples.load_uniform()
|
| Show the current properties and cell arrays of the image.
|
| >>> image
| ImageData (...)
| N Cells: 729
| N Points: 1000
| X Bounds: 0.000e+00, 9.000e+00
| Y Bounds: 0.000e+00, 9.000e+00
| Z Bounds: 0.000e+00, 9.000e+00
| Dimensions: 10, 10, 10
| Spacing: 1.000e+00, 1.000e+00, 1.000e+00
| N Arrays: 2
|
| >>> image.cell_data.keys()
| ['Spatial Cell Data']
|
| Re-mesh the cells and cell data as points and point data.
|
| >>> points_image = image.cells_to_points()
|
| Show the properties and point arrays of the re-meshed image.
|
| >>> points_image
| ImageData (...)
| N Cells: 512
| N Points: 729
| X Bounds: 5.000e-01, 8.500e+00
| Y Bounds: 5.000e-01, 8.500e+00
| Z Bounds: 5.000e-01, 8.500e+00
| Dimensions: 9, 9, 9
| Spacing: 1.000e+00, 1.000e+00, 1.000e+00
| N Arrays: 1
|
| >>> points_image.point_data.keys()
| ['Spatial Cell Data']
|
| Observe that:
|
| - The input cell array is now a point array
| - The output has one less array (the input point data is ignored)
| - The dimensions have decreased by one
| - The bounds have decreased by half the spacing
| - The output ``N Points`` equals the input ``N Cells``
|
| See :ref:`image_representations_example` for more examples using this filter.
|
| close(self: 'ImageData', kernel_size: 'int | VectorLike[int]' = (3, 3, 3), scalars: 'str | None' = None, *, binary: 'bool | VectorLike[float] | None' = None, progress_bar: 'bool' = False)
| Perform morphological closing on continuous or binary data.
|
| Closing is a :meth:`dilation <dilate>` followed by an :meth:`erosion <erode>`.
| It is used to fill small holes/gaps while preserving the shape and size of larger objects.
|
| .. versionadded:: 0.47
|
| Parameters
| ----------
| kernel_size : int | VectorLike[int], default: (3, 3, 3)
| Determines the size of the kernel along the xyz-axes. Only non-singleton dimensions
| are closed, e.g. a kernel size of ``(3, 3, 1)`` and ``(3, 3, 3)`` produce the same
| result for 2D images.
|
| scalars : str, optional
| Name of scalars to process. Defaults to currently active scalars.
|
| binary : bool | VectorLike[float], optional
| Control if binary closing or continuous closing is used. Refer to
| :meth:`dilate` and/or :meth:`erode` for details about using this keyword.
|
| progress_bar : bool, default: False
| Display a progress bar to indicate progress.
|
| Returns
| -------
| pyvista.ImageData
| Dataset that has been closed.
|
| See Also
| --------
| open, erode, dilate
|
| Notes
| -----
| This filter only supports point data. For inputs with cell data, consider
| re-meshing the cell data as point data with
| :meth:`~pyvista.ImageDataFilters.cells_to_points`
| or resampling the cell data to point data with
| :func:`~pyvista.DataObjectFilters.cell_data_to_point_data`.
|
| Examples
| --------
| Load a binary image: :func:`~pyvista.examples.downloads.download_yinyang()`.
|
| >>> from pyvista import examples
| >>> im = examples.download_yinyang()
|
| Use ``close`` with a relatively small kernel to fill the top black edge of the yinyang.
|
| >>> closed = im.close(kernel_size=5)
| >>> kwargs = dict(
| ... cmap='grey',
| ... lighting=False,
| ... cpos='xy',
| ... zoom='tight',
| ... show_axes=False,
| ... show_scalar_bar=False,
| ... )
| >>> closed.plot(**kwargs)
|
| Use a much larger kernel to also fill the small black circle.
|
| >>> closed = im.close(kernel_size=25)
| >>> closed.plot(**kwargs)
|
| Since closing is the inverse of opening, we can alternatively use :meth:`open` to
| fill the white foreground values instead of the black background.
|
| >>> opened = im.open(kernel_size=25)
| >>> opened.plot(**kwargs)
|
| concatenate(self: 'ImageData', images: 'ImageData | Sequence[ImageData]', axis: '_AxisOptions | None' = None, *, mode: '_ConcatenateModeOptions | None' = None, dtype_policy: '_ConcatenateDTypePolicyOptions | None' = None, component_policy: '_ConcatenateComponentPolicyOptions | None' = None, background_value: 'float | VectorLike[float]' = 0.0, resample_kwargs: 'dict[str, Any] | None' = None)
| Combine multiple images into one.
|
| This filter uses :vtk:`vtkImageAppend` to combine multiple images. By default, images are
| concatenated along the specified ``axis``, and all images must have:
|
| #. identical dimensions except along the specified ``axis``,
| #. the same scalar dtype, and
| #. the same number of scalar components.
|
| Use ``mode`` for cases with mismatched dimensions, ``dtype_policy`` for cases with
| mismatched dtypes, and/or ``component_policy`` for cases with mismatched scalar components.
|
| The output has the same :attr:`~pyvista.ImageData.origin` and
| :attr:`~pyvista.ImageData.spacing` as the first input. The origin and spacing of all other
| inputs are ignored.
|
| .. versionadded:: 0.47
|
| Parameters
| ----------
| images : ImageData | Sequence[ImageData]
| The input image(s) to concatenate. The default active scalars are used for all images.
|
| axis : int | str, default: 'x'
| Axis along which the images are concatenated:
|
| - ``0`` or ``'x'``: x-axis
| - ``1`` or ``'y'``: y-axis
| - ``2`` or ``'z'``: z-axis
|
| mode : str, default: 'strict'
| Concatenation mode to use. This determines how images are placed in the output. All
| modes operate along the specified ``axis`` except for ``'preserve-extents'``.
| Specify one of:
|
| - ``'strict'``: all images must have identical dimensions except along the specified
| ``axis``.
| - ``'resample-off-axis'``: :meth:`resample` off-axis dimensions of concatenated images
| to match the input. The on-axis dimension is `not` resampled.
| - ``'resample-match'``: :meth:`resample` all dimensions of concatenated images
| to match the input dimensions exactly. This is similar to ``'resample-off-axis'``,
| except the on-axis dimension is `also` resampled.
| - ``'resample-proportional'``: :meth:`resample` concatenated images proportionally to
| preserve their aspect ratio(s).
| - ``'crop-off-axis'``: :meth:`crop` off-axis dimensions of concatenated images
| to match the input. The on-axis dimension is `not` cropped.
| - ``'crop-match'``: Use :meth:`crop` to center-crop concatenated images such that
| their dimensions match the input dimensions exactly. This is similar to
| ``'crop-off-axis'``, except the on-axis dimension is `also` cropped.
| - ``'preserve-extents'``: the extents of all images are preserved and used to place the
| images in the output. The whole extent of the output is the union of the input whole
| extents. The origin and spacing is taken from the first input. ``axis`` is not used
| by this mode.
|
| .. note::
| Images may be padded with ``background_value`` in some cases when there are
| mismatched dimensions.
|
| dtype_policy : 'strict' | 'promote' | 'match', default: 'strict'
| - ``'strict'``: Do not cast any scalar array dtypes. All images being concatenated must
| have the same dtype, else a ``TypeError`` is raised.
| - ``'promote'``: Use :func:`numpy.result_type` to compute the dtype of the output
| image scalars. This option safely casts all input arrays to a common dtype before
| concatenating.
| - ``'match'``: Cast all array dtypes to match the input's dtype. This casting is
| unsafe as it may downcast values and lose precision.
|
| component_policy : 'strict' | 'promote_rgba', default: 'strict'
| - ``'strict'``: Do not modify the number of components of any scalars. All images being
| concatenated must have the same number of components, else a ``ValueError`` is
| raised.
| - ``'promote_rgba'``: Increase the number of components if necessary. Grayscale scalars
| with one component may be promoted to RGB scalars by duplicating values,
| and RGB scalars may be promoted to RGBA scalars by including an opacity component.
| For integer dtypes, the opacity is set to the max int representable by the dtype;
| for floats it is set to ``1.0``.
|
| background_value : float | VectorLike[float], default: 0
| Value or multi-component vector to use as background. The output may be padded with
| this value for some ``modes`` when there are mismatched dimensions.
|
| resample_kwargs : dict, optional
| Keyword arguments passed to :meth:`resample` when using ``'resample-off-axis'`` or
| ``'resample-proportional'`` modes. Specify ``interpolation``, ``border_mode`` or
| ``anti_aliasing`` options.
|
| Returns
| -------
| ImageData
| The concatenated image.
|
| Examples
| --------
| .. pyvista-plot::
| :force_static:
|
| Load a 2D image: :func:`~pyvista.examples.downloads.download_beach`.
|
| >>> import pyvista as pv
| >>> from pyvista import examples
| >>> beach = examples.download_beach()
|
| Use :meth:`select_values` to make a second version with white values converted to black
| to distinguish it from the original.
|
| >>> white = [255, 255, 255]
| >>> black = [0, 0, 0]
| >>> beach_black = beach.select_values(white, fill_value=black, invert=True)
|
| Concatenate them along the x-axis.
|
| >>> concatenated = beach.concatenate(beach_black, axis='x')
| >>> plot_kwargs = dict(
| ... rgb=True,
| ... lighting=False,
| ... cpos='xy',
| ... zoom='tight',
| ... show_axes=False,
| ... show_scalar_bar=False,
| ... )
| >>> concatenated.plot(**plot_kwargs)
|
| Concatenate them along the y-axis.
|
| >>> concatenated = beach.concatenate(beach_black, axis='y')
| >>> concatenated.plot(**plot_kwargs)
|
| By default, concatenation requires that all off-axis dimensions match the input. Use
| the ``mode`` keyword to enable concatenation with mismatched dimensions.
|
| Load a second 2D image with different dimensions:
| :func:`~pyvista.examples.downloads.download_bird`.
|
| >>> bird = examples.download_bird()
| >>> bird.dimensions
| (458, 342, 1)
| >>> beach.dimensions
| (100, 100, 1)
|
| Concatenate using ``'resample-proportional'`` mode to preserve the aspect ratio of the
| concatenated image. Linear interpolation with antialiasing is used to avoid sampling
| artifacts.
|
| >>> resample_kwargs = {'interpolation': 'linear', 'anti_aliasing': True}
| >>> concatenated = beach.concatenate(
| ... bird, mode='resample-proportional', resample_kwargs=resample_kwargs
| ... )
| >>> concatenated.dimensions
| (233, 100, 1)
| >>> concatenated.plot(**plot_kwargs)
|
| Use ``'resample-proportional'`` again but concontenate along the z-axis instead. The
| ``bird``'s aspect ratio is preserved and padded with zeros so that it can be stacked
| on top of ``beach``.
|
| >>> concatenated = beach.concatenate(
| ... bird,
| ... axis='z',
| ... mode='resample-proportional',
| ... resample_kwargs=resample_kwargs,
| ... )
| >>> concatenated.dimensions
| (100, 100, 2)
| >>> concatenated.plot(**plot_kwargs)
|
| Use ``'resample-off-axis'`` to only resample off-axis dimensions. This option may
| distort the image.
|
| >>> concatenated = beach.concatenate(
| ... bird, mode='resample-off-axis', resample_kwargs=resample_kwargs
| ... )
| >>> concatenated.dimensions
| (558, 100, 1)
| >>> concatenated.plot(**plot_kwargs)
|
| Use ``'resample-match'`` to resample all dimensions to match the input exactly. This
| option may also distort the image.
|
| >>> concatenated = beach.concatenate(
| ... bird, mode='resample-match', resample_kwargs=resample_kwargs
| ... )
| >>> concatenated.dimensions
| (200, 100, 1)
| >>> concatenated.plot(**plot_kwargs)
|
| Use the ``'preserve-extents'`` mode. Using this mode naively may not produce the
| desired result, e.g. if we concatenate ``beach`` with ``bird``, the ``beach`` image is
| completely overwritten since their :attr:`~pyvista.ImageData.extent` fully overlap.
|
| >>> beach.extent
| (0, 99, 0, 99, 0, 0)
| >>> bird.extent
| (0, 457, 0, 341, 0, 0)
|
| >>> concatenated = beach.concatenate(bird, mode='preserve-extents')
| >>> concatenated.extent
| (0, 457, 0, 341, 0, 0)
| >>> concatenated.plot(**plot_kwargs)
|
| Set the ``beach`` :attr:`~pyvista.ImageData.offset` so that there is only partial
| overlap instead.
|
| >>> beach.offset = (-50, -50, 0)
| >>> beach.extent
| (-50, 49, -50, 49, 0, 0)
|
| >>> concatenated = beach.concatenate(bird, mode='preserve-extents')
| >>> concatenated.extent
| (-50, 457, -50, 341, 0, 0)
| >>> concatenated.plot(**plot_kwargs)
|
| Reverse the concatenation order, and use a green background value.
|
| >>> green = pv.Color('green').int_rgb
| >>> concatenated = bird.concatenate(
| ... beach, mode='preserve-extents', background_value=green
| ... )
| >>> concatenated.extent
| (-50, 457, -50, 341, 0, 0)
| >>> concatenated.plot(**plot_kwargs)
|
| Use ``'crop-off-axis'`` to only crop off-axis dimensions.
|
| >>> concatenated = beach.concatenate(bird, mode='crop-off-axis')
| >>> concatenated.dimensions
| (558, 100, 1)
| >>> concatenated.plot(**plot_kwargs)
|
| Reverse the concatenation order.
|
| >>> concatenated = bird.concatenate(beach, mode='crop-off-axis')
| >>> concatenated.dimensions
| (558, 342, 1)
| >>> concatenated.plot(**plot_kwargs)
|
| Use ``'crop-match'`` to center-crop the images to match the input's
| dimensions.
|
| >>> concatenated = beach.concatenate(bird, mode='crop-match')
| >>> concatenated.dimensions
| (200, 100, 1)
| >>> concatenated.plot(**plot_kwargs)
|
| Reverse the concatenation order, and use a grey background value.
|
| >>> concatenated = bird.concatenate(
| ... beach, mode='crop-match', background_value=128
| ... )
| >>> concatenated.dimensions
| (558, 342, 1)
| >>> concatenated.plot(**plot_kwargs)
|
| Load a binary image: :func:`~pyvista.examples.downloads.download_yinyang()`.
|
| >>> yinyang = examples.download_yinyang()
|
| Use ``component_policy`` to concatenate grayscale images with RGB(A) images.
|
| >>> concatenated = yinyang.concatenate(
| ... beach, mode='resample-proportional', component_policy='promote_rgba'
| ... )
| >>> concatenated.plot(**plot_kwargs)
|
| The grayscale portion of the image is promoted to RGB in this case and the entire
| image has 3 components:
|
| >>> concatenated.active_scalars.shape
| (292068, 3)
|
| contour_labeled(self, n_labels: 'int | None' = None, smoothing: 'bool' = False, smoothing_num_iterations: 'int' = 50, smoothing_relaxation_factor: 'float' = 0.5, smoothing_constraint_distance: 'float' = 1, output_mesh_type: "Literal['quads', 'triangles']" = 'quads', output_style: "Literal['default', 'boundary']" = 'default', scalars: 'str | None' = None, progress_bar: 'bool' = False) -> 'pv.PolyData'
| Generate labeled contours from 3D label maps.
|
| SurfaceNets algorithm is used to extract contours preserving sharp
| boundaries for the selected labels from the label maps.
| Optionally, the boundaries can be smoothened to reduce the staircase
| appearance in case of low resolution input label maps.
|
| This filter requires that the :class:`ImageData` has integer point
| scalars, such as multi-label maps generated from image segmentation.
|
| .. note::
| Requires ``vtk>=9.3.0``.
|
| .. deprecated:: 0.45
| This filter produces unexpected results and is deprecated.
| Use :meth:`~pyvista.ImageDataFilters.contour_labels` instead.
| See https://github.com/pyvista/pyvista/issues/5981 for details.
|
| To replicate the default behavior from this filter, call `contour_labels`
| with the following arguments:
|
| .. code-block:: python
|
| image.contour_labels(
| boundary_style='strict_external', # old filter strictly uses external polygons
| smoothing=False, # old filter does not apply smoothing
| output_mesh_type='quads', # old filter generates quads
| pad_background=False, # old filter generates open surfaces at input edges
| orient_faces=False, # old filter does not orient faces
| simplify_output=False, # old filter returns multi-component scalars
| )
|
| Parameters
| ----------
| n_labels : int, optional
| Number of labels to be extracted (all are extracted if None is given).
|
| smoothing : bool, default: False
| Apply smoothing to the meshes.
|
| smoothing_num_iterations : int, default: 50
| Number of smoothing iterations.
|
| smoothing_relaxation_factor : float, default: 0.5
| Relaxation factor of the smoothing.
|
| smoothing_constraint_distance : float, default: 1
| Constraint distance of the smoothing.
|
| output_mesh_type : str, default: 'quads'
| Type of the output mesh. Must be either ``'quads'``, or ``'triangles'``.
|
| output_style : str, default: 'default'
| Style of the output mesh. Must be either ``'default'`` or ``'boundary'``.
| When ``'default'`` is specified, the filter produces a mesh with both
| interior and exterior polygons. When ``'boundary'`` is selected, only
| polygons on the border with the background are produced (without interior
| polygons). Note that style ``'selected'`` is currently not implemented.
|
| scalars : str, optional
| Name of scalars to process. Defaults to currently active scalars.
|
| progress_bar : bool, default: False
| Display a progress bar to indicate progress.
|
| Returns
| -------
| pyvista.PolyData
| :class:`pyvista.PolyData` Labeled mesh with the segments labeled.
|
| References
| ----------
| Sarah F. Frisken, SurfaceNets for Multi-Label Segmentations with Preservation
| of Sharp Boundaries, Journal of Computer Graphics Techniques (JCGT), vol. 11,
| no. 1, 34-54, 2022. Available online http://jcgt.org/published/0011/01/03/
|
| https://www.kitware.com/really-fast-isocontouring/
|
| Examples
| --------
| See :ref:`contouring_example` for a full example using this filter.
|
| See Also
| --------
| pyvista.DataSetFilters.contour
| Generalized contouring method which uses MarchingCubes or FlyingEdges.
|
| pyvista.DataSetFilters.pack_labels
| Function used internally by SurfaceNets to generate contiguous label data.
|
| contour_labels(self: 'ImageData', boundary_style: "Literal['external', 'internal', 'all', 'strict_external']" = 'external', *, background_value: 'int' = 0, select_inputs: 'int | VectorLike[int] | None' = None, select_outputs: 'int | VectorLike[int] | None' = None, pad_background: 'bool' = True, output_mesh_type: "Literal['quads', 'triangles'] | None" = None, scalars: 'str | None' = None, orient_faces: 'bool | None' = None, simplify_output: 'bool | None' = None, smoothing: 'bool' = True, smoothing_iterations: 'int' = 16, smoothing_relaxation: 'float' = 0.5, smoothing_distance: 'float | None' = None, smoothing_scale: 'float' = 1.0, progress_bar: 'bool' = False) -> 'PolyData'
| Generate surface contours from 3D image label maps.
|
| This filter uses :vtk:`vtkSurfaceNets3D`
| to extract polygonal surface contours from non-continuous label maps, which
| corresponds to discrete regions in an input 3D image (i.e., volume). It is
| designed to generate surfaces from image point data, e.g. voxel point
| samples from 3D medical images, though images with cell data are also supported.
|
| The generated surface is smoothed using a constrained smoothing filter, which
| may be fine-tuned to control the smoothing process. Optionally, smoothing may
| be disabled to generate a staircase-like surface.
|
| The output surface includes a two-component cell data array ``'boundary_labels'``.
| The array indicates the labels/regions on either side of the polygons composing
| the output. The array's values are structured as follows:
|
| External boundary values
|
| Polygons between a foreground region and the background have the
| form ``[foreground, background]``.
|
| E.g. ``[1, 0]`` for the boundary between region ``1`` and background ``0``.
|
| Internal boundary values
|
| Polygons between two connected foreground regions are sorted in ascending order.
|
| E.g. ``[1, 2]`` for the boundary between regions ``1`` and ``2``.
|
| By default, this filter returns ``'external'`` contours only. Optionally,
| only the ``'internal'`` contours or ``'all'`` contours (i.e. internal and
| external) may be returned.
|
| .. note::
|
| This filter requires VTK version ``9.3.0`` or greater.
|
| .. versionadded:: 0.45
|
| Parameters
| ----------
| boundary_style : 'external' | 'internal' | 'all' | 'strict_external', default: 'external'
| Style of boundary polygons to generate. ``'internal'`` polygons are generated
| between two connected foreground regions. ``'external'`` polygons are
| generated between foreground and background regions. ``'all'`` includes
| both internal and external boundary polygons.
|
| These styles are generated such that ``internal + external = all``.
| Internally, the filter computes all boundary polygons by default and
| then removes any undesired polygons in post-processing.
| This improves the quality of the output, but can negatively affect the
| filter's performance since all boundaries are always initially computed.
|
| The ``'strict_external'`` style can be used as a fast alternative to
| ``'external'``. This style `strictly` generates external polygons and does
| not compute or consider internal boundaries. This computation is fast, but
| also results in jagged, non-smooth boundaries between regions. The
| ``select_inputs`` and ``select_outputs`` options cannot be used with this
| style.
|
| background_value : int, default: 0
| Background value of the input image. All other values are considered
| as foreground.
|
| select_inputs : int | VectorLike[int], default: None
| Specify label ids to include as inputs to the filter. Labels that are not
| selected are removed from the input *before* generating the surface. By
| default, all label ids are used.
|
| Since the smoothing operation occurs across selected input regions, using
| this option to filter the input can result in smoother and more visually
| pleasing surfaces since non-selected inputs are not considered during
| smoothing. However, this also means that the generated surface will change
| shape depending on which inputs are selected.
|
| .. note::
|
| Selecting inputs can affect whether a boundary polygon is considered to
| be ``internal`` or ``external``. That is, an internal boundary becomes an
| external boundary when only one of the two foreground regions on the
| boundary is selected.
|
| select_outputs : int | VectorLike[int], default: None
| Specify label ids to include in the output of the filter. Labels that are
| not selected are removed from the output *after* generating the surface. By
| default, all label ids are used.
|
| Since the smoothing operation occurs across all input regions, using this
| option to filter the output means that the selected output regions will have
| the same shape (i.e. smoothed in the same manner), regardless of the outputs
| that are selected. This is useful for generating a surface for specific
| labels while also preserving sharp boundaries with non-selected outputs.
|
| .. note::
|
| Selecting outputs does not affect whether a boundary polygon is
| considered to be ``internal`` or ``external``. That is, an internal
| boundary remains internal even if only one of the two foreground regions
| on the boundary is selected.
|
| pad_background : bool, default: True
| :meth:`Pad <pyvista.ImageDataFilters.pad_image>` the image
| with ``background_value`` prior to contouring. This will
| generate polygons to "close" the surface at the boundaries of the image.
| This option is only relevant when there are foreground regions on the border
| of the image. Setting this value to ``False`` is useful if processing multiple
| volumes separately so that the generated surfaces fit together without
| creating surface overlap.
|
| output_mesh_type : str, default: None
| Type of the output mesh. Can be either ``'quads'``, or ``'triangles'``. By
| default, the output mesh has :attr:`~pyvista.CellType.TRIANGLE` cells when
| ``smoothing`` is enabled and :attr:`~pyvista.CellType.QUAD` cells (quads)
| otherwise. The mesh type can be forced to be triangles or quads; however,
| if smoothing is enabled and the type is ``'quads'``, the generated quads
| may not be planar.
|
| scalars : str, optional
| Name of scalars to process. Defaults to currently active scalars. If cell
| scalars are specified, the input image is first re-meshed with
| :meth:`~pyvista.ImageDataFilters.cells_to_points` to transform the cell
| data into point data.
|
| orient_faces : bool, optional
| .. deprecated:: 0.47
|
| This keyword should not be used and will be removed in a future version. It was
| meant to address a vtk bug where the faces generated by :vtk:`vtkSurfaceNets3D`
| have incorrect orientation. This bug is fixed in VTK 9.6, and therefore the faces
| now always have correct orientation by default.
|
| Orient the faces of the generated contours so that they have consistent
| ordering and face outward. If ``False``, the generated polygons may have
| inconsistent ordering and orientation, which can negatively impact
| downstream calculations and the shading used for rendering.
|
| .. note::
|
| Orienting the faces can be computationally expensive for large meshes.
| Consider disabling this option to improve this filter's performance.
|
| .. warning::
|
| Enabling this option is `likely` to generate surfaces with normals
| pointing outward when ``pad_background`` is ``True`` and
| ``boundary_style`` is ``'external'`` (the default). However, this is
| not guaranteed if the generated surface is not closed or if internal
| boundaries are generated. Do not assume the normals will point outward
| in all cases.
|
| simplify_output : bool, optional
| Simplify the ``'boundary_labels'`` array as a single-component 1D array.
| If ``False``, the returned ``'boundary_labels'`` array is a two-component
| 2D array. This simplification is useful when only external boundaries
| are generated and/or when visualizing internal boundaries. The
| simplification is as follows:
|
| - External boundaries are simplified by keeping the first component and
| removing the second. Since external polygons may only share a boundary
| with the background, the second component is always ``background_value``
| and therefore can be dropped without loss of information. The values
| of external boundaries always match the foreground values of the input.
|
| - Internal boundaries are simplified by assigning them unique negative
| values sequentially. E.g. the boundary label ``[1, 2]`` is replaced with
| ``-1``, ``[1, 3]`` is replaced with ``-2``, etc. The mapping to negative
| values is not fixed, and can change depending on the input.
|
| This simplification is particularly useful for unsigned integer labels
| (e.g. scalars with ``'uint8'`` dtype) since external boundaries
| will be positive and internal boundaries will be negative in this case.
|
| By default, the output is simplified when ``boundary_type`` is
| ``'external'`` or ``'strict_external'``, and is not simplified otherwise.
|
| smoothing : bool, default: True
| Smooth the generated surface using a constrained smoothing filter. Each
| point in the surface is smoothed as follows:
|
| For a point ``pi`` connected to a list of points ``pj`` via an edge, ``pi``
| is moved towards the average position of ``pj`` multiplied by the
| ``smoothing_relaxation`` factor, and limited by the ``smoothing_distance``
| constraint. This process is repeated either until convergence occurs, or
| the maximum number of ``smoothing_iterations`` is reached.
|
| smoothing_iterations : int, default: 16
| Maximum number of smoothing iterations to use.
|
| smoothing_relaxation : float, default: 0.5
| Relaxation factor used at each smoothing iteration.
|
| smoothing_distance : float, default: None
| Maximum distance each point is allowed to move (in any direction) during
| smoothing. This distance may be scaled with ``smoothing_scale``. By default,
| the distance is computed dynamically from the image spacing as:
|
| ``distance = norm(image_spacing) * smoothing_scale``.
|
| smoothing_scale : float, default: 1.0
| Relative scaling factor applied to ``smoothing_distance``. See that
| parameter for details.
|
| progress_bar : bool, default: False
| Display a progress bar to indicate progress.
|
| Returns
| -------
| pyvista.PolyData
| Surface mesh of labeled regions.
|
| See Also
| --------
| :meth:`~pyvista.DataSetFilters.voxelize_binary_mask`
| Filter that generates binary labeled :class:`~pyvista.ImageData` from
| :class:`~pyvista.PolyData` surface contours. Can beloosely considered as
| an inverse of this filter.
|
| :meth:`~pyvista.ImageDataFilters.cells_to_points`
| Re-mesh :class:`~pyvista.ImageData` to a points-based representation.
|
| :meth:`~pyvista.DataSetFilters.extract_values`
| Threshold-like filter which can used to process the multi-component
| scalars generated by this filter.
|
| :meth:`~pyvista.DataSetFilters.contour`
| Generalized contouring method which uses MarchingCubes or FlyingEdges.
|
| :meth:`~pyvista.DataSetFilters.pack_labels`
| Function used internally by SurfaceNets to generate contiguous label data.
|
| :meth:`~pyvista.DataSetFilters.color_labels`
| Color labeled data, e.g. labeled volumes or contours.
|
| :ref:`contouring_example`, :ref:`anatomical_groups_example`
| Additional examples using this filter.
|
| References
| ----------
| S. Frisken, SurfaceNets for Multi-Label Segmentations with Preservation of
| Sharp Boundaries, J. Computer Graphics Techniques, 2022. Available online:
| http://jcgt.org/published/0011/01/03/
|
| W. Schroeder, S. Tsalikis, M. Halle, S. Frisken. A High-Performance SurfaceNets
| Discrete Isocontouring Algorithm. arXiv:2401.14906. 2024. Available online:
| `http://arxiv.org/abs/2401.14906 <http://arxiv.org/abs/2401.14906>`__
|
| Examples
| --------
| Load labeled image data with a background region ``0`` and four foreground
| regions.
|
| >>> import pyvista as pv
| >>> import numpy as np
| >>> from pyvista import examples
| >>> image = examples.load_channels()
| >>> label_ids = np.unique(image.active_scalars)
| >>> label_ids
| pyvista_ndarray([0, 1, 2, 3, 4])
| >>> image.dimensions
| (251, 251, 101)
|
| Crop the image to simplify the data.
|
| >>> image = image.extract_subset(voi=(75, 109, 75, 109, 85, 100))
| >>> image.dimensions
| (35, 35, 16)
|
| Plot the cropped image for context. Use :meth:`~pyvista.DataSetFilters.color_labels`
| to generate consistent coloring of the regions for all plots. Negative indexing
| is used for plotting internal boundaries.
|
| >>> def labels_plotter(mesh, zoom=None):
| ... colored_mesh = mesh.color_labels(negative_indexing=True)
| ... pl = pv.Plotter()
| ... pl.add_mesh(colored_mesh, show_edges=True)
| ... if zoom:
| ... pl.camera.zoom(zoom)
| ... return pl
| >>>
| >>> labels_plotter(image).show()
|
| Generate surface contours of the foreground regions and plot it. Note that
| the ``background_value`` is ``0`` by default.
|
| >>> contours = image.contour_labels()
| >>> labels_plotter(contours, zoom=1.5).show()
|
| By default, only external boundary polygons are generated and the returned
| ``'boundary_labels'`` array is a single-component array. The output values
| match the input label values.
|
| >>> contours['boundary_labels'].ndim
| 1
| >>> np.unique(contours['boundary_labels'])
| pyvista_ndarray([1, 2, 3, 4])
|
| Set ``simplify_output`` to ``False`` to generate a two-component
| array instead showing the two boundary regions associated with each polygon.
|
| >>> contours = image.contour_labels(simplify_output=False)
| >>> contours['boundary_labels'].ndim
| 2
|
| Show the unique values. Since only ``'external'`` boundaries are generated
| by default, the second component is always ``0`` (i.e. the ``background_value``).
| Note that all four foreground regions share a boundary with the background.
|
| >>> np.unique(contours['boundary_labels'], axis=0)
| array([[1, 0],
| [2, 0],
| [3, 0],
| [4, 0]])
|
| Repeat the example but this time generate internal contours only. The generated
| array is 2D by default.
|
| >>> contours = image.contour_labels('internal')
| >>> contours['boundary_labels'].ndim
| 2
|
| Show the unique two-component boundary labels again. From these values we can
| determine that all foreground regions share an internal boundary with each
| other `except` for regions ``1`` and ``3`` since the boundary value ``[1, 3]``
| is missing.
|
| >>> np.unique(contours['boundary_labels'], axis=0)
| array([[1, 2],
| [1, 4],
| [2, 3],
| [2, 4],
| [3, 4]])
|
| Simplify the output so that each internal multi-component boundary value is
| assigned a unique negative integer value instead. This makes it easier to
| visualize the result with :meth:`~pyvista.DataSetFilters.color_labels` using
| the ``negative_indexing`` option.
|
| >>> contours = image.contour_labels('internal', simplify_output=True)
| >>> contours['boundary_labels'].ndim
| 1
| >>> np.unique(contours['boundary_labels'])
| pyvista_ndarray([-5, -4, -3, -2, -1])
|
| >>> labels_plotter(contours, zoom=1.5).show()
|
| Generate contours for all boundaries, and use ``select_outputs`` to filter
| the output to only include polygons which share a boundary with region ``3``.
|
| >>> region_3 = image.contour_labels(
| ... 'all', select_outputs=3, simplify_output=True
| ... )
| >>> labels_plotter(region_3, zoom=3).show()
|
| Note how using ``select_outputs`` preserves the sharp features and boundary
| labels for non-selected regions. If desired, use ``select_inputs`` instead to
| completely "ignore" non-selected regions.
|
| >>> region_3 = image.contour_labels(select_inputs=3)
| >>> labels_plotter(region_3, zoom=3).show()
|
| The sharp features are now smoothed and the internal boundaries are now labeled
| as external boundaries. Note that using ``'all'`` here is optional since
| using ``select_inputs`` converts previously-internal boundaries into external
| ones.
|
| Do not pad the image with background values before contouring. Since the input image
| has foreground regions visible at the edges of the image (e.g. the ``+Z`` bound),
| setting ``pad_background=False`` in this example causes the top and sides of
| the mesh to be "open".
|
| >>> surf = image.contour_labels(pad_background=False)
| >>> labels_plotter(surf, zoom=1.5).show()
|
| Disable smoothing to generate staircase-like surface. Without smoothing, the
| surface has quadrilateral cells by default.
|
| >>> surf = image.contour_labels(smoothing=False)
| >>> labels_plotter(surf, zoom=1.5).show()
|
| Keep smoothing enabled but reduce the smoothing scale. A smoothing scale
| less than one may help preserve sharp features (e.g. corners).
|
| >>> surf = image.contour_labels(smoothing_scale=0.5)
| >>> labels_plotter(surf, zoom=1.5).show()
|
| Use the ``'strict_external'`` style to compute external contours quickly. Note
| that this produces jagged and non-smooth boundaries between regions, which may
| not be desirable. Also note how the top of the surface is perfectly flat compared
| to the default ``'external'`` style (see first example above) since the strict
| style ignores the smoothing effects of all internal boundaries.
|
| >>> surf = image.contour_labels('strict_external')
| >>> labels_plotter(surf, zoom=1.5).show()
|
| crop(self: 'ImageData', *, factor: 'float | VectorLike[float] | None' = None, margin: 'int | VectorLike[int] | None' = None, offset: 'VectorLike[int] | None' = None, dimensions: 'VectorLike[int] | None' = None, extent: 'VectorLike[int] | None' = None, normalized_bounds: 'VectorLike[float] | None' = None, mask: 'str | ImageData | NumpyArray[float] | Literal[True] | None' = None, padding: 'int | VectorLike[int] | None' = None, background_value: 'float | None' = None, keep_dimensions: 'bool' = False, fill_value: 'float | VectorLike[float] | None' = None, rebase_coordinates: 'bool' = False, progress_bar: 'bool' = False) -> 'ImageData'
| Crop this image to remove points at its boundaries.
|
| This filter is useful for extracting a volume or region of interest. There are several ways
| to crop:
|
| #. Use ``factor`` to crop a portion of the image symmetrically.
| #. Use ``margin`` to remove points from the image border.
| #. Use ``dimensions`` (and optionally, ``offset``) to explicitly crop to the specified
| :attr:`~pyvista.ImageData.dimensions` and :attr:`~pyvista.ImageData.offset`.
| #. Use ``extent`` to explicitly crop to a specified :attr:`~pyvista.ImageData.extent`.
| #. Use ``normalized_bounds`` to crop a bounding box relative to the input size.
| #. Use ``mask``, ``padding``, and ``background_value`` to crop to this mesh using scalar
| values to define the cropping region.
|
| These methods are all independent, e.g. it is not possible to specify both ``factor`` and
| ``margin``.
|
| By default, the cropped output's :attr:`~pyvista.ImageData.dimensions` are typically less
| than the input's dimensions. Optionally, use ``keep_dimensions`` and ``fill_value`` to
| ensure the output dimensions always match the input.
|
| .. note::
|
| All cropping is performed using the image's ijk-indices, not physical xyz-bounds.
|
| .. versionadded:: 0.46
|
| Parameters
| ----------
| factor : float, optional
| Cropping factor in range ``[0.0, 1.0]`` which specifies the proportion of the image to
| keep along each axis. Use a single float for uniform cropping or a vector of three
| floats for cropping each xyz-axis independently. The crop is centered in the image.
|
| margin : int | VectorLike[int], optional
| Margin to remove from each side of each axis. Specify:
|
| - A single value to remove from all boundaries equally.
| - Two values, one for each ``(X, Y)`` axis, to remove margin from
| each axis independently.
| - Three values, one for each ``(X, Y, Z)`` axis, to remove margin from
| each axis independently.
| - Four values, one for each ``(-X, +X, -Y, +Y)`` boundary, to remove
| margin from each boundary independently.
| - Six values, one for each ``(-X, +X, -Y, +Y, -Z, +Z)`` boundary, to remove
| margin from each boundary independently.
|
| offset : VectorLike[int], optional
| Length-3 vector of integers specifying the :attr:`~pyvista.ImageData.offset` indices
| where the cropping region originates. If specified, then ``dimensions`` must also be
| provided.
|
| dimensions : VectorLike[int], optional
| Length-3 vector of integers specifying the :attr:`~pyvista.ImageData.dimensions` of
| the cropping region. ``offset`` may also be provided, but if it is not, the crop is
| centered in the image.
|
| extent : VectorLike[int], optional
| Length-6 vector of integers specifying the full :attr:`~pyvista.ImageData.extent` of
| the cropping region.
|
| normalized_bounds : VectorLike[float], optional
| Normalized bounds relative to the input. These are floats between ``0.0`` and ``1.0``
| that define a box relative to the input size. The input is cropped such that it fully
| fits within these bounds. Has the form ``(x_min, x_max, y_min, y_max, z_min, z_max)``.
|
| mask : str | ImageData | NumpyArray[float] | bool, optional
| Scalar values that define the cropping region. Set this option to:
|
| - a string denoting the name of scalars belonging to this mesh
| - ``True`` to use this mesh's default scalars
| - a separate image, in which case the other image's active scalars are used
| - a 1D or 2D (multi-component) array
|
| The length of the scalar array must equal the number of points.
|
| This mesh will be cropped to the bounds of the foreground values of the array, i.e.
| values that are not equal to the specified ``background_value``.
|
| padding : int | VectorLike[int], optional
| Padding to add to foreground region `before` cropping. Only valid when using a mask to
| crop the image. Specify:
|
| - A single value to pad all boundaries equally.
| - Two values, one for each ``(X, Y)`` axis, to apply symmetric padding to
| each axis independently.
| - Three values, one for each ``(X, Y, Z)`` axis, to apply symmetric padding
| to each axis independently.
| - Four values, one for each ``(-X, +X, -Y, +Y)`` boundary, to apply
| padding to each boundary independently.
| - Six values, one for each ``(-X, +X, -Y, +Y, -Z, +Z)`` boundary, to apply
| padding to each boundary independently.
|
| The specified value is the `maximum` padding that may be applied. If the padding
| extends beyond the actual extents of this mesh, it is clipped and does not extend
| outside the bounds of the image.
|
| background_value : float | VectorLike[float], optional
| Value or multi-component vector considered to be the background. Only valid when using
| a mask to crop the image.
|
| keep_dimensions : bool, default: False
| If ``True``, the cropped output is :meth:`padded <pad_image>` with ``fill_value`` to
| ensure the output dimensions match the input.
|
| fill_value : float | VectorLike[float], optional
| Value used when padding the cropped output if ``keep_dimensions`` is ``True``. May be
| a single float or a multi-component vector (e.g. RGB vector).
|
| rebase_coordinates : bool, default: False
| Rebase the coordinate reference of the cropped output:
|
| - the :attr:`~pyvista.ImageData.origin` is set to the minimum bounds of the subset
| - the :attr:`~pyvista.ImageData.offset` is reset to ``(0, 0, 0)``
|
| The rebasing effectively applies a positive translation in world (XYZ) coordinates and
| a similar (i.e. inverse) negative translation in voxel (IJK) coordinates. As a result,
| the :attr:`~pyvista.DataSet.bounds` of the output are unchanged, but the coordinate
| reference frame is modified.
|
| Set this to ``False`` to leave the origin unmodified and keep the offset used by the
| crop.
|
| progress_bar : bool, default: False
| Display a progress bar to indicate progress.
|
| Returns
| -------
| ImageData
| Cropped image.
|
| See Also
| --------
| pad_image
| Add points to image boundaries. This is the inverse operation of the ``margin`` crop.
|
| resample
| Modify an image's dimensions and spacing.
|
| select_values
| Threshold-like filter which may be used to generate a mask for cropping.
|
| extract_subset
| Equivalent filter to ``crop(extent=voi, rebase_coordinates=True)``.
|
| :ref:`crop_labeled_example`
| Example cropping :class:`~pyvista.ImageData` using a segmentation mask.
|
| Examples
| --------
| Load a grayscale image.
|
| >>> import numpy as np
| >>> import pyvista as pv
| >>> from pyvista import examples
| >>> gray_image = examples.download_yinyang()
| >>> gray_image.dimensions
| (512, 342, 1)
|
| Define a custom plotting helper to show the image as pixel cells.
|
| >>> def image_plotter(image):
| ... pixel_cells = image.points_to_cells()
| ...
| ... pl = pv.Plotter()
| ... pl.add_mesh(
| ... pixel_cells,
| ... cmap='gray',
| ... clim=[0, 255],
| ... lighting=False,
| ... show_scalar_bar=False,
| ... )
| ... pl.view_xy()
| ... pl.camera.tight()
| ... return pl
|
| Plot the image for context.
|
| >>> image_plotter(gray_image).show()
|
| Crop the white border around the image using active scalars as a mask. Here we specify a
| background value of ``255`` to correspond to white pixels. If this was an RGB image, we
| could also specify ``(255, 255, 255)`` as the background value.
|
| >>> cropped = gray_image.crop(mask=True, background_value=255)
| >>> cropped.dimensions
| (237, 238, 1)
| >>> image_plotter(cropped).show()
|
| Use ``margin`` instead to remove 100 and 20 pixels from each side of the x- and y-axis,
| respectively.
|
| >>> cropped = gray_image.crop(margin=(100, 20))
| >>> cropped.dimensions
| (312, 302, 1)
| >>> image_plotter(cropped).show()
|
| Use ``offset`` to select a starting location for the crop (from the origin at the
| bottom-left corner) along with ``dimensions`` to define the crop size.
|
| >>> cropped = gray_image.crop(offset=(50, 20, 0), dimensions=(300, 200, 1))
| >>> cropped.dimensions
| (300, 200, 1)
| >>> image_plotter(cropped).show()
|
| Use ``extent`` directly instead of using ``dimensions`` and ``offset`` to yield the same
| result as above.
|
| >>> cropped = gray_image.crop(extent=(50, 349, 20, 219, 0, 0))
| >>> cropped.extent
| (50, 349, 20, 219, 0, 0)
| >>> image_plotter(cropped).show()
|
| Use ``factor`` to crop 40% of the image. This `keeps` 40% of the pixels along each axis,
| and `removes` 60% (i.e. 30% from each side).
|
| >>> cropped = gray_image.crop(factor=0.4)
| >>> cropped.dimensions
| (204, 136, 1)
| >>> image_plotter(cropped).show()
|
| Use ``normalized_bounds`` to crop from 40% to 80% of the image along the x-axis, and
| from 30% to 90% of the image along the y-axis.
|
| >>> cropped = gray_image.crop(normalized_bounds=[0.4, 0.8, 0.3, 0.9, 0.0, 1.0])
| >>> cropped.extent
| (205, 408, 103, 306, 0, 0)
| >>> image_plotter(cropped).show()
|
| dilate(self: 'ImageData', kernel_size: 'int | VectorLike[int]' = (3, 3, 3), scalars: 'str | None' = None, *, binary: 'bool | VectorLike[float] | None' = None, progress_bar: 'bool' = False)
| Morphologically dilate grayscale or binary data.
|
| This filter may be used to dilate grayscale images with continuous data, binary images
| with a single background and foreground value, or multi-label images.
|
| For binary inputs with two unique values, this filter uses :vtk:`vtkImageDilateErode3D`
| by default to perform fast binary dilation over an ellipsoidal neighborhood. Otherwise,
| the slower class :vtk:`vtkImageContinuousDilate3D` is used to perform generalized grayscale
| dilation by replacing each pixel with the maximum over an ellipsoidal neighborhood.
|
| Optionally, the ``binary`` keyword may be used to explicitly control the behavior of the
| filter.
|
| .. versionadded:: 0.47
|
| Parameters
| ----------
| kernel_size : int | VectorLike[int], default: (3, 3, 3)
| Determines the size of the kernel along the xyz-axes. Only non-singleton dimensions
| are dilated, e.g. a kernel size of ``(3, 3, 1)`` and ``(3, 3, 3)`` produce the same
| result for 2D images.
|
| scalars : str, optional
| Name of scalars to process. Defaults to currently active scalars.
|
| binary : bool | VectorLike[float], optional
| Control if binary dilation or continuous dilation is used.
|
| If set, :vtk:`vtkImageDilateErode3D` is used to strictly dilate with two values.
| Set this to ``True`` to dilate the maximum value in ``scalars`` with its minimum value,
| or set it to two values ``[background_value, foreground_value]`` to dilate
| ``foreground_value`` with ``background_value`` explicitly.
|
| Set this to ``False`` to use :vtk:`vtkImageContinuousDilate3D` to perform continuous
| dilation.
|
| By default, ``binary`` is ``True`` if the input has two unique values, and ``False``
| otherwise.
|
| .. note::
| - If the input is a binary mask, setting ``binary=True`` produces the same output
| as ``binary=False``, but the filter is much more performant.
| - Setting ``binary=[background_value, foreground_value]`` is useful to `isolate`
| the dilation to two values, e.g. for multi-label segmentation masks.
|
| progress_bar : bool, default: False
| Display a progress bar to indicate progress.
|
| Returns
| -------
| pyvista.ImageData
| Dataset that has been dilated.
|
| See Also
| --------
| erode, open, close
|
| Notes
| -----
| This filter only supports point data. For inputs with cell data, consider
| re-meshing the cell data as point data with
| :meth:`~pyvista.ImageDataFilters.cells_to_points`
| or resampling the cell data to point data with
| :func:`~pyvista.DataObjectFilters.cell_data_to_point_data`.
|
| Examples
| --------
| .. pyvista-plot::
| :force_static:
|
| Create a toy example with two non-zero grayscale foreground values
| :meth:`padded <pad_image>` with a background of zeros.
|
| >>> import pyvista as pv
| >>> im = pv.ImageData(dimensions=(2, 1, 1))
| >>> im['data'] = [128, 255]
| >>> im = im.pad_image(pad_value=0, pad_size=2, dimensionality=2)
|
| Define a custom plotter to plot pixels as cells.
|
| >>> def image_plotter(image):
| ... pl = pv.Plotter()
| ... pl.add_mesh(
| ... image.points_to_cells(),
| ... cmap='grey',
| ... clim=[0, 255],
| ... show_scalar_bar=False,
| ... show_edges=True,
| ... lighting=False,
| ... line_width=3,
| ... )
| ... pl.camera_position = 'xy'
| ... pl.camera.tight()
| ... pl.enable_anti_aliasing()
| ... return pl
|
| Show the image.
|
| >>> image_plotter(im).show()
|
| Dilate it with default settings. Observe that `both` foreground values are dilated.
|
| >>> dilated = im.dilate()
| >>> image_plotter(dilated).show()
|
| Use a larger kernel size.
|
| >>> dilated = im.dilate(kernel_size=5)
| >>> image_plotter(dilated).show()
|
| Use an asymmetric kernel.
|
| >>> dilated = im.dilate(kernel_size=(2, 4, 1))
| >>> image_plotter(dilated).show()
|
| Use binary dilation. By default, the max value (``255`` in this example) is dilated
| with the min value (``0`` in this example). All other values are unaffected.
|
| >>> dilated = im.dilate(binary=True)
| >>> image_plotter(dilated).show()
|
| Equivalently, set the binary values for the dilation explicitly.
|
| >>> dilated = im.dilate(binary=[0, 255])
| >>> image_plotter(dilated).show()
|
| Use binary dilation with the other foreground value instead.
|
| >>> dilated = im.dilate(binary=[0, 128])
| >>> image_plotter(dilated).show()
|
| erode(self: 'ImageData', kernel_size: 'int | VectorLike[int]' = (3, 3, 3), scalars: 'str | None' = None, *, binary: 'bool | VectorLike[float] | None' = None, progress_bar: 'bool' = False)
| Morphologically erode grayscale or binary data.
|
| This filter may be used to erode grayscale images with continuous data, binary images
| with a single background and foreground value, or multi-label images.
|
| For binary inputs with two unique values, this filter uses :vtk:`vtkImageDilateErode3D`
| by default to perform fast binary erosion over an ellipsoidal neighborhood. Otherwise,
| the slower class :vtk:`vtkImageContinuousErode3D` is used to perform generalized grayscale
| erosion by replacing each pixel with the minimum over an ellipsoidal neighborhood.
|
| Optionally, the ``binary`` keyword may be used to explicitly control the behavior of the
| filter.
|
| .. versionadded:: 0.47
|
| Parameters
| ----------
| kernel_size : int | VectorLike[int], default: (3, 3, 3)
| Determines the size of the kernel along the xyz-axes. Only non-singleton dimensions
| are eroded, e.g. a kernel size of ``(3, 3, 1)`` and ``(3, 3, 3)`` produce the same
| result for 2D images.
|
| scalars : str, optional
| Name of scalars to process. Defaults to currently active scalars.
|
| binary : bool | VectorLike[float], optional
| Control if binary erosion or continuous erosion is used.
|
| If set, :vtk:`vtkImageDilateErode3D` is used to strictly erode with two values.
| Set this to ``True`` to erode the maximum value in ``scalars`` with its minimum value,
| or set it to two values ``[background_value, foreground_value]`` to erode
| ``foreground_value`` with ``background_value`` explicitly.
|
| Set this to ``False`` to use :vtk:`vtkImageContinuousErode3D` to perform continuous
| erosion.
|
| By default, ``binary`` is ``True`` if the input has two unique values, and ``False``
| otherwise.
|
| .. note::
| - If the input is a binary mask, setting ``binary=True`` produces the same output
| as ``binary=False``, but the filter is much more performant.
| - Setting ``binary=[background_value, foreground_value]`` is useful to `isolate`
| the erosion to two values, e.g. for multi-label segmentation masks.
|
| progress_bar : bool, default: False
| Display a progress bar to indicate progress.
|
| Returns
| -------
| pyvista.ImageData
| Dataset that has been eroded.
|
| See Also
| --------
| dilate, open, close
|
| Notes
| -----
| This filter only supports point data. For inputs with cell data, consider
| re-meshing the cell data as point data with
| :meth:`~pyvista.ImageDataFilters.cells_to_points`
| or resampling the cell data to point data with
| :func:`~pyvista.DataObjectFilters.cell_data_to_point_data`.
|
| Examples
| --------
| .. pyvista-plot::
| :force_static:
|
| Create a toy example with two non-zero grayscale foreground regions
| using :meth:`pad_image`.
|
| >>> import pyvista as pv
| >>> # Create an initial background point
| >>> im = pv.ImageData(dimensions=(1, 1, 1))
| >>> im['data'] = [0]
| >>> # Add a foreground region
| >>> im = im.pad_image(pad_value=255, pad_size=(4, 3), dimensionality=2)
| >>> # Add a second foreground region
| >>> im = im.pad_image(pad_value=128, pad_size=(2, 0, 1, 0))
| >>> # Add background values to two sides
| >>> im = im.pad_image(pad_value=0, pad_size=(1, 0))
|
| Define a custom plotter to plot pixels as cells.
|
| >>> def image_plotter(image):
| ... pl = pv.Plotter()
| ... pl.add_mesh(
| ... image.points_to_cells(),
| ... cmap='grey',
| ... clim=[0, 255],
| ... show_scalar_bar=False,
| ... show_edges=True,
| ... lighting=False,
| ... line_width=3,
| ... )
| ... pl.camera_position = 'xy'
| ... pl.camera.tight()
| ... pl.enable_anti_aliasing()
| ... return pl
|
| Show the image.
|
| >>> image_plotter(im).show()
|
| Erode it with default settings. Observe that `both` foreground values are eroded.
|
| >>> eroded = im.erode()
| >>> image_plotter(eroded).show()
|
| Use a larger kernel size.
|
| >>> eroded = im.erode(kernel_size=5)
| >>> image_plotter(eroded).show()
|
| Use an asymmetric kernel.
|
| >>> eroded = im.erode(kernel_size=(2, 4, 1))
| >>> image_plotter(eroded).show()
|
| Use binary erosion. By default, the max value (``255`` in this example) is eroded
| with the min value (``0`` in this example). All other values are unaffected.
|
| >>> eroded = im.erode(binary=True)
| >>> image_plotter(eroded).show()
|
| Equivalently, set the binary values for the erosion explicitly.
|
| >>> eroded = im.erode(binary=[0, 255])
| >>> image_plotter(eroded).show()
|
| Use binary erosion with the other foreground value instead.
|
| >>> eroded = im.erode(binary=[0, 128])
| >>> image_plotter(eroded).show()
|
| extract_subset(self, voi, rate=(1, 1, 1), boundary: 'bool' = False, rebase_coordinates: 'bool' = True, progress_bar: 'bool' = False)
| Select piece (e.g., volume of interest).
|
| To use this filter set the VOI ivar which are i-j-k min/max indices
| that specify a rectangular region in the data. (Note that these are
| 0-offset.) You can also specify a sampling rate to subsample the
| data.
|
| Typical applications of this filter are to extract a slice from a
| volume for image processing, subsampling large volumes to reduce data
| size, or extracting regions of a volume with interesting data.
|
| Parameters
| ----------
| voi : sequence[int]
| Length 6 iterable of ints: ``(x_min, x_max, y_min, y_max, z_min, z_max)``.
| These bounds specify the volume of interest in i-j-k min/max
| indices.
|
| rate : sequence[int], default: (1, 1, 1)
| Length 3 iterable of ints: ``(xrate, yrate, zrate)``.
|
| boundary : bool, default: False
| Control whether to enforce that the "boundary" of the grid
| is output in the subsampling process. This only has effect
| when the rate in any direction is not equal to 1. When
| this is enabled, the subsampling will always include the
| boundary of the grid even though the sample rate is not an
| even multiple of the grid dimensions. By default this is
| disabled.
|
| rebase_coordinates : bool, default: True
| If ``True`` (default), reset the coordinate reference of the extracted subset:
|
| - the :attr:`~pyvista.ImageData.origin` is set to the minimum bounds of the subset
| - the :attr:`~pyvista.ImageData.offset` is reset to ``(0, 0, 0)``
|
| The rebasing effectively applies a positive translation in world (XYZ) coordinates and
| a similar (i.e. inverse) negative translation in voxel (IJK) coordinates. As a result,
| the :attr:`~pyvista.DataSet.bounds` of the output are unchanged, but the coordinate
| reference frame is modified.
|
| Set this to ``False`` to leave the origin unmodified and keep the offset specified by
| the ``voi`` parameter.
|
| .. versionadded:: 0.46
|
| progress_bar : bool, default: False
| Display a progress bar to indicate progress.
|
| Returns
| -------
| pyvista.ImageData
| ImageData subset.
|
| See Also
| --------
| slice_index
| crop
|
| fft(self, output_scalars_name=None, progress_bar: 'bool' = False)
| Apply a fast Fourier transform (FFT) to the active scalars.
|
| The input can be real or complex data, but the output is always
| :attr:`numpy.complex128`. The filter is fastest for images that have
| power of two sizes.
|
| The filter uses a butterfly diagram for each prime factor of the
| dimension. This makes images with prime number dimensions (i.e. 17x17)
| much slower to compute. FFTs of multidimensional meshes (i.e volumes)
| are decomposed so that each axis executes serially.
|
| The frequencies of the output assume standard order: along each axis
| first positive frequencies are assumed from 0 to the maximum, then
| negative frequencies are listed from the largest absolute value to
| smallest. This implies that the corners of the grid correspond to low
| frequencies, while the center of the grid corresponds to high
| frequencies.
|
| Parameters
| ----------
| output_scalars_name : str, optional
| The name of the output scalars. By default, this is the same as the
| active scalars of the dataset.
|
| progress_bar : bool, default: False
| Display a progress bar to indicate progress.
|
| Returns
| -------
| pyvista.ImageData
| :class:`pyvista.ImageData` with applied FFT.
|
| See Also
| --------
| rfft : The reverse transform.
| low_pass : Low-pass filtering of FFT output.
| high_pass : High-pass filtering of FFT output.
|
| Examples
| --------
| Apply FFT to an example image.
|
| >>> from pyvista import examples
| >>> image = examples.download_moonlanding_image()
| >>> fft_image = image.fft()
| >>> fft_image.point_data # doctest:+SKIP
| pyvista DataSetAttributes
| Association : POINT
| Active Scalars : PNGImage
| Active Vectors : None
| Active Texture : None
| Active Normals : None
| Contains arrays :
| PNGImage complex128 (298620,) SCALARS
|
| See :ref:`image_fft_example` for a full example using this filter.
|
| gaussian_smooth(self, radius_factor=1.5, std_dev=2.0, scalars=None, progress_bar: 'bool' = False)
| Smooth the data with a Gaussian kernel.
|
| Parameters
| ----------
| radius_factor : float | sequence[float], default: 1.5
| Unitless factor to limit the extent of the kernel.
|
| std_dev : float | sequence[float], default: 2.0
| Standard deviation of the kernel in pixel units.
|
| scalars : str, optional
| Name of scalars to process. Defaults to currently active scalars.
|
| progress_bar : bool, default: False
| Display a progress bar to indicate progress.
|
| Returns
| -------
| pyvista.ImageData
| Uniform grid with smoothed scalars.
|
| Notes
| -----
| This filter only supports point data. For inputs with cell data, consider
| re-meshing the cell data as point data with
| :meth:`~pyvista.ImageDataFilters.cells_to_points`
| or resampling the cell data to point data with
| :func:`~pyvista.DataObjectFilters.cell_data_to_point_data`.
|
| Examples
| --------
| First, create sample data to smooth. Here, we use
| :func:`pyvista.perlin_noise() <pyvista.core.utilities.features.perlin_noise>`
| to create meaningful data.
|
| >>> import numpy as np
| >>> import pyvista as pv
| >>> noise = pv.perlin_noise(0.1, (2, 5, 8), (0, 0, 0))
| >>> grid = pv.sample_function(
| ... noise, bounds=[0, 1, 0, 1, 0, 1], dim=(20, 20, 20)
| ... )
| >>> grid.plot(show_scalar_bar=False)
|
| Next, smooth the sample data.
|
| >>> smoothed = grid.gaussian_smooth()
| >>> smoothed.plot(show_scalar_bar=False)
|
| See :ref:`gaussian_smoothing_example` for a full example using this filter.
|
| high_pass(self, x_cutoff, y_cutoff, z_cutoff, order=1, output_scalars_name=None, progress_bar: 'bool' = False)
| Perform a Butterworth high pass filter in the frequency domain.
|
| This filter requires that the :class:`ImageData` have a complex point
| scalars, usually generated after the :class:`ImageData` has been
| converted to the frequency domain by a :func:`ImageDataFilters.fft`
| filter.
|
| A :func:`ImageDataFilters.rfft` filter can be used to convert the
| output back into the spatial domain. This filter attenuates low
| frequency components. Input and output are complex arrays with
| datatype :attr:`numpy.complex128`.
|
| The frequencies of the input assume standard order: along each axis
| first positive frequencies are assumed from 0 to the maximum, then
| negative frequencies are listed from the largest absolute value to
| smallest. This implies that the corners of the grid correspond to low
| frequencies, while the center of the grid corresponds to high
| frequencies.
|
| Parameters
| ----------
| x_cutoff : float
| The cutoff frequency for the x-axis.
|
| y_cutoff : float
| The cutoff frequency for the y-axis.
|
| z_cutoff : float
| The cutoff frequency for the z-axis.
|
| order : int, default: 1
| The order of the cutoff curve. Given from the equation
| ``1/(1 + (cutoff/freq(i, j))**(2*order))``.
|
| output_scalars_name : str, optional
| The name of the output scalars. By default, this is the same as the
| active scalars of the dataset.
|
| progress_bar : bool, default: False
| Display a progress bar to indicate progress.
|
| Returns
| -------
| pyvista.ImageData
| :class:`pyvista.ImageData` with the applied high pass filter.
|
| See Also
| --------
| fft : Direct fast Fourier transform.
| rfft : Reverse fast Fourier transform.
| low_pass : Low-pass filtering of FFT output.
|
| Examples
| --------
| See :ref:`image_fft_perlin_noise_example` for a full example using this filter.
|
| image_dilate_erode(self, dilate_value=1.0, erode_value=0.0, kernel_size=(3, 3, 3), scalars=None, progress_bar: 'bool' = False)
| Dilates one value and erodes another.
|
| .. deprecated:: 0.47.0
| :meth:`image_dilate_erode` is deprecated. Use :meth:`dilate`, :meth:`erode`,
| :meth:`open`, or :meth:`close` instead.
|
| ``image_dilate_erode`` will dilate one value and erode another. It uses
| an elliptical footprint, and only erodes/dilates on the boundary of the
| two values. The filter is restricted to the X, Y, and Z axes for now.
| It can degenerate to a 2 or 1-dimensional filter by setting the kernel
| size to 1 for a specific axis.
|
| Parameters
| ----------
| dilate_value : float, default: 1.0
| Dilate value in the dataset.
|
| erode_value : float, default: 0.0
| Erode value in the dataset.
|
| kernel_size : sequence[int], default: (3, 3, 3)
| Determines the size of the kernel along the three axes.
|
| scalars : str, optional
| Name of scalars to process. Defaults to currently active scalars.
|
| progress_bar : bool, default: False
| Display a progress bar to indicate progress.
|
| Returns
| -------
| pyvista.ImageData
| Dataset that has been dilated/eroded on the boundary of the specified scalars.
|
| Notes
| -----
| This filter only supports point data. For inputs with cell data, consider
| re-meshing the cell data as point data with
| :meth:`~pyvista.ImageDataFilters.cells_to_points`
| or resampling the cell data to point data with
| :func:`~pyvista.DataObjectFilters.cell_data_to_point_data`.
|
| Examples
| --------
| Demonstrate image dilate/erode on an example dataset. First, plot
| the example dataset with the active scalars.
|
| >>> from pyvista import examples
| >>> uni = examples.load_uniform()
| >>> uni.plot()
|
| Now, plot the image threshold with ``threshold=[400, 600]``. Note how
| values within the threshold are 1 and outside are 0.
|
| >>> ithresh = uni.image_threshold([400, 600])
| >>> ithresh.plot()
|
| Note how there is a hole in the thresholded image. Apply a closing
| filter with a large kernel to fill that hole in.
|
| >>> iclosed = ithresh.close(kernel_size=[5, 5, 5])
| >>> iclosed.plot()
|
| image_threshold(self: 'ImageData', threshold, in_value=1.0, out_value=0.0, scalars=None, preference='point', progress_bar: 'bool' = False)
| Apply a threshold to scalar values in a uniform grid.
|
| If a single value is given for threshold, scalar values above or equal
| to the threshold are ``'in'`` and scalar values below the threshold are ``'out'``.
| If two values are given for threshold (sequence) then values equal to
| or between the two values are ``'in'`` and values outside the range are ``'out'``.
|
| If ``None`` is given for ``in_value``, scalars that are ``'in'`` will not be replaced.
| If ``None`` is given for ``out_value``, scalars that are ``'out'`` will not be replaced.
|
| Warning: applying this filter to cell data will send the output to a
| new point array with the same name, overwriting any existing point data
| array with the same name.
|
| Parameters
| ----------
| threshold : float or sequence[float]
| Single value or (min, max) to be used for the data threshold. If
| a sequence, then length must be 2. Threshold(s) for deciding which
| cells/points are ``'in'`` or ``'out'`` based on scalar data.
|
| in_value : float, default: 1.0
| Scalars that match the threshold criteria for ``'in'`` will be replaced with this.
|
| out_value : float, default: 0.0
| Scalars that match the threshold criteria for ``'out'`` will be replaced with this.
|
| scalars : str, optional
| Name of scalars to process. Defaults to currently active scalars.
|
| preference : str, default: "point"
| When scalars is specified, this is the preferred array
| type to search for in the dataset. Must be either
| ``'point'`` or ``'cell'``.
|
| progress_bar : bool, default: False
| Display a progress bar to indicate progress.
|
| Returns
| -------
| pyvista.ImageData
| Dataset with the specified scalars thresholded.
|
| See Also
| --------
| select_values
| Threshold-like method for keeping some values and replacing others.
| :meth:`~pyvista.DataSetFilters.threshold`
| General threshold method that returns a :class:`~pyvista.UnstructuredGrid`.
|
| Examples
| --------
| Demonstrate image threshold on an example dataset. First, plot
| the example dataset with the active scalars.
|
| >>> from pyvista import examples
| >>> uni = examples.load_uniform()
| >>> uni.plot()
|
| Now, plot the image threshold with ``threshold=100``. Note how
| values above the threshold are 1 and below are 0.
|
| >>> ithresh = uni.image_threshold(100)
| >>> ithresh.plot()
|
| See :ref:`image_representations_example` for more examples using this filter.
|
| label_connectivity(self, *, scalars: 'str | None' = None, scalar_range: "Literal['auto', 'foreground', 'vtk_default'] | VectorLike[float]" = 'auto', extraction_mode: "Literal['all', 'largest', 'seeded']" = 'all', point_seeds: 'MatrixLike[float] | VectorLike[float] | _vtk.vtkDataSet | None' = None, label_mode: "Literal['size', 'constant', 'seeds']" = 'size', constant_value: 'int | None' = None, inplace: 'bool' = False, progress_bar: 'bool' = False) -> 'tuple[ImageData, NDArray[int], NDArray[int]]'
| Find and label connected regions in a :class:`~pyvista.ImageData`.
|
| Only points whose `scalar` value is within the `scalar_range` are considered for
| connectivity. A 4-connectivity is used for 2D images or a 6-connectivity for 3D
| images. This filter operates on point-based data. If cell-based data are provided,
| they are re-meshed to a point-based representation using
| :func:`~pyvista.ImageDataFilters.cells_to_points` and the output is meshed back
| to a cell-based representation with :func:`~pyvista.ImageDataFilters.points_to_cells`,
| effectively filtering based on face connectivity. The connected regions are
| extracted and labelled according to the strategy defined by ``extraction_mode``
| and ``label_mode``, respectively. Unconnected regions are labelled with ``0`` value.
|
| .. versionadded:: 0.45.0
|
| Notes
| -----
| This filter implements :vtk:`vtkImageConnectivityFilter`.
|
| Parameters
| ----------
| scalars : str, optional
| Scalars to use to filter points. If ``None`` is provided, the scalars is
| automatically set, if possible.
|
| scalar_range : str, Literal['auto', 'foreground', 'vtk_default'], VectorLike[float]
| Points whose scalars value is within ``'scalar_range'`` are considered for
| connectivity. The bounds are inclusive.
|
| - ``'auto'``: (default) includes the full data range, similarly to
| :meth:`~pyvista.DataSetFilters.connectivity`.
| - ``'foreground'``: includes the full data range except the smallest value.
| - ``'vtk_default'``: default to [``0.5``, :const:`~vtk.VTK_DOUBLE_MAX`].
| - ``VectorLike[float]``: explicitly set the range.
|
| The bounds are always cast to floats since vtk expects doubles. The scalars
| data are also cast to floats to avoid unexpected behavior arising from implicit
| type conversion. The only exceptions is if both bounds are whole numbers, in
| which case the implicit conversion is safe. It will optimize resources consumption
| if the data are integers.
|
| extraction_mode : Literal['all', 'largest', 'seeded'], default: 'all'
| Determine how the connected regions are extracted. If ``'all'``, all connected
| regions are extracted. If ``'largest'``, only the largest region is extracted.
| If ``'seeded'``, only the regions that include the points defined with
| ``point_seeds`` are extracted.
|
| point_seeds : MatrixLike[float], VectorLike[float], :vtk:`vtkDataSet`, optional
| The point coordinates to use as seeds, specified as a (N, 3) array like or
| as a :vtk:`vtkDataSet`. Has no effect if ``extraction_mode`` is not
| ``'seeded'``.
|
| label_mode : Literal['size', 'constant', 'seeds'], default: 'size'
| Determine how the extracted regions are labelled. If ``'size'``, label regions
| by decreasing size (i.e., count of cells), starting at ``1``. If ``'constant'``,
| label with the provided ``constant_value``. If ``'seeds'``, label according to
| the seed order, starting at ``1``.
|
| constant_value : int, optional
| The constant label value to use. Has no effect if ``label_mode`` is not ``'seeds'``.
|
| inplace : bool, default: False
| If ``True``, perform an inplace labelling of the ImageData. Else, returns a
| new ImageData.
|
| progress_bar : bool, default: False
| Display a progress bar to indicate progress.
|
| Returns
| -------
| pyvista.ImageData
| Either the input ImageData or a generated one where connected regions are
| labelled with a ``'RegionId'`` point-based or cell-based data.
|
| NDArray[int]
| The labels of each extracted regions.
|
| NDArray[int]
| The size (i.e., number of cells) of each extracted regions.
|
| See Also
| --------
| pyvista.DataSetFilters.connectivity
| Similar general-purpose filter that performs 1-connectivity.
|
| Examples
| --------
| Prepare a segmented grid.
|
| >>> import pyvista as pv
| >>> segmented_grid = pv.ImageData(dimensions=(4, 3, 3))
| >>> segmented_grid.cell_data['Data'] = [
| ... 0,
| ... 0,
| ... 0,
| ... 1,
| ... 0,
| ... 1,
| ... 1,
| ... 2,
| ... 0,
| ... 0,
| ... 0,
| ... 0,
| ... ]
| >>> segmented_grid.plot(show_edges=True)
|
| Label the connected regions. The cells with a ``0`` value are excluded from the
| connected regions and labelled with ``0``. The remaining cells define 3 different
| regions that are labelled by decreasing size.
|
| >>> connected, labels, sizes = segmented_grid.label_connectivity(
| ... scalar_range='foreground'
| ... )
| >>> pl = pv.Plotter()
| >>> _ = pl.add_mesh(connected.threshold(0.5), show_edges=True)
| >>> _ = pl.add_mesh(
| ... connected.threshold(0.5, invert=True),
| ... show_edges=True,
| ... opacity=0.5,
| ... )
| >>> pl.show()
|
| Exclude the cell with a ``2`` value.
|
| >>> connected, labels, sizes = segmented_grid.label_connectivity(
| ... scalar_range=[1, 1]
| ... )
| >>> pl = pv.Plotter()
| >>> _ = pl.add_mesh(connected.threshold(0.5), show_edges=True)
| >>> _ = pl.add_mesh(
| ... connected.threshold(0.5, invert=True),
| ... show_edges=True,
| ... opacity=0.5,
| ... )
| >>> pl.show()
|
| Label all connected regions with a constant value.
|
| >>> connected, labels, sizes = segmented_grid.label_connectivity(
| ... scalar_range='foreground',
| ... label_mode='constant',
| ... constant_value=10,
| ... )
| >>> pl = pv.Plotter()
| >>> _ = pl.add_mesh(connected.threshold(0.5), show_edges=True)
| >>> _ = pl.add_mesh(
| ... connected.threshold(0.5, invert=True),
| ... show_edges=True,
| ... opacity=0.5,
| ... )
| >>> pl.show()
|
| Label only the regions that include seed points, by seed order.
|
| >>> points = [(2.0, 1.0, 0.0), (0.0, 0.0, 1.0)]
| >>> connected, labels, sizes = segmented_grid.label_connectivity(
| ... scalar_range='foreground',
| ... extraction_mode='seeded',
| ... point_seeds=points,
| ... )
| >>> pl = pv.Plotter()
| >>> _ = pl.add_mesh(connected.threshold(0.5), show_edges=True)
| >>> _ = pl.add_mesh(
| ... connected.threshold(0.5, invert=True),
| ... show_edges=True,
| ... opacity=0.5,
| ... )
| >>> pl.show()
|
| low_pass(self, x_cutoff, y_cutoff, z_cutoff, order=1, output_scalars_name=None, progress_bar: 'bool' = False)
| Perform a Butterworth low pass filter in the frequency domain.
|
| This filter requires that the :class:`ImageData` have a complex point
| scalars, usually generated after the :class:`ImageData` has been
| converted to the frequency domain by a :func:`ImageDataFilters.fft`
| filter.
|
| A :func:`ImageDataFilters.rfft` filter can be used to convert the
| output back into the spatial domain. This filter attenuates high
| frequency components. Input and output are complex arrays with
| datatype :attr:`numpy.complex128`.
|
| The frequencies of the input assume standard order: along each axis
| first positive frequencies are assumed from 0 to the maximum, then
| negative frequencies are listed from the largest absolute value to
| smallest. This implies that the corners of the grid correspond to low
| frequencies, while the center of the grid corresponds to high
| frequencies.
|
| Parameters
| ----------
| x_cutoff : float
| The cutoff frequency for the x-axis.
|
| y_cutoff : float
| The cutoff frequency for the y-axis.
|
| z_cutoff : float
| The cutoff frequency for the z-axis.
|
| order : int, default: 1
| The order of the cutoff curve. Given from the equation
| ``1 + (cutoff/freq(i, j))**(2*order)``.
|
| output_scalars_name : str, optional
| The name of the output scalars. By default, this is the same as the
| active scalars of the dataset.
|
| progress_bar : bool, default: False
| Display a progress bar to indicate progress.
|
| Returns
| -------
| pyvista.ImageData
| :class:`pyvista.ImageData` with the applied low pass filter.
|
| See Also
| --------
| fft : Direct fast Fourier transform.
| rfft : Reverse fast Fourier transform.
| high_pass : High-pass filtering of FFT output.
|
| Examples
| --------
| See :ref:`image_fft_perlin_noise_example` for a full example using this filter.
|
| median_smooth(self, kernel_size=(3, 3, 3), scalars=None, preference='point', progress_bar: 'bool' = False)
| Smooth data using a median filter.
|
| The Median filter that replaces each pixel with the median value from a
| rectangular neighborhood around that pixel. Neighborhoods can be no
| more than 3 dimensional. Setting one axis of the neighborhood
| kernelSize to 1 changes the filter into a 2D median.
|
| See :vtk:`vtkImageMedian3D` for more details.
|
| Parameters
| ----------
| kernel_size : sequence[int], default: (3, 3, 3)
| Size of the kernel in each dimension (units of voxels), for example
| ``(x_size, y_size, z_size)``. Default is a 3D median filter. If you
| want to do a 2D median filter, set the size to 1 in the dimension
| you don't want to filter over.
|
| scalars : str, optional
| Name of scalars to process. Defaults to currently active scalars.
|
| preference : str, default: "point"
| When scalars is specified, this is the preferred array
| type to search for in the dataset. Must be either
| ``'point'`` or ``'cell'``.
|
| progress_bar : bool, default: False
| Display a progress bar to indicate progress.
|
| Returns
| -------
| pyvista.ImageData
| Uniform grid with smoothed scalars.
|
| Warnings
| --------
| Applying this filter to cell data will send the output to a new point
| array with the same name, overwriting any existing point data array
| with the same name.
|
| Examples
| --------
| First, create sample data to smooth. Here, we use
| :func:`pyvista.perlin_noise() <pyvista.core.utilities.features.perlin_noise>`
| to create meaningful data.
|
| >>> import numpy as np
| >>> import pyvista as pv
| >>> noise = pv.perlin_noise(0.1, (2, 5, 8), (0, 0, 0))
| >>> grid = pv.sample_function(
| ... noise, bounds=[0, 1, 0, 1, 0, 1], dim=(20, 20, 20)
| ... )
| >>> grid.plot(show_scalar_bar=False)
|
| Next, smooth the sample data.
|
| >>> smoothed = grid.median_smooth(kernel_size=(10, 10, 10))
| >>> smoothed.plot(show_scalar_bar=False)
|
| open(self: 'ImageData', kernel_size: 'int | VectorLike[int]' = (3, 3, 3), scalars: 'str | None' = None, *, binary: 'bool | VectorLike[float] | None' = None, progress_bar: 'bool' = False)
| Perform morphological opening on continuous or binary data.
|
| Opening is an :meth:`erosion <erode>` followed by a :meth:`dilation <dilate>`.
| It is used to remove small objects/noise while preserving the shape and size of larger
| objects.
|
| .. versionadded:: 0.47
|
| Parameters
| ----------
| kernel_size : int | VectorLike[int], default: (3, 3, 3)
| Determines the size of the kernel along the xyz-axes. Only non-singleton dimensions
| are opened, e.g. a kernel size of ``(3, 3, 1)`` and ``(3, 3, 3)`` produce the same
| result for 2D images.
|
| scalars : str, optional
| Name of scalars to process. Defaults to currently active scalars.
|
| binary : bool | VectorLike[float], optional
| Control if binary opening or continuous opening is used. Refer to
| :meth:`erode` and/or :meth:`dilate` for details about using this keyword.
|
| progress_bar : bool, default: False
| Display a progress bar to indicate progress.
|
| Returns
| -------
| pyvista.ImageData
| Dataset that has been opened.
|
| See Also
| --------
| close, erode, dilate
|
| Notes
| -----
| This filter only supports point data. For inputs with cell data, consider
| re-meshing the cell data as point data with
| :meth:`~pyvista.ImageDataFilters.cells_to_points`
| or resampling the cell data to point data with
| :func:`~pyvista.DataObjectFilters.cell_data_to_point_data`.
|
| Examples
| --------
| Load a grayscale image :func:`~pyvista.examples.downloads.download_chest()` and show it
| for context.
|
| >>> from pyvista import examples
| >>> im = examples.download_chest()
| >>> clim = im.get_data_range()
| >>> kwargs = dict(
| ... cmap='grey',
| ... clim=clim,
| ... lighting=False,
| ... cpos='xy',
| ... zoom='tight',
| ... show_axes=False,
| ... show_scalar_bar=False,
| ... )
| >>> im.plot(**kwargs)
|
| Use ``open`` to remove small objects in the lungs.
|
| >>> opened = im.open(kernel_size=15)
| >>> opened.plot(**kwargs)
|
| pad_image(self, pad_value: "float | VectorLike[float] | Literal['wrap', 'mirror']" = 0.0, *, pad_size: 'int | VectorLike[int]' = 1, dimensionality: "VectorLike[bool] | Literal[0, 1, 2, 3, '0D', '1D', '2D', '3D', 'preserve']" = 'preserve', scalars: 'str | None' = None, pad_all_scalars: 'bool' = False, progress_bar: 'bool' = False) -> 'ImageData'
| Enlarge an image by padding its boundaries with new points.
|
| .. versionadded:: 0.44.0
|
| Padded points may be mirrored, wrapped, or filled with a constant value. By
| default, all boundaries of the image are padded with a single constant value.
|
| This filter is designed to work with 1D, 2D, or 3D image data and will only pad
| non-singleton dimensions unless otherwise specified.
|
| Parameters
| ----------
| pad_value : float | sequence[float] | 'mirror' | 'wrap', default: 0.0
| Padding value(s) given to new points outside the original image extent.
| Specify:
|
| - a number: New points are filled with the specified constant value.
| - a vector: New points are filled with the specified multi-component vector.
| - ``'wrap'``: New points are filled by wrapping around the padding axis.
| - ``'mirror'``: New points are filled by mirroring the padding axis.
|
| pad_size : int | sequence[int], default: 1
| Number of points to add to the image boundaries. Specify:
|
| - A single value to pad all boundaries equally.
| - Two values, one for each ``(X, Y)`` axis, to apply symmetric padding to
| each axis independently.
| - Three values, one for each ``(X, Y, Z)`` axis, to apply symmetric padding
| to each axis independently.
| - Four values, one for each ``(-X, +X, -Y, +Y)`` boundary, to apply
| padding to each boundary independently.
| - Six values, one for each ``(-X, +X, -Y, +Y, -Z, +Z)`` boundary, to apply
| padding to each boundary independently.
|
| dimensionality : VectorLike[bool], Literal[1, 2, 3, "1D", "2D", "3D", "preserve"]
| Control which dimensions will be padded by the filter.
| ``'preserve'`` is used by default.
|
| - Can be specified as a sequence of 3 boolean to apply padding on a per
| dimension basis.
| - ``1`` or ``'1D'``: apply padding such that the output is a 1D ImageData
| where exactly one dimension is greater than one, e.g. ``(>1, 1, 1)``.
| Only valid for 0D or 1D inputs.
| - ``2`` or ``'2D'``: apply padding such that the output is a 2D ImageData
| where exactly two dimensions are greater than one, e.g. ``(>1, >1, 1)``.
| Only valid for 0D, 1D, or 2D inputs.
| - ``3`` or ``'3D'``: apply padding such that the output is a 3D ImageData,
| where all three dimensions are greater than one, e.g. ``(>1, >1, >1)``.
| Valid for any 0D, 1D, 2D, or 3D inputs.
|
| .. note::
| The ``pad_size`` for singleton dimensions is set to ``0`` by default, even
| if non-zero pad sizes are specified for these axes with this parameter.
| Set ``dimensionality`` to a value different than ``'preserve'`` to
| override this behavior and enable padding any or all dimensions.
|
| .. versionadded:: 0.45.0
|
| scalars : str, optional
| Name of scalars to pad. Defaults to currently active scalars. Unless
| ``pad_all_scalars`` is ``True``, only the specified ``scalars`` are included
| in the output.
|
| pad_all_scalars : bool, default: False
| Pad all point data scalars and include them in the output. This is useful
| for padding images with multiple scalars. If ``False``, only the specified
| ``scalars`` are padded.
|
| progress_bar : bool, default: False
| Display a progress bar to indicate progress.
|
| Returns
| -------
| pyvista.ImageData
| Padded image.
|
| See Also
| --------
| crop, resample, contour_labels
|
| Examples
| --------
| Pad a grayscale image with a 100-pixel wide border. The padding is black
| (i.e. has a value of ``0``) by default.
|
| >>> import pyvista as pv
| >>> from pyvista import examples
| >>>
| >>> gray_image = examples.download_moonlanding_image()
| >>> gray_image.dimensions
| (630, 474, 1)
| >>> padded = gray_image.pad_image(pad_size=100)
| >>> padded.dimensions
| (830, 674, 1)
|
| Plot the image. To show grayscale images correctly, we define a custom plotting
| method.
|
| >>> def grayscale_image_plotter(image):
| ... import vtk
| ...
| ... actor = vtk.vtkImageActor()
| ... actor.GetMapper().SetInputData(image)
| ... actor.GetProperty().SetInterpolationTypeToNearest()
| ... pl = pv.Plotter()
| ... pl.add_actor(actor)
| ... pl.view_xy()
| ... pl.camera.tight()
| ... return pl
| >>>
| >>> pl = grayscale_image_plotter(padded)
| >>> pl.show()
|
| Pad only the x-axis with a white border.
|
| >>> padded = gray_image.pad_image(pad_value=255, pad_size=(200, 0))
| >>> pl = grayscale_image_plotter(padded)
| >>> pl.show()
|
| Pad with wrapping.
|
| >>> padded = gray_image.pad_image('wrap', pad_size=100)
| >>> plot = grayscale_image_plotter(padded)
| >>> plot.show()
|
| Pad with mirroring.
|
| >>> padded = gray_image.pad_image('mirror', pad_size=100)
| >>> plot = grayscale_image_plotter(padded)
| >>> plot.show()
|
| Pad a color image using multi-component color vectors. Here, RGBA values are
| used.
|
| >>> color_image = examples.download_beach()
| >>> red = (255, 0, 0) # RGB
| >>> padded = color_image.pad_image(pad_value=red, pad_size=50)
| >>>
| >>> plot_kwargs = dict(cpos='xy', zoom='tight', rgb=True, show_axes=False)
| >>> padded.plot(**plot_kwargs)
|
| Pad each edge of the image separately with a different color.
|
| >>> orange = pv.Color('orange').int_rgb
| >>> purple = pv.Color('purple').int_rgb
| >>> blue = pv.Color('blue').int_rgb
| >>> green = pv.Color('green').int_rgb
| >>>
| >>> padded = color_image.pad_image(orange, pad_size=(25, 0, 0, 0))
| >>> padded = padded.pad_image(purple, pad_size=(0, 25, 0, 0))
| >>> padded = padded.pad_image(blue, pad_size=(0, 0, 25, 0))
| >>> padded = padded.pad_image(green, pad_size=(0, 0, 0, 25))
| >>>
| >>> padded.plot(**plot_kwargs)
|
| points_to_cells(self: 'ImageData', scalars: 'str | None' = None, *, dimensionality: "VectorLike[bool] | Literal[0, 1, 2, 3, '0D', '1D', '2D', '3D', 'preserve']" = 'preserve', copy: 'bool' = True)
| Re-mesh image data from a point-based to a cell-based representation.
|
| This filter changes how image data is represented. Data represented as points
| at the input is re-meshed into an alternative representation as cells at the
| output. Only the :class:`~pyvista.ImageData` container is modified so that
| the number of input points equals the number of output cells. The re-meshing is
| otherwise lossless in the sense that point data at the input is passed through
| unmodified and stored as cell data at the output. Any cell data at the input is
| ignored and is not used by this filter.
|
| To change the image data's representation, the input points are used to
| represent the centers of the output cells. This has the effect of "growing" the
| input image dimensions by one along each axis (i.e. half the cell width on each
| side). For example, an image with 100 points and 99 cells along an axis at the
| input will have 101 points and 100 cells at the output. If the input has 1mm
| spacing, the axis size will also increase from 99mm to 100mm. By default,
| only non-singleton dimensions are increased such that 1D or 2D inputs remain
| 1D or 2D at the output.
|
| Since filters may be inherently cell-based (e.g. some :class:`~pyvista.DataSetFilters`)
| or may operate on point data exclusively (e.g. most :class:`~pyvista.ImageDataFilters`),
| re-meshing enables the same data to be used with either kind of filter while
| ensuring the input data to those filters has the appropriate representation.
| This filter is also useful when plotting image data to achieve a desired visual
| effect, such as plotting images as voxel cells instead of as points.
|
| .. note::
| Only the input's :attr:`~pyvista.ImageData.dimensions`, and
| :attr:`~pyvista.ImageData.origin` are modified by this filter. Other spatial
| properties such as :attr:`~pyvista.ImageData.spacing` and
| :attr:`~pyvista.ImageData.direction_matrix` are not affected.
|
| .. versionadded:: 0.44.0
|
| See Also
| --------
| cells_to_points
| Inverse of this filter to represent cells as points.
| :meth:`~pyvista.DataObjectFilters.cell_data_to_point_data`
| Resample point data as cell data without modifying the container.
| :meth:`~pyvista.DataObjectFilters.cell_data_to_point_data`
| Resample cell data as point data without modifying the container.
|
| Parameters
| ----------
| scalars : str, optional
| Name of point data scalars to pass through to the output as cell data. Use
| this parameter to restrict the output to only include the specified array.
| By default, all point data arrays at the input are passed through as cell
| data at the output.
|
| dimensionality : VectorLike[bool], Literal[0, 1, 2, 3, "0D", "1D", "2D", "3D", "preserve"]
| Control which dimensions will be modified by the filter.
| ``'preserve'`` is used by default.
|
| - Can be specified as a sequence of 3 boolean to allow modification on a per
| dimension basis.
| - ``0`` or ``'0D'``: convenience alias to output a 0D ImageData with
| dimensions ``(1, 1, 1)``. Only valid for 0D inputs.
| - ``1`` or ``'1D'``: convenience alias to output a 1D ImageData where
| exactly one dimension is greater than one, e.g. ``(>1, 1, 1)``. Only valid
| for 0D or 1D inputs.
| - ``2`` or ``'2D'``: convenience alias to output a 2D ImageData where
| exactly two dimensions are greater than one, e.g. ``(>1, >1, 1)``. Only
| valid for 0D, 1D, or 2D inputs.
| - ``3`` or ``'3D'``: convenience alias to output a 3D ImageData, where all
| three dimensions are greater than one, e.g. ``(>1, >1, >1)``. Valid for
| any 0D, 1D, 2D, or 3D inputs.
| - ``'preserve'`` (default): convenience alias to not modify singleton
| dimensions.
|
| copy : bool, default: True
| Copy the input point data before associating it with the output cell data.
| If ``False``, the input and output will both refer to the same data array(s).
|
| Returns
| -------
| pyvista.ImageData
| Image with a cell-based representation.
|
| Examples
| --------
| Load an image with point data.
|
| >>> from pyvista import examples
| >>> image = examples.load_uniform()
|
| Show the current properties and point arrays of the image.
|
| >>> image
| ImageData (...)
| N Cells: 729
| N Points: 1000
| X Bounds: 0.000e+00, 9.000e+00
| Y Bounds: 0.000e+00, 9.000e+00
| Z Bounds: 0.000e+00, 9.000e+00
| Dimensions: 10, 10, 10
| Spacing: 1.000e+00, 1.000e+00, 1.000e+00
| N Arrays: 2
|
| >>> image.point_data.keys()
| ['Spatial Point Data']
|
| Re-mesh the points and point data as cells and cell data.
|
| >>> cells_image = image.points_to_cells()
|
| Show the properties and cell arrays of the re-meshed image.
|
| >>> cells_image
| ImageData (...)
| N Cells: 1000
| N Points: 1331
| X Bounds: -5.000e-01, 9.500e+00
| Y Bounds: -5.000e-01, 9.500e+00
| Z Bounds: -5.000e-01, 9.500e+00
| Dimensions: 11, 11, 11
| Spacing: 1.000e+00, 1.000e+00, 1.000e+00
| N Arrays: 1
|
| >>> cells_image.cell_data.keys()
| ['Spatial Point Data']
|
| Observe that:
|
| - The input point array is now a cell array
| - The output has one less array (the input cell data is ignored)
| - The dimensions have increased by one
| - The bounds have increased by half the spacing
| - The output ``N Cells`` equals the input ``N Points``
|
| Since the input points are 3D (i.e. there are no singleton dimensions), the
| output cells are 3D :attr:`~pyvista.CellType.VOXEL` cells.
|
| >>> cells_image.get_cell(0).type
| <CellType.VOXEL: 11>
|
| If the input points are 2D (i.e. one dimension is singleton), the
| output cells are 2D :attr:`~pyvista.CellType.PIXEL` cells when ``dimensions`` is
| set to ``'preserve'``.
|
| >>> image2D = examples.download_beach()
| >>> image2D.dimensions
| (100, 100, 1)
|
| >>> pixel_cells_image = image2D.points_to_cells(dimensionality='preserve')
| >>> pixel_cells_image.dimensions
| (101, 101, 1)
| >>> pixel_cells_image.get_cell(0).type
| <CellType.PIXEL: 8>
|
| This is equivalent as requesting a 2D output.
|
| >>> pixel_cells_image = image2D.points_to_cells(dimensionality='2D')
| >>> pixel_cells_image.dimensions
| (101, 101, 1)
| >>> pixel_cells_image.get_cell(0).type
| <CellType.PIXEL: 8>
|
| Use ``(True, True, True)`` to re-mesh 2D points as 3D cells.
|
| >>> voxel_cells_image = image2D.points_to_cells(
| ... dimensionality=(True, True, True)
| ... )
| >>> voxel_cells_image.dimensions
| (101, 101, 2)
| >>> voxel_cells_image.get_cell(0).type
| <CellType.VOXEL: 11>
|
| Or request a 3D output.
|
| >>> voxel_cells_image = image2D.points_to_cells(dimensionality='3D')
| >>> voxel_cells_image.dimensions
| (101, 101, 2)
| >>> voxel_cells_image.get_cell(0).type
| <CellType.VOXEL: 11>
|
| See :ref:`image_representations_example` for more examples using this filter.
|
| resample(self: 'ImageData', sample_rate: 'float | VectorLike[float] | None' = None, interpolation: '_InterpolationOptions' = 'nearest', *, border_mode: "Literal['clamp', 'wrap', 'mirror']" = 'clamp', reference_image: 'ImageData | None' = None, dimensions: 'VectorLike[int] | None' = None, anti_aliasing: 'bool' = False, extend_border: 'bool | None' = None, scalars: 'str | None' = None, preference: "Literal['point', 'cell']" = 'point', inplace: 'bool' = False, progress_bar: 'bool' = False)
| Resample the image to modify its dimensions and spacing.
|
| The resampling can be controlled in several ways:
|
| #. Specify the output geometry using a ``reference_image``.
|
| #. Specify the ``dimensions`` explicitly.
|
| #. Specify the ``sample_rate`` explicitly.
|
| Use ``reference_image`` for full control of the resampled geometry. For
| all other options, the geometry is implicitly defined such that the resampled
| image fits the bounds of the input.
|
| This filter may be used to resample either point or cell data. For point data,
| this filter assumes the data is from discrete samples in space which represent
| pixels or voxels; the resampled bounds are therefore extended by 1/2 voxel
| spacing by default though this may be disabled.
|
| .. note::
|
| Singleton dimensions are not resampled by this filter, e.g. 2D images
| will remain 2D.
|
| .. versionadded:: 0.45
|
| Parameters
| ----------
| sample_rate : float | VectorLike[float], optional
| Sampling rate(s) to use. Can be a single value or vector of three values
| for each axis. Values greater than ``1.0`` will up-sample the axis and
| values less than ``1.0`` will down-sample it. Values must be greater than ``0``.
|
| interpolation : 'nearest', 'linear', 'cubic', 'lanczos', 'hamming', 'blackman', 'bspline'
| Interpolation mode to use.
|
| - ``'nearest'`` (default) duplicates (if upsampling) or removes (if downsampling)
| values but does not modify them.
| - ``'linear'`` and ``'cubic'`` use linear and cubic interpolation, respectively.
| - ``'lanczos'``, ``'hamming'``, and ``'blackman'`` use a windowed sinc filter
| and may be used to preserve sharp details and/or reduce image artifacts.
| - ``'bspline'`` uses an n-degree basis spline to smoothly interpolate across points.
| The default degree is ``3``, but can range from ``0`` to ``9``. Append the desired
| degree to the string to set it, e.g. ``'bspline5'`` for a 5th-degree B-spline.
|
| .. versionadded:: 0.47
| Added ``'bspline'`` interpolation.
|
| .. note::
|
| - use ``'nearest'`` for pixel art or categorical data such as segmentation masks
| - use ``'linear'`` for speed-critical tasks
| - use ``'cubic'`` for upscaling or general-purpose resampling
| - use ``'lanczos'`` for high-detail downsampling (at the cost of some ringing)
| - use ``'blackman'`` for minimizing ringing artifacts (at the cost of some detail)
| - use ``'hamming'`` for a balance between detail-preservation and reducing ringing
|
| border_mode : 'clamp' | 'wrap' | 'mirror', default: 'clamp'
| Controls the interpolation at the image's borders.
|
| - ``'clamp'`` - values outside the image are clamped to the nearest edge.
| - ``'wrap'`` - values outside the image are wrapped periodically along the axis.
| - ``'mirror'`` - values outside the image are mirrored at the boundary.
|
| .. versionadded:: 0.47
|
| reference_image : ImageData, optional
| Reference image to use. If specified, the input is resampled
| to match the geometry of the reference. The :attr:`~pyvista.ImageData.dimensions`,
| :attr:`~pyvista.ImageData.spacing`, :attr:`~pyvista.ImageData.origin`,
| :attr:`~pyvista.ImageData.offset`, and :attr:`~pyvista.ImageData.direction_matrix`
| of the resampled image will all match the reference image.
|
| dimensions : VectorLike[int], optional
| Set the output :attr:`~pyvista.ImageData.dimensions` of the resampled image.
|
| .. note::
|
| Dimensions is the number of `points` along each axis. If resampling
| `cell` data, each dimension should be one more than the number of
| desired output cells (since there are ``N`` cells and ``N+1`` points
| along each axis). See examples.
|
| anti_aliasing : bool, default: False
| Enable antialiasing. This will blur the image as part of the resampling
| to reduce image artifacts when down-sampling. Has no effect when up-sampling.
|
| extend_border : bool, optional
| Extend the apparent input border by approximately half the
| :attr:`~pyvista.ImageData.spacing`. If enabled, the bounds of the
| resampled points will be larger than the input image bounds.
| Enabling this option also has the effect that the re-sampled spacing
| will directly correlate with the resampled dimensions, e.g. if
| the dimensions are doubled the spacing will be halved. See examples.
|
| This option is enabled by default when resampling point data. Has no effect
| when resampling cell data or when a ``reference_image`` is provided.
|
| scalars : str, optional
| Name of scalars to resample. Defaults to currently active scalars.
|
| preference : str, default: 'point'
| When scalars is specified, this is the preferred array type to search
| for in the dataset. Must be either ``'point'`` or ``'cell'``.
|
| inplace : bool, default: False
| If ``True``, resample the image inplace. By default, a new
| :class:`~pyvista.ImageData` instance is returned.
|
| progress_bar : bool, default: False
| Display a progress bar to indicate progress.
|
| Returns
| -------
| ImageData
| Resampled image.
|
| See Also
| --------
| crop
| Crop image to remove points at the image's boundaries.
|
| :meth:`~pyvista.DataObjectFilters.sample`
| Resample array data from one mesh onto another.
|
| :meth:`~pyvista.DataSetFilters.interpolate`
| Interpolate values from one mesh onto another.
|
| :ref:`image_representations_example`
| Compare images represented as points vs. cells.
|
| Examples
| --------
| Create a small 2D grayscale image with dimensions ``3 x 2`` for demonstration.
|
| >>> import pyvista as pv
| >>> import numpy as np
| >>> from pyvista import examples
| >>> image = pv.ImageData(dimensions=(3, 2, 1))
| >>> image.point_data['data'] = np.linspace(0, 255, 6, dtype=np.uint8)
|
| Define a custom plotter to show the image. Although the image data is defined
| as point data, we use :meth:`points_to_cells` to display the image as
| :attr:`~pyvista.CellType.PIXEL` (or :attr:`~pyvista.CellType.VOXEL`) cells
| instead. Grayscale coloring is used and the camera is adjusted to fit the image.
|
| >>> def image_plotter(image: pv.ImageData, clim=(0, 255)) -> pv.Plotter:
| ... pl = pv.Plotter()
| ... image = image.points_to_cells()
| ... pl.add_mesh(
| ... image,
| ... lighting=False,
| ... show_edges=True,
| ... cmap='grey',
| ... clim=clim,
| ... show_scalar_bar=False,
| ... line_width=3,
| ... )
| ... pl.view_xy()
| ... pl.camera.tight()
| ... pl.enable_anti_aliasing()
| ... return pl
|
| Show the image.
|
| >>> plot = image_plotter(image)
| >>> plot.show()
|
| Use ``sample_rate`` to up-sample the image. ``'nearest'`` interpolation is
| used by default.
|
| >>> upsampled = image.resample(sample_rate=2.0)
| >>> plot = image_plotter(upsampled)
| >>> plot.show()
|
| Use ``'linear'`` interpolation. Note that the argument names ``sample_rate``
| and ``interpolation`` may be omitted.
|
| >>> upsampled = image.resample(2.0, 'linear')
| >>> plot = image_plotter(upsampled)
| >>> plot.show()
|
| Use ``'cubic'`` interpolation. Here we also specify the output
| ``dimensions`` explicitly instead of using ``sample_rate``.
|
| >>> upsampled = image.resample(dimensions=(6, 4, 1), interpolation='cubic')
| >>> plot = image_plotter(upsampled)
| >>> plot.show()
|
| Compare the relative physical size of the image before and after resampling.
|
| >>> image
| ImageData (...)
| N Cells: 2
| N Points: 6
| X Bounds: 0.000e+00, 2.000e+00
| Y Bounds: 0.000e+00, 1.000e+00
| Z Bounds: 0.000e+00, 0.000e+00
| Dimensions: 3, 2, 1
| Spacing: 1.000e+00, 1.000e+00, 1.000e+00
| N Arrays: 1
|
| >>> upsampled
| ImageData (...)
| N Cells: 15
| N Points: 24
| X Bounds: -2.500e-01, 2.250e+00
| Y Bounds: -2.500e-01, 1.250e+00
| Z Bounds: 0.000e+00, 0.000e+00
| Dimensions: 6, 4, 1
| Spacing: 5.000e-01, 5.000e-01, 1.000e+00
| N Arrays: 1
|
| Note that the upsampled :attr:`~pyvista.ImageData.dimensions` are doubled and
| the :attr:`~pyvista.ImageData.spacing` is halved (as expected). Also note,
| however, that the physical bounds of the input differ from the output.
| The upsampled :attr:`~pyvista.ImageData.origin` also differs:
|
| >>> image.origin
| (0.0, 0.0, 0.0)
| >>> upsampled.origin
| (-0.25, -0.25, 0.0)
|
| This is because the resampling is done with ``extend_border`` enabled by default
| which adds a half cell-width border to the image and adjusts the origin and
| spacing such that the bounds match when the image is represented as cells.
|
| Apply :meth:`points_to_cells` to the input and resampled images and show that
| the bounds match.
|
| >>> image_as_cells = image.points_to_cells()
| >>> image_as_cells.bounds
| BoundsTuple(x_min = -0.5,
| x_max = 2.5,
| y_min = -0.5,
| y_max = 1.5,
| z_min = 0.0,
| z_max = 0.0)
|
| >>> upsampled_as_cells = upsampled.points_to_cells()
| >>> upsampled_as_cells.bounds
| BoundsTuple(x_min = -0.5,
| x_max = 2.5,
| y_min = -0.5,
| y_max = 1.5,
| z_min = 0.0,
| z_max = 0.0)
|
| Plot the two images together as wireframe to visualize them. The original is in
| red, and the resampled image is in black.
|
| >>> pl = pv.Plotter()
| >>> _ = pl.add_mesh(
| ... image_as_cells, style='wireframe', color='red', line_width=10
| ... )
| >>> _ = pl.add_mesh(
| ... upsampled_as_cells, style='wireframe', color='black', line_width=2
| ... )
| >>> pl.view_xy()
| >>> pl.camera.tight()
| >>> pl.show()
|
| Disable ``extend_border`` to force the input and output bounds of the points
| to be the same instead.
|
| >>> upsampled = image.resample(sample_rate=2, extend_border=False)
|
| Compare the two images again.
|
| >>> image
| ImageData (...)
| N Cells: 2
| N Points: 6
| X Bounds: 0.000e+00, 2.000e+00
| Y Bounds: 0.000e+00, 1.000e+00
| Z Bounds: 0.000e+00, 0.000e+00
| Dimensions: 3, 2, 1
| Spacing: 1.000e+00, 1.000e+00, 1.000e+00
| N Arrays: 1
|
| >>> upsampled
| ImageData (...)
| N Cells: 15
| N Points: 24
| X Bounds: 0.000e+00, 2.000e+00
| Y Bounds: 0.000e+00, 1.000e+00
| Z Bounds: 0.000e+00, 0.000e+00
| Dimensions: 6, 4, 1
| Spacing: 4.000e-01, 3.333e-01, 1.000e+00
| N Arrays: 1
|
| This time the input and output bounds match without any further processing.
| Like before, the dimensions have doubled; unlike before, however, the spacing is
| not halved, but is instead smaller than half which is necessary to ensure the
| bounds remain the same. Also unlike before, the origin is unaffected:
|
| >>> image.origin
| (0.0, 0.0, 0.0)
| >>> upsampled.origin
| (0.0, 0.0, 0.0)
|
| All the above examples are with 2D images with point data. However, the filter
| also works with 3D volumes and will also work with cell data.
|
| Convert the 2D image with point data into a 3D volume with cell data and plot
| it for context.
|
| >>> volume = image.points_to_cells(dimensionality='3D')
| >>> volume.plot(show_edges=True, cmap='grey')
|
| Up-sample the volume. Set the sampling rate for each axis separately.
|
| >>> resampled = volume.resample(sample_rate=(3.0, 2.0, 1.0))
| >>> resampled.plot(show_edges=True, cmap='grey')
|
| Alternatively, we could have set the dimensions explicitly. Since we want
| ``9 x 4 x 1`` cells along the x-y-z axes (respectively), we set the dimensions
| to ``(10, 5, 2)``, i.e. one more than the desired number of cells.
|
| >>> resampled = volume.resample(dimensions=(10, 5, 2))
| >>> resampled.plot(show_edges=True, cmap='grey')
|
| Compare the bounds before and after resampling. Unlike with point data, the
| bounds are not (and cannot be) extended.
|
| >>> volume.bounds
| BoundsTuple(x_min = -0.5,
| x_max = 2.5,
| y_min = -0.5,
| y_max = 1.5,
| z_min = -0.5,
| z_max = 0.5)
| >>> resampled.bounds
| BoundsTuple(x_min = -0.5,
| x_max = 2.5,
| y_min = -0.5,
| y_max = 1.5,
| z_min = -0.5,
| z_max = 0.5)
|
| Use a reference image to control the resampling instead. Here we load two
| images with different dimensions:
| :func:`~pyvista.examples.downloads.download_bird` and
| :func:`~pyvista.examples.downloads.download_gourds`.
|
| >>> bird = examples.download_bird()
| >>> bird.dimensions
| (458, 342, 1)
|
| >>> gourds = examples.download_gourds()
| >>> gourds.dimensions
| (640, 480, 1)
|
| Use ``reference_image`` to resample the bird to match the gourds geometry or
| vice-versa.
|
| >>> bird_resampled = bird.resample(reference_image=gourds)
| >>> bird_resampled.dimensions
| (640, 480, 1)
|
| >>> gourds_resampled = gourds.resample(reference_image=bird)
| >>> gourds_resampled.dimensions
| (458, 342, 1)
|
| Downsample the gourds image to 1/10th its original resolution using ``'lanczos'``
| interpolation.
|
| >>> downsampled = gourds.resample(1 / 8, 'lanczos')
| >>> downsampled.dimensions
| (80, 60, 1)
|
| Compare the downsampled image to the original and zoom in to show detail.
|
| >>> def compare_images_plotter(image1, image2):
| ... pl = pv.Plotter(shape=(1, 2))
| ... _ = pl.add_mesh(image1, rgba=True, show_edges=False, lighting=False)
| ... pl.subplot(0, 1)
| ... _ = pl.add_mesh(image2, rgba=True, show_edges=False, lighting=False)
| ... pl.link_views()
| ... pl.view_xy()
| ... pl.camera.zoom(3.0)
| ... return pl
|
| >>> pl = compare_images_plotter(gourds, downsampled)
| >>> pl.show()
|
| Note that downsampling can create image artifacts caused by aliasing. Enable
| anti-aliasing to smooth the image before resampling.
|
| >>> downsampled2 = gourds.resample(1 / 8, 'lanczos', anti_aliasing=True)
|
| Compare down-sampling with aliasing (left) to without aliasing (right).
|
| >>> pl = compare_images_plotter(downsampled, downsampled2)
| >>> pl.show()
|
| Load an MRI of a knee and downsample it.
|
| >>> knee = pv.examples.download_knee().resample(
| ... 0.1, 'linear', anti_aliasing=True
| ... )
|
| Crop and plot it.
|
| >>> knee = knee.crop(normalized_bounds=[0.2, 0.8, 0.2, 0.8, 0.0, 1.0])
| >>> vmin = knee.active_scalars.min()
| >>> vmax = knee.active_scalars.max()
| >>> pl = image_plotter(knee, clim=[vmin, vmax])
| >>> pl.show()
|
| Upsample it with B-spline interpolation. The interpolation is very smooth.
|
| >>> upsampled = knee.resample(2.0, 'bspline', border_mode='clamp')
| >>> pl = image_plotter(upsampled, clim=[vmin, vmax])
| >>> pl.show()
|
| Use the ``'wrap'`` border mode. Note how points at the border are brighter than previously,
| since the bright pixels from the opposite edge are now included in the interpolation.
|
| >>> upsampled = knee.resample(2.0, 'bspline', border_mode='wrap')
| >>> pl = image_plotter(upsampled, clim=[vmin, vmax])
| >>> pl.show()
|
| Compare B-spline interpolation to ``'hamming'``.
|
| >>> upsampled = knee.resample(2.0, 'hamming')
| >>> pl = image_plotter(upsampled, clim=[vmin, vmax])
| >>> pl.show()
|
| rfft(self, output_scalars_name=None, progress_bar: 'bool' = False)
| Apply a reverse fast Fourier transform (RFFT) to the active scalars.
|
| The input can be real or complex data, but the output is always
| :attr:`numpy.complex128`. The filter is fastest for images that have power
| of two sizes.
|
| The filter uses a butterfly diagram for each prime factor of the
| dimension. This makes images with prime number dimensions (i.e. 17x17)
| much slower to compute. FFTs of multidimensional meshes (i.e volumes)
| are decomposed so that each axis executes serially.
|
| The frequencies of the input assume standard order: along each axis
| first positive frequencies are assumed from 0 to the maximum, then
| negative frequencies are listed from the largest absolute value to
| smallest. This implies that the corners of the grid correspond to low
| frequencies, while the center of the grid corresponds to high
| frequencies.
|
| Parameters
| ----------
| output_scalars_name : str, optional
| The name of the output scalars. By default, this is the same as the
| active scalars of the dataset.
|
| progress_bar : bool, default: False
| Display a progress bar to indicate progress.
|
| Returns
| -------
| pyvista.ImageData
| :class:`pyvista.ImageData` with the applied reverse FFT.
|
| See Also
| --------
| fft : The direct transform.
| low_pass : Low-pass filtering of FFT output.
| high_pass : High-pass filtering of FFT output.
|
| Examples
| --------
| Apply reverse FFT to an example image.
|
| >>> from pyvista import examples
| >>> image = examples.download_moonlanding_image()
| >>> fft_image = image.fft()
| >>> image_again = fft_image.rfft()
| >>> image_again.point_data # doctest:+SKIP
| pyvista DataSetAttributes
| Association : POINT
| Active Scalars : PNGImage
| Active Vectors : None
| Active Texture : None
| Active Normals : None
| Contains arrays :
| PNGImage complex128 (298620,) SCALARS
|
| See :ref:`image_fft_example` for a full example using this filter.
|
| select_values(self: 'ImageData', values: 'float | VectorLike[float] | MatrixLike[float] | dict[str, float] | dict[float, str] | None' = None, *, ranges: 'VectorLike[float] | MatrixLike[float] | dict[str, VectorLike[float]] | dict[tuple[float, float], str] | None' = None, fill_value: 'float | VectorLike[float]' = 0, replacement_value: 'float | VectorLike[float] | None' = None, scalars: 'str | None' = None, preference: "Literal['point', 'cell']" = 'point', component_mode: "Literal['any', 'all', 'multi'] | int" = 'all', invert: 'bool' = False, split: 'bool' = False)
| Select values of interest and fill the rest with a constant.
|
| Point or cell data may be selected with a single value, multiple values, a range
| of values, or any mix of values and ranges. This enables threshold-like
| filtering of data in a discontinuous manner to select a single label or groups
| of labels from categorical data, or to select multiple regions from continuous
| data. Selected values may optionally be split into separate meshes.
|
| The selected values are stored in an array with the same name as the input.
|
| .. versionadded:: 0.45
|
| Parameters
| ----------
| values : float | ArrayLike[float] | dict, optional
| Value(s) to select. Can be a number, an iterable of numbers, or a dictionary
| with numeric entries. For ``dict`` inputs, either its keys or values may be
| numeric, and the other field must be strings. The numeric field is used as
| the input for this parameter, and if ``split`` is ``True``, the string field
| is used to set the block names of the returned :class:`~pyvista.MultiBlock`.
|
| .. note::
| When selecting multi-component values with ``component_mode=multi``,
| each value is specified as a multi-component scalar. In this case,
| ``values`` can be a single vector or an array of row vectors.
|
| ranges : ArrayLike[float] | dict, optional
| Range(s) of values to select. Can be a single range (i.e. a sequence of
| two numbers in the form ``[lower, upper]``), a sequence of ranges, or a
| dictionary with range entries. Any combination of ``values`` and ``ranges``
| may be specified together. The endpoints of the ranges are included in the
| selection. Ranges cannot be set when ``component_mode=multi``.
|
| For ``dict`` inputs, either its keys or values may be numeric, and the other
| field must be strings. The numeric field is used as the input for this
| parameter, and if ``split`` is ``True``, the string field is used to set the
| block names of the returned :class:`~pyvista.MultiBlock`.
|
| .. note::
| Use ``+/-`` infinity to specify an unlimited bound, e.g.:
|
| - ``[0, float('inf')]`` to select values greater than or equal to zero.
| - ``[float('-inf'), 0]`` to select values less than or equal to zero.
|
| fill_value : float | VectorLike[float] | None, default: 0
| Value used to fill the image. Can be a single value or a multi-component
| vector. Non-selected parts of the image will have this value. Set this to
| ``None`` to keep the input array's original values for non-selected regions.
|
| replacement_value : float | VectorLike[float], optional
| Replacement value for the output array. Can be a single value or a
| multi-component vector. If provided, selected values will be replaced with
| the given value. If no value is given, the selected values are retained and
| returned as-is. Setting this value is useful for generating a binarized
| output array.
|
| scalars : str, optional
| Name of scalars to select from. Defaults to currently active scalars.
|
| preference : str, default: 'point'
| When ``scalars`` is specified, this is the preferred array type to search
| for in the dataset. Must be either ``'point'`` or ``'cell'``.
|
| component_mode : int | 'any' | 'all' | 'multi', default: 'all'
| Specify the component(s) to use when ``scalars`` is a multi-component array.
| Has no effect when the scalars have a single component. Must be one of:
|
| - number: specify the component number as a 0-indexed integer. The selected
| component must have the specified value(s).
| - ``'any'``: any single component can have the specified value(s).
| - ``'all'``: all individual components must have the specified values(s).
| - ``'multi'``: the entire multi-component item must have the specified value.
|
| invert : bool, default: False
| Invert the selection. If ``True`` values are selected which do *not* have
| the specified values.
|
| split : bool, default: False
| If ``True``, each value in ``values`` and each range in ``range`` is
| selected independently and returned as a :class:`~pyvista.MultiBlock`.
| The number of blocks returned equals the number of input values and ranges.
| The blocks may be named if a dictionary is used as input. See ``values``
| and ``ranges`` for details.
|
| .. note::
| Output blocks may contain meshes with only the ``fill_value`` if no
| values meet the selection criteria.
|
| See Also
| --------
| image_threshold
| Similar filter for thresholding :class:`~pyvista.ImageData`.
| :meth:`~pyvista.DataSetFilters.extract_values`
| Similar threshold-like filter for extracting values from any dataset.
| :meth:`~pyvista.DataSetFilters.split_values`
| Split a mesh by value into separate meshes.
| :meth:`~pyvista.DataSetFilters.threshold`
| Generalized thresholding filter which returns a :class:`~pyvista.UnstructuredGrid`.
|
| Returns
| -------
| output : pyvista.ImageData | pyvista.MultiBlock
| Image with selected values or a composite of meshes with selected
| values, depending on ``split``.
|
| Examples
| --------
| Load a CT image. Here we load
| :func:`~pyvista.examples.downloads.download_whole_body_ct_male`.
|
| >>> import pyvista as pv
| >>> from pyvista import examples
| >>> dataset = examples.download_whole_body_ct_male()
| >>> ct_image = dataset['ct']
|
| Show the initial data range.
|
| >>> ct_image.get_data_range()
| (np.int16(-1348), np.int16(3409))
|
| Select intensity values above ``150`` to select the bones.
|
| >>> bone_range = [150, float('inf')]
| >>> fill_value = -1000 # fill with intensity values corresponding to air
| >>> bone_image = ct_image.select_values(
| ... ranges=bone_range, fill_value=fill_value
| ... )
|
| Show the new data range.
|
| >>> bone_image.get_data_range()
| (np.int16(-1000), np.int16(3409))
|
| Plot the selected values. Use ``'foreground'`` opacity to make the fill value
| transparent and the selected values opaque.
|
| >>> pl = pv.Plotter()
| >>> _ = pl.add_volume(
| ... bone_image,
| ... opacity='foreground',
| ... cmap='bone',
| ... )
| >>> pl.view_zx()
| >>> pl.camera.up = (0, 0, 1)
| >>> pl.show()
|
| Use ``'replacement_value'`` to binarize the selected values instead. The fill
| value, or background, is ``0`` by default.
|
| >>> bone_mask = ct_image.select_values(ranges=bone_range, replacement_value=1)
| >>> bone_mask.get_data_range()
| (np.int16(0), np.int16(1))
|
| Generate a surface contour of the mask and plot it.
|
| >>> surf = bone_mask.contour_labels()
|
| >>> pl = pv.Plotter()
| >>> _ = pl.add_mesh(surf, color=True)
| >>> pl.view_zx()
| >>> pl.camera.up = (0, 0, 1)
| >>> pl.show()
|
| Load a color image. Here we load :func:`~pyvista.examples.downloads.download_beach`.
|
| >>> image = examples.download_beach()
| >>> plot_kwargs = dict(
| ... cpos='xy', rgb=True, lighting=False, zoom='tight', show_axes=False
| ... )
| >>> image.plot(**plot_kwargs)
|
| Select components from the image which have a strong red component.
| Use ``replacement_value`` to replace these pixels with a pure red color
| and ``fill_value`` to fill the rest of the image with white pixels.
|
| >>> white = [255, 255, 255]
| >>> red = [255, 0, 0]
| >>> red_range = [200, 255]
| >>> red_component = 0
| >>> selected = image.select_values(
| ... ranges=red_range,
| ... component_mode=red_component,
| ... replacement_value=red,
| ... fill_value=white,
| ... )
|
| >>> selected.plot(**plot_kwargs)
|
| slice_index(self: 'ImageData', i: 'int | VectorLike[int] | slice | None' = None, j: 'int | VectorLike[int] | slice | None' = None, k: 'int | VectorLike[int] | slice | None' = None, *, index_mode: "Literal['extent', 'dimensions']" = 'dimensions', strict_index: 'bool' = False, rebase_coordinates: 'bool' = False, progress_bar: 'bool' = False) -> 'ImageData'
| Extract a subset using IJK indices.
|
| This filter enables slicing :class:`~pyvista.ImageData` with Python-style indexing using
| IJK coordinates. It can be used to extract a single slice, multiple contiguous slices, or
| a volume of interest. Unlike other slicing filters, this filter returns
| :class:`~pyvista.ImageData`.
|
| .. note::
| Slicing by index is also possible using the "get index" operator ``[]``. See examples.
|
| .. versionadded::0.46
|
| Parameters
| ----------
| i, j, k : int | VectorLike[int] | slice, optional
| Indices to slice along the I, J, and K coordinate axes, respectively. Specify an
| integer for a single index, or two integers ``[start, stop)`` for a range of indices.
|
| .. note::
|
| Like regular Python slicing:
|
| - Half-open intervals are used, i.e. the ``start`` index is included in the range
| but the ``stop`` index is not.
| - Negative indexing is supported.
| - An ``IndexError`` is raised when a single integer is specified as the index and
| the index is out-of-bounds.
| - An ``IndexError`` is `not` raised when a range is specified as the index and
| the index is out-of-bounds. This default can be overridden by setting
| ``strict_index=True``.
| - A copy of the data is returned (modifying the sliced output does `not` affect
| the input data).
|
| index_mode : 'extent' | 'dimensions', default: 'dimensions'
| Mode to use when determining the range of values to index from.
|
| - Use ``'dimensions'`` to index values in the range ``[0, dimensions - 1]``.
| - Use ``'extent'`` to index values based on the :class:`~pyvista.ImageData.extent`,
| i.e. ``[offset, offset + dimensions - 1]``.
|
| The main difference between these modes is the inclusion or exclusion of the
| :attr:`~pyvista.ImageData.offset`. ``dimensions`` is more pythonic and is how the
| object's data arrays themselves would be indexed, whereas ``'extent'`` respects VTK's
| definition of ``extent`` and considers the object's geometry.
|
| strict_index : bool, default: False
| Raise an ``IndexError`` if `any` of the indices are out of range. By default, an
| ``IndexError`` is only raised if a single integer index is out of range, but not when
| a range of indices are specified; set this to ``True`` to raise in error in both cases.
|
| rebase_coordinates : bool, default: False
| Rebase the coordinate reference of the extracted subset:
|
| - the :attr:`~pyvista.ImageData.origin` is set to the minimum bounds of the subset
| - the :attr:`~pyvista.ImageData.offset` is reset to ``(0, 0, 0)``
|
| The rebasing effectively applies a positive translation in world (XYZ) coordinates and
| a similar (i.e. inverse) negative translation in voxel (IJK) coordinates. As a result,
| the :attr:`~pyvista.DataSet.bounds` of the output are unchanged, but the coordinate
| reference frame is modified.
|
| Set this to ``False`` to leave the origin unmodified and keep the offset specified by
| the indexing.
|
| progress_bar : bool, default: False
| Display a progress bar to indicate progress.
|
| Returns
| -------
| ImageData
| Sliced mesh.
|
| See Also
| --------
| crop
| extract_subset
| :meth:`~pyvista.DataObjectFilters.slice`
| :meth:`~pyvista.DataObjectFilters.slice_implicit`
| :meth:`~pyvista.DataObjectFilters.slice_orthogonal`
| :meth:`~pyvista.DataObjectFilters.slice_along_axis`
| :meth:`~pyvista.DataObjectFilters.slice_along_line`
|
| Examples
| --------
| Create a :class:`~pyvista.ImageData` mesh and give it some point data.
|
| >>> import pyvista as pv
| >>> mesh = pv.ImageData(dimensions=(10, 10, 10))
| >>> mesh['data'] = range(mesh.n_points)
|
| Extract a single slice along the k-axis.
|
| >>> sliced = mesh.slice_index(k=5)
| >>> sliced.dimensions
| (10, 10, 1)
|
| Equivalently:
|
| >>> sliced2 = mesh[:, :, 5]
| >>> sliced == sliced2
| True
|
| Extract a volume of interest.
|
| >>> sliced = mesh.slice_index(i=[1, 3], j=[2, 5], k=[5, 10])
| >>> sliced.dimensions
| (2, 3, 5)
|
| Equivalently:
|
| >>> sliced2 = mesh[1:3, 2:5, 5:10]
| >>> sliced == sliced2
| True
|
| Use ``None`` to implicitly define the start and/or stop indices.
|
| >>> sliced = mesh.slice_index(i=[None, 3], j=[2, None], k=None)
| >>> sliced.dimensions
| (3, 8, 10)
|
| Equivalently:
|
| >>> sliced2 = mesh[:3, 2:, :]
| >>> sliced == sliced2
| True
|
| See :ref:`slice_example` for more examples using this filter.
|
| ----------------------------------------------------------------------
| Methods inherited from pyvista.core.filters.data_set.DataSetFilters:
|
| __add__(self: '_DataSetType', dataset)
| Combine this mesh with another into a :class:`pyvista.UnstructuredGrid`.
|
| __iadd__(self: '_DataSetType', dataset)
| Merge another mesh into this one if possible.
|
| "If possible" means that ``self`` is a :class:`pyvista.UnstructuredGrid`.
| Otherwise we have to return a new object, and the attempted in-place
| merge will raise.
|
| align(self: '_DataSetType', target: 'DataSet | _vtk.vtkDataSet', max_landmarks: 'int' = 100, max_mean_distance: 'float' = 1e-05, max_iterations: 'int' = 500, check_mean_distance: 'bool' = True, start_by_matching_centroids: 'bool' = True, return_matrix: 'bool' = False)
| Align a dataset to another.
|
| Uses the iterative closest point algorithm to align the points of the
| two meshes. See the VTK class :vtk:`vtkIterativeClosestPointTransform`.
|
| Parameters
| ----------
| target : pyvista.DataSet
| The target dataset to align to.
|
| max_landmarks : int, default: 100
| The maximum number of landmarks.
|
| max_mean_distance : float, default: 1e-5
| The maximum mean distance for convergence.
|
| max_iterations : int, default: 500
| The maximum number of iterations.
|
| check_mean_distance : bool, default: True
| Whether to check the mean distance for convergence.
|
| start_by_matching_centroids : bool, default: True
| Whether to start the alignment by matching centroids. Default is True.
|
| return_matrix : bool, default: False
| Return the transform matrix as well as the aligned mesh.
|
| Returns
| -------
| aligned : pyvista.DataSet
| The dataset aligned to the target mesh.
|
| matrix : numpy.ndarray
| Transform matrix to transform the input dataset to the target dataset.
|
| See Also
| --------
| align_xyz
| Align a dataset to the x-y-z axes.
|
| Examples
| --------
| Create a cylinder, translate it, and use iterative closest point to
| align mesh to its original position.
|
| >>> import pyvista as pv
| >>> import numpy as np
| >>> source = pv.Cylinder(resolution=30).triangulate().subdivide(1)
| >>> transformed = source.rotate_y(20).translate([-0.75, -0.5, 0.5])
| >>> aligned = transformed.align(source)
| >>> _, closest_points = aligned.find_closest_cell(
| ... source.points, return_closest_point=True
| ... )
| >>> dist = np.linalg.norm(source.points - closest_points, axis=1)
|
| Visualize the source, transformed, and aligned meshes.
|
| >>> pl = pv.Plotter(shape=(1, 2))
| >>> _ = pl.add_text('Before Alignment')
| >>> _ = pl.add_mesh(source, style='wireframe', opacity=0.5, line_width=2)
| >>> _ = pl.add_mesh(transformed)
| >>> pl.subplot(0, 1)
| >>> _ = pl.add_text('After Alignment')
| >>> _ = pl.add_mesh(source, style='wireframe', opacity=0.5, line_width=2)
| >>> _ = pl.add_mesh(
| ... aligned,
| ... scalars=dist,
| ... scalar_bar_args={
| ... 'title': 'Distance to Source',
| ... 'fmt': '%.1E',
| ... },
| ... )
| >>> pl.show()
|
| Show that the mean distance between the source and the target is
| nearly zero.
|
| >>> np.abs(dist).mean() # doctest:+SKIP
| 9.997635192915073e-05
|
| See :ref:`icp_registration_example` for more examples using this filter.
|
| align_xyz(self: '_DataSetType', *, centered: 'bool' = True, axis_0_direction: 'VectorLike[float] | str | None' = None, axis_1_direction: 'VectorLike[float] | str | None' = None, axis_2_direction: 'VectorLike[float] | str | None' = None, cell_centers: 'bool' = False, merge_points: 'bool' = False, return_matrix: 'bool' = False)
| Align a dataset to the x-y-z axes.
|
| This filter aligns a mesh's :func:`~pyvista.principal_axes` to the world x-y-z
| axes. The principal axes are effectively used as a rotation matrix to rotate
| the dataset for the alignment. The transformation matrix used for the alignment
| can optionally be returned.
|
| Note that the transformation is not unique, since the signs of the principal
| axes are arbitrary. Consequently, applying this filter to similar meshes
| may result in dissimilar alignment (e.g. one axis may point up instead of down).
| To address this, the sign of one or two axes may optionally be "seeded" with a
| vector which approximates the axis or axes of the input. This can be useful
| for cases where the orientation of the input has a clear physical meaning.
|
| .. versionadded:: 0.45
|
| Parameters
| ----------
| centered : bool, default: True
| Center the mesh at the origin. If ``False``, the aligned dataset has the
| same center as the input.
|
| axis_0_direction : VectorLike[float] | str, optional
| Approximate direction vector of this mesh's primary axis prior to
| alignment. If set, this axis is flipped such that it best aligns with
| the specified vector. Can be a vector or string specifying the axis by
| name (e.g. ``'x'`` or ``'-x'``, etc.).
|
| axis_1_direction : VectorLike[float] | str, optional
| Approximate direction vector of this mesh's secondary axis prior to
| alignment. If set, this axis is flipped such that it best aligns with
| the specified vector. Can be a vector or string specifying the axis by
| name (e.g. ``'x'`` or ``'-x'``, etc.).
|
| axis_2_direction : VectorLike[float] | str, optional
| Approximate direction vector of this mesh's third axis prior to
| alignment. If set, this axis is flipped such that it best aligns with
| the specified vector. Can be a vector or string specifying the axis by
| name (e.g. ``'x'`` or ``'-x'``, etc.).
|
| cell_centers : bool, default: False
| Use the mesh's :meth:`~pyvista.DataObjectFilters.cell_centers` when
| computing the :func:`~pyvista.principal_axes`. Points not associated
| with cells are treated as vertex cells. By default, the mesh's
| points are used directly.
|
| .. versionadded:: 0.48
|
| merge_points : bool, default: False
| Merge coincident points with
| :meth:`~pyvista.DataSetFilters.merge_points` before computing the
| :func:`~pyvista.principal_axes`. Duplicate points can bias the
| principal axes, so enabling this can improve the alignment. By
| default the mesh's points are used as-is.
|
| .. note::
|
| Points are only merged for the alignment. The points of the
| returned mesh are *not* merged.
|
| .. versionadded:: 0.48
|
| return_matrix : bool, default: False
| Return the transform matrix as well as the aligned mesh.
|
| Returns
| -------
| pyvista.DataSet
| The dataset aligned to the x-y-z axes.
|
| numpy.ndarray
| Transform matrix to transform the input dataset to the x-y-z axes if
| ``return_matrix`` is ``True``.
|
| See Also
| --------
| pyvista.principal_axes
| Best-fit axes used by this filter for the alignment.
|
| align
| Align a source mesh to a target mesh using iterative closest point (ICP).
|
| Examples
| --------
| Create a dataset and align it to the x-y-z axes.
|
| >>> import pyvista as pv
| >>> from pyvista import examples
| >>> mesh = examples.download_oblique_cone()
| >>> aligned = mesh.align_xyz()
|
| Plot the aligned mesh along with the original. Show axes at the origin for
| context.
|
| >>> axes = pv.AxesAssembly(scale=aligned.length)
| >>> pl = pv.Plotter()
| >>> _ = pl.add_mesh(aligned)
| >>> _ = pl.add_mesh(mesh, style='wireframe', color='black', line_width=3)
| >>> _ = pl.add_actor(axes)
| >>> pl.show()
|
| Align the mesh but don't center it.
|
| >>> aligned = mesh.align_xyz(centered=False)
|
| Plot the result again. The aligned mesh has the same position as the input.
|
| >>> axes = pv.AxesAssembly(position=mesh.center, scale=aligned.length)
| >>> pl = pv.Plotter()
| >>> _ = pl.add_mesh(aligned)
| >>> _ = pl.add_mesh(mesh, style='wireframe', color='black', line_width=3)
| >>> _ = pl.add_actor(axes)
| >>> pl.show()
|
| Note how the tip of the cone is pointing along the z-axis. This indicates that
| the cone's axis is the third principal axis. It is also pointing in the negative
| z-direction. To control the alignment so that the cone points upward, we can
| seed an approximate direction specifying what "up" means for the original mesh
| in world coordinates prior to the alignment.
|
| We can see that the cone is originally pointing downward, somewhat in the
| negative z-direction. Therefore, we can specify the ``'-z'`` vector
| as the "up" direction of the mesh's third axis prior to alignment.
|
| >>> aligned = mesh.align_xyz(axis_2_direction='-z')
|
| Plot the mesh. The cone is now pointing upward in the desired direction.
|
| >>> axes = pv.AxesAssembly(scale=aligned.length)
| >>> pl = pv.Plotter()
| >>> _ = pl.add_mesh(aligned)
| >>> _ = pl.add_actor(axes)
| >>> pl.show()
|
| The specified direction only needs to be approximate. For example, we get the
| same result by specifying the ``'y'`` direction as the mesh's original "up"
| direction.
|
| >>> aligned, matrix = mesh.align_xyz(axis_2_direction='y', return_matrix=True)
| >>> axes = pv.AxesAssembly(scale=aligned.length)
| >>> pl = pv.Plotter()
| >>> _ = pl.add_mesh(aligned)
| >>> _ = pl.add_actor(axes)
| >>> pl.show()
|
| We can optionally return the transformation matrix.
|
| >>> aligned, matrix = mesh.align_xyz(axis_2_direction='y', return_matrix=True)
|
| The matrix can be inverted, for example, to transform objects from the world
| axes back to the original mesh's local coordinate system.
|
| >>> inverse = pv.Transform(matrix).inverse_matrix
|
| Use the inverse to label the object's axes prior to alignment. For actors,
| we set the :attr:`~pyvista.Prop3D.user_matrix` as the inverse.
|
| >>> axes_local = pv.AxesAssembly(
| ... scale=aligned.length,
| ... user_matrix=inverse,
| ... labels=["X'", "Y'", "Z'"],
| ... )
|
| Plot the original mesh with its local axes, along with the aligned mesh and its
| axes.
|
| >>> axes_aligned = pv.AxesAssembly(scale=aligned.length)
| >>> pl = pv.Plotter()
| >>> # Add aligned mesh with axes
| >>> _ = pl.add_mesh(aligned)
| >>> _ = pl.add_actor(axes_aligned)
| >>> # Add original mesh with axes
| >>> _ = pl.add_mesh(mesh, style='wireframe', color='black', line_width=3)
| >>> _ = pl.add_actor(axes_local)
| >>> pl.show()
|
| bounding_box(self: '_DataSetType', box_style: "Literal['frame', 'outline', 'face']" = 'face', *, oriented: 'bool' = False, frame_width: 'float' = 0.1, return_meta: 'bool' = False, as_composite: 'bool' = True)
| Return a bounding box for this dataset.
|
| By default, the box is an axis-aligned bounding box (AABB) returned as a
| :class:`~pyvista.MultiBlock` with six :class:`PolyData` comprising the faces of
| the box. The blocks are named and ordered as ``('+X','-X','+Y','-Y','+Z','-Z')``.
|
| The box can optionally be styled as an outline or frame. It may also be
| oriented to generate an oriented bounding box (OBB).
|
| .. versionadded:: 0.45
|
| Parameters
| ----------
| box_style : 'frame' | 'outline' | 'face', default: 'face'
| Choose the style of the box. If ``'face'`` (default), each face of the box
| is a single quad cell. If ``'outline'``, the edges of each face are returned
| as line cells. If ``'frame'``, the center portion of each face is removed to
| create a picture-frame style border with each face having four quads (one
| for each side of the frame). Use ``frame_width`` to control the size of the
| frame.
|
| oriented : bool, default: False
| Orient the box using this dataset's :func:`~pyvista.principal_axes`. This
| will generate a box that best fits this dataset's points. See
| :meth:`oriented_bounding_box` for more details.
|
| frame_width : float, optional
| Set the width of the frame. Only has an effect if ``box_style`` is
| ``'frame'``. Values must be between ``0.0`` (minimal frame) and ``1.0``
| (large frame). The frame is scaled to ensure it has a constant width.
|
| return_meta : bool, default: False
| If ``True``, also returns the corner point and the three axes vectors
| defining the orientation of the box.
|
| as_composite : bool, default: True
| Return the box as a :class:`pyvista.MultiBlock` with six blocks: one for
| each face. Set this ``False`` to merge the output and return
| :class:`~pyvista.PolyData` with six cells instead. The faces in both
| outputs are separate, i.e. there are duplicate points at the corners.
|
| See Also
| --------
| outline
| Lightweight version of this filter with fewer options.
|
| oriented_bounding_box
| Similar filter with ``oriented=True`` by default and more options.
|
| pyvista.Plotter.add_bounding_box
| Add a bounding box to a scene.
|
| pyvista.CubeFacesSource
| Generate the faces of a cube. Used internally by this filter.
|
| Returns
| -------
| output : pyvista.MultiBlock | pyvista.PolyData
| MultiBlock with six named cube faces when ``as_composite=True`` and
| PolyData otherwise.
|
| numpy.ndarray
| The box's corner point corresponding to the origin of its axes if
| ``return_meta=True``.
|
| numpy.ndarray
| The box's orthonormal axes vectors if ``return_meta=True``.
|
| Examples
| --------
| Create a bounding box for a dataset.
|
| >>> import pyvista as pv
| >>> from pyvista import examples
| >>> mesh = examples.download_oblique_cone()
| >>> box = mesh.bounding_box()
|
| Plot the mesh and its bounding box.
|
| >>> pl = pv.Plotter()
| >>> _ = pl.add_mesh(mesh, color='red')
| >>> _ = pl.add_mesh(box, opacity=0.5)
| >>> pl.show()
|
| Create a frame instead.
|
| >>> frame = mesh.bounding_box('frame')
|
| >>> pl = pv.Plotter()
| >>> _ = pl.add_mesh(mesh, color='red')
| >>> _ = pl.add_mesh(frame, show_edges=True)
| >>> pl.show()
|
| Create an oriented bounding box (OBB) and compare it to the non-oriented one.
| Use the outline style for both.
|
| >>> box = mesh.bounding_box('outline')
| >>> obb = mesh.bounding_box('outline', oriented=True)
|
| >>> pl = pv.Plotter()
| >>> _ = pl.add_mesh(mesh)
| >>> _ = pl.add_mesh(box, color='red', line_width=5)
| >>> _ = pl.add_mesh(obb, color='blue', line_width=5)
| >>> pl.show()
|
| Return the metadata for the box.
|
| >>> box, point, axes = mesh.bounding_box('outline', return_meta=True)
|
| Use the metadata to plot the box's axes using :class:`~pyvista.AxesAssembly`.
| Create the assembly and position it at the box's corner. Scale it to a fraction
| of the box's length.
|
| >>> scale = box.length / 4
| >>> axes_assembly = pv.AxesAssembly(position=point, scale=scale)
|
| Plot the box and the axes.
|
| >>> pl = pv.Plotter()
| >>> _ = pl.add_mesh(mesh)
| >>> _ = pl.add_mesh(box, color='black', line_width=5)
| >>> _ = pl.add_actor(axes_assembly)
| >>> _ = pl.view_yz()
| >>> pl.show()
|
| clip_scalar(self: '_DataSetType', scalars: 'str | None' = None, invert: 'bool' = True, value: 'float | VectorLike[float]' = 0.0, inplace: 'bool' = False, progress_bar: 'bool' = False, both: 'bool' = False)
| Clip a dataset by a scalar.
|
| Parameters
| ----------
| scalars : str, optional
| Name of scalars to clip on. Defaults to currently active scalars.
|
| invert : bool, default: True
| Flag on whether to flip/invert the clip. When ``True``,
| only the mesh below ``value`` will be kept. When
| ``False``, only values above ``value`` will be kept.
|
| value : float | VectorLike[float], default: 0.0
| Set the clipping value. Can also be set as a range of values.
| The range produces an output similar to an isovolume filter of Paraview.
|
| inplace : bool, default: False
| Update mesh in-place.
|
| progress_bar : bool, default: False
| Display a progress bar to indicate progress.
|
| both : bool, default: False
| If ``True``, also returns the complementary clipped mesh.
|
| Returns
| -------
| output : pyvista.PolyData | tuple
| Clipped dataset if ``both=False``. If ``both=True`` then
| returns a tuple of both clipped datasets.
|
| Examples
| --------
| Remove the part of the mesh with "sample_point_scalars" above 100.
|
| >>> import pyvista as pv
| >>> from pyvista import examples
| >>> dataset = examples.load_hexbeam()
| >>> clipped = dataset.clip_scalar(scalars='sample_point_scalars', value=100)
| >>> clipped.plot()
|
| Get clipped meshes corresponding to the portions of the mesh above and below 100.
|
| >>> import pyvista as pv
| >>> from pyvista import examples
| >>> dataset = examples.load_hexbeam()
| >>> _below, _above = dataset.clip_scalar(
| ... scalars='sample_point_scalars', value=100, both=True
| ... )
|
| Remove the part of the mesh with "sample_point_scalars" below 100.
|
| >>> import pyvista as pv
| >>> from pyvista import examples
| >>> dataset = examples.load_hexbeam()
| >>> clipped = dataset.clip_scalar(
| ... scalars='sample_point_scalars', value=100, invert=False
| ... )
| >>> clipped.plot()
|
| Clip the part of the mesh with "sample_point_scalars" between 200 and 250.
|
| >>> import pyvista as pv
| >>> from pyvista import examples
| >>> dataset = examples.load_hexbeam()
| >>> clipped = dataset.clip_scalar(
| ... scalars='sample_point_scalars', value=(200, 250)
| ... )
| >>> clipped.plot()
|
| .. seealso::
|
| :ref:`compare_threshold_filters_example`
| This example showcases this filter and
| other similar ones.
|
| clip_surface(self: '_DataSetType', surface: 'DataSet | _vtk.vtkDataSet', invert: 'bool' = True, value: 'float' = 0.0, compute_distance: 'bool' = False, progress_bar: 'bool' = False, crinkle: 'bool' = False)
| Clip any mesh type using a :class:`pyvista.PolyData` surface mesh.
|
| The clipped mesh type matches the input type for :class:`~pyvista.PointSet` and
| :class:`~pyvista.PolyData`, otherwise the output type is
| :class:`~pyvista.UnstructuredGrid`.
| Geometry of the input dataset will be preserved where possible.
| Geometries near the clip intersection will be triangulated/tessellated.
|
| Parameters
| ----------
| surface : pyvista.PolyData
| The ``PolyData`` surface mesh to use as a clipping
| function. If this input mesh is not a :class:`pyvista.PolyData`,
| the external surface will be extracted.
|
| invert : bool, default: True
| Flag on whether to flip/invert the clip.
|
| value : float, default: 0.0
| Set the clipping value of the implicit function (if
| clipping with implicit function) or scalar value (if
| clipping with scalars).
|
| compute_distance : bool, default: False
| Compute the implicit distance from the mesh onto the input
| dataset. A new array called ``'implicit_distance'`` will
| be added to the output clipped mesh.
|
| progress_bar : bool, default: False
| Display a progress bar to indicate progress.
|
| crinkle : bool, default: False
| Crinkle the clip by extracting the entire cells along the
| clip. This adds the ``"cell_ids"`` array to the ``cell_data``
| attribute that tracks the original cell IDs of the original
| dataset.
|
| Returns
| -------
| DataSet
| Clipped mesh. Output type matches input type for
| :class:`~pyvista.PointSet`, :class:`~pyvista.PolyData`, and
| :class:`~pyvista.MultiBlock`; otherwise the output type is
| :class:`~pyvista.UnstructuredGrid`.
|
| Examples
| --------
| Clip a cube with a sphere.
|
| >>> import pyvista as pv
| >>> sphere = pv.Sphere(center=(-0.4, -0.4, -0.4))
| >>> cube = pv.Cube().triangulate().subdivide(3)
| >>> clipped = cube.clip_surface(sphere)
| >>> clipped.plot(show_edges=True, cpos='xy', line_width=3)
|
| See :ref:`clip_with_surface_example` for more examples using
| this filter.
|
| color_labels(self: 'DataSet', colors: 'str | ColorLike | Sequence[ColorLike] | dict[float, ColorLike] | ColormapOptions' = 'glasbey_category10', *, coloring_mode: "Literal['index', 'cycle'] | None" = None, color_type: "Literal['int_rgb', 'float_rgb', 'int_rgba', 'float_rgba']" = 'int_rgb', negative_indexing: 'bool' = False, scalars: 'str | None' = None, preference: "Literal['point', 'cell']" = 'cell', output_scalars: 'str | None' = None, return_dict: 'bool' = False, inplace: 'bool' = False)
| Add RGB(A) scalars to labeled data.
|
| This filter adds a color array to map label values to specific colors.
| The mapping can be specified explicitly with a dictionary or implicitly
| with a colormap or sequence of colors. The implicit mapping is controlled
| with two coloring modes:
|
| - ``'index'`` : The input scalar values (label ids) are used as index values for
| indexing the specified ``colors``. This creates a direct relationship
| between labels and colors such that a given label will always have the same
| color, regardless of the number of labels present in the dataset.
|
| This option is used by default for unsigned 8-bit integer inputs, i.e.
| scalars with whole numbers and a maximum range of ``[0, 255]``.
|
| - ``'cycle'`` : The specified ``colors`` are cycled through sequentially,
| and each unique value in the input scalars is assigned a color in increasing
| order. Unlike with ``'index'`` mode, the colors are not directly mapped to
| the labels, but instead depends on the number of labels at the input.
|
| This option is used by default for floating-point inputs or for inputs
| with values out of the range ``[0, 255]``.
|
| By default, a new ``'int_rgb'`` array is added with the same name as the
| specified ``scalars`` but with ``_rgb`` appended.
|
| .. note::
| The package ``colorcet`` is required to use the default colors from the
| ``'glasbey_category10'`` colormap. For a similar, but very limited,
| alternative that does not require ``colorcet``, set ``colors='tab10'``
| and consider setting the coloring mode explicitly.
|
| .. versionadded:: 0.45
|
| See Also
| --------
| pyvista.DataSetFilters.connectivity
| Label data based on its connectivity.
|
| pyvista.ImageDataFilters.contour_labels
| Generate contours from labeled images. The contours may be colored with this filter.
|
| pack_labels
| Make labeled data contiguous. May be used as a pre-processing step before
| coloring.
|
| :ref:`anatomical_groups_example`
| Additional examples using this filter.
|
| Parameters
| ----------
| colors : str | ColorLike | Sequence[ColorLike] | dict[float, ColorLike],
| Color(s) to use. Specify a dictionary to explicitly control the mapping
| from label values to colors. Alternatively, specify colors only using a
| colormap or a sequence of colors and use ``coloring_mode`` to implicitly
| control the mapping. A single color is also supported to color the entire
| mesh with one color.
|
| By default,the ``'glasbey_category10'`` categorical colormap is used
| where the first 10 colors are the same default colors used by ``matplotlib``.
| See `colorcet categorical colormaps <https://colorcet.holoviz.org/user_guide/Categorical.html#>`_
| for more information.
|
| .. note::
| When a dictionary is specified, any scalar values for which a key is
| not provided is assigned default RGB(A) values of ``nan`` for float colors
| or ``0`` for integer colors (see ``color_type``). To ensure the color
| array has no default values, be sure to provide a mapping for any and
| all possible input label values.
|
| coloring_mode : 'index' | 'cycle', optional
| Control how colors are mapped to label values. Has no effect if ``colors``
| is a dictionary. Specify one of:
|
| - ``'index'``: The input scalar values (label ids) are used as index
| values for indexing the specified ``colors``.
| - ``'cycle'``: The specified ``colors`` are cycled through sequentially,
| and each unique value in the input scalars is assigned a color in increasing
| order. Colors are repeated if there are fewer colors than unique values
| in the input ``scalars``.
|
| By default, ``'index'`` mode is used if the values can be used to index
| the input ``colors``, and ``'cycle'`` mode is used otherwise.
|
| color_type : 'int_rgb' | 'float_rgb' | 'int_rgba' | 'float_rgba', default: 'int_rgb'
| Type of the color array to store. By default, the colors are stored as
| RGB integers to reduce memory usage.
|
| .. note::
| The color type affects the default value for unspecified colors when
| a dictionary is used. See ``colors`` for details.
|
| negative_indexing : bool, default: False
| Allow indexing ``colors`` with negative values. Only valid when
| ``coloring_mode`` is ``'index'``. This option is useful for coloring data
| with two independent categories since positive values will be colored
| differently than negative values.
|
| scalars : str, optional
| Name of scalars with labels. Defaults to currently active scalars.
|
| preference : str, default: "cell"
| When ``scalars`` is specified, this is the preferred array
| type to search for in the dataset. Must be either
| ``'point'`` or ``'cell'``.
|
| output_scalars : str, optional
| Name of the color scalars array. By default, the output array
| is the same as ``scalars`` with ``_rgb`` or ``_rgba`` appended
| depending on ``color_type``.
|
| return_dict : bool, default: False
| Return a dictionary with a mapping from label values to the
| colors applied by the filter. The colors have the same type
| specified by ``color_type``.
|
| .. versionadded:: 0.46
|
| inplace : bool, default: False
| If ``True``, the mesh is updated in-place.
|
| Returns
| -------
| pyvista.DataSet
| Dataset with RGB(A) scalars. Output type matches input type.
|
| Examples
| --------
| Load labeled data and crop it with :meth:`~pyvista.ImageDataFilters.extract_subset`
| to simplify the data.
|
| >>> import pyvista as pv
| >>> from pyvista import examples
| >>> import numpy as np
| >>> image_labels = examples.load_channels()
| >>> image_labels = image_labels.extract_subset(voi=(75, 109, 75, 109, 85, 100))
|
| Plot the dataset with default coloring using a categorical color map. The
| plotter by default uniformly samples from all 256 colors in the color map based
| on the data's range.
|
| >>> image_labels.plot(cmap='glasbey_category10')
|
| Show label ids of the dataset.
|
| >>> label_ids = np.unique(image_labels.active_scalars)
| >>> label_ids
| pyvista_ndarray([0, 1, 2, 3, 4])
|
| Color the labels with the filter. Note that the
| ``'glasbey_category10'`` color map is used by default.
|
| >>> colored_labels, color_dict = image_labels.color_labels(return_dict=True)
|
| Plot the labels. We define a helper function to include a legend with the plot.
|
| >>> def labels_plotter(mesh, color_dict):
| ... pl = pv.Plotter()
| ... pl.add_mesh(mesh)
| ... pl.add_legend(color_dict)
| ... return pl
|
| >>> labels_plotter(colored_labels, color_dict).show()
|
| Since the labels are unsigned integers, the ``'index'`` coloring mode is used
| by default. Unlike the uniform sampling used by the plotter in the previous
| plot, the colormap is instead indexed using the label values. This ensures
| that labels have a consistent coloring regardless of the input. For example,
| we can crop the dataset further.
|
| >>> subset_labels = image_labels.extract_subset(voi=(15, 34, 28, 34, 12, 15))
|
| And show that only three labels remain.
|
| >>> label_ids = np.unique(subset_labels.active_scalars)
| >>> label_ids
| pyvista_ndarray([1, 2, 3])
|
| Despite the changes to the dataset, the regions have the same coloring
| as before.
|
| >>> colored_labels, color_dict = subset_labels.color_labels(return_dict=True)
| >>> labels_plotter(colored_labels, color_dict).show()
|
| Use the ``'cycle'`` coloring mode instead to map label values to colors
| sequentially.
|
| >>> colored_labels, color_dict = subset_labels.color_labels(
| ... coloring_mode='cycle', return_dict=True
| ... )
| >>> labels_plotter(colored_labels, color_dict).show()
|
| Map the colors explicitly using a dictionary.
|
| >>> color_dict = {0: 'black', 1: 'red', 2: 'lime', 3: 'blue', 4: 'gold'}
| >>> colored_labels = image_labels.color_labels(color_dict)
| >>> labels_plotter(colored_labels, color_dict).show()
|
| Omit the background value from the mapping and specify float colors. When
| floats are specified, values without a mapping are assigned ``nan`` values
| and are not plotted by default.
|
| >>> color_dict.pop(0)
| 'black'
| >>> colored_labels = image_labels.color_labels(
| ... color_dict, color_type='float_rgba'
| ... )
| >>> labels_plotter(colored_labels, color_dict).show()
|
| Modify the scalars and make two of the labels negative.
|
| >>> scalars = image_labels.active_scalars
| >>> scalars[scalars > 2] *= -1
| >>> np.unique(scalars)
| pyvista_ndarray([-4, -3, 0, 1, 2])
|
| Color the mesh and enable ``negative_indexing``. With this option enabled,
| the ``'index'`` coloring mode is used by default, and therefore the positive
| values ``0``, ``1``, and ``2`` are colored with the first, second, and third
| color in the colormap, respectively. Negative values ``-3`` and ``-4`` are
| colored with the third-last and fourth-last color in the colormap, respectively.
|
| >>> colored_labels, color_dict = image_labels.color_labels(
| ... negative_indexing=True, return_dict=True
| ... )
| >>> labels_plotter(colored_labels, color_dict).show()
|
| If ``negative_indexing`` is disabled, the coloring defaults to the
| ``'cycle'`` coloring mode instead.
|
| >>> colored_labels, color_dict = image_labels.color_labels(
| ... negative_indexing=False, return_dict=True
| ... )
| >>> labels_plotter(colored_labels, color_dict).show()
|
| Load the :func:`~pyvista.examples.downloads.download_foot_bones` dataset.
|
| >>> dataset = examples.download_foot_bones()
|
| Label the bones using :meth:`~pyvista.DataSetFilters.connectivity` and show
| the label values.
|
| >>> labeled_data = dataset.connectivity()
| >>> np.unique(labeled_data.active_scalars)
| pyvista_ndarray([ 0, 1, 2, 3, 4, 5, 6, 7, 8, 9, 10, 11, 12, 13,
| 14, 15, 16, 17, 18, 19, 20, 21, 22, 23, 24, 25])
|
| Color the dataset with default arguments. Despite having 26 separately colored
| regions, the colors from the default glasbey-style colormap are all relatively
| distinct.
|
| >>> colored_labels = labeled_data.color_labels()
| >>> colored_labels.plot()
|
| Color the mesh with fewer colors than there are label values. In this case
| the ``'cycle'`` mode is used by default and the colors are reused.
|
| >>> colored_labels = labeled_data.color_labels(['red', 'lime', 'blue'])
| >>> colored_labels.plot()
|
| Color all labels with a single color.
|
| >>> colored_labels = labeled_data.color_labels('red')
| >>> colored_labels.plot()
|
| compute_boundary_mesh_quality(self: '_DataSetType', *, progress_bar: 'bool' = False)
| Compute metrics on the boundary faces of a mesh.
|
| The metrics that can be computed on the boundary faces of the mesh and are:
|
| - Distance from cell center to face center
| - Distance from cell center to face plane
| - Angle of faces plane normal and cell center to face center vector
|
| Parameters
| ----------
| progress_bar : bool, default: False
| Display a progress bar to indicate progress.
|
| Returns
| -------
| pyvista.DataSet
| Dataset with the computed metrics on the boundary faces of a mesh.
| ``cell_data`` as the ``"CellQuality"`` array.
|
| Examples
| --------
| >>> import pyvista as pv
| >>> from pyvista import examples
| >>> mesh = examples.download_can_crushed_vtu()
| >>> cqual = mesh.compute_boundary_mesh_quality()
| >>> pl = pv.Plotter(shape=(2, 2))
| >>> _ = pl.add_mesh(mesh, show_edges=True)
| >>> pl.subplot(1, 0)
| >>> _ = pl.add_mesh(cqual, scalars='DistanceFromCellCenterToFaceCenter')
| >>> pl.subplot(0, 1)
| >>> _ = pl.add_mesh(cqual, scalars='DistanceFromCellCenterToFacePlane')
| >>> pl.subplot(1, 1)
| >>> _ = pl.add_mesh(
| ... cqual,
| ... scalars='AngleFaceNormalAndCellCenterToFaceCenterVector',
| ... )
| >>> pl.show()
|
| compute_derivative(self: '_DataSetType', scalars: 'str | None' = None, gradient: 'bool | str' = True, divergence: 'bool | str' = False, vorticity: 'bool | str' = False, qcriterion: 'bool | str' = False, faster: 'bool' = False, preference: "Literal['point', 'cell']" = 'point', progress_bar: 'bool' = False)
| Compute derivative-based quantities of point/cell scalar field.
|
| Utilize :vtk:`vtkGradientFilter` to compute derivative-based quantities,
| such as gradient, divergence, vorticity, and Q-criterion, of the
| selected point or cell scalar field.
|
| Parameters
| ----------
| scalars : str, optional
| String name of the scalars array to use when computing the
| derivative quantities. Defaults to the active scalars in
| the dataset.
|
| gradient : bool | str, default: True
| Calculate gradient. If a string is passed, the string will be used
| for the resulting array name. Otherwise, array name will be
| ``'gradient'``. Default ``True``.
|
| divergence : bool | str, optional
| Calculate divergence. If a string is passed, the string will be
| used for the resulting array name. Otherwise, default array name
| will be ``'divergence'``.
|
| vorticity : bool | str, optional
| Calculate vorticity. If a string is passed, the string will be used
| for the resulting array name. Otherwise, default array name will be
| ``'vorticity'``.
|
| qcriterion : bool | str, optional
| Calculate qcriterion. If a string is passed, the string will be
| used for the resulting array name. Otherwise, default array name
| will be ``'qcriterion'``.
|
| faster : bool, default: False
| Use faster algorithm for computing derivative quantities. Result is
| less accurate and performs fewer derivative calculations,
| increasing computation speed. The error will feature smoothing of
| the output and possibly errors at boundaries. Option has no effect
| if DataSet is not :class:`pyvista.UnstructuredGrid`.
|
| preference : str, default: "point"
| Data type preference. Either ``'point'`` or ``'cell'``.
|
| progress_bar : bool, default: False
| Display a progress bar to indicate progress.
|
| Returns
| -------
| pyvista.DataSet
| Dataset with calculated derivative.
|
| Examples
| --------
| First, plot the random hills dataset with the active elevation
| scalars. These scalars will be used for the derivative
| calculations.
|
| >>> from pyvista import examples
| >>> hills = examples.load_random_hills()
| >>> hills.plot(smooth_shading=True)
|
| Compute and plot the gradient of the active scalars.
|
| >>> from pyvista import examples
| >>> hills = examples.load_random_hills()
| >>> deriv = hills.compute_derivative()
| >>> deriv.plot(scalars='gradient')
|
| See the :ref:`gradients_example` for more examples using this filter.
|
| compute_implicit_distance(self: '_DataSetType', surface: 'DataSet | _vtk.vtkDataSet', inplace: 'bool' = False)
| Compute the implicit distance from the points to a surface.
|
| This filter will compute the implicit distance from all of the
| nodes of this mesh to a given surface. This distance will be
| added as a point array called ``'implicit_distance'``.
|
| Nodes of this mesh which are interior to the input surface
| geometry have a negative distance, and nodes on the exterior
| have a positive distance. Nodes which intersect the input
| surface has a distance of zero.
|
| Parameters
| ----------
| surface : pyvista.DataSet
| The surface used to compute the distance.
|
| inplace : bool, default: False
| If ``True``, a new scalar array will be added to the
| ``point_data`` of this mesh and the modified mesh will
| be returned. Otherwise a copy of this mesh is returned
| with that scalar field added.
|
| Returns
| -------
| pyvista.DataSet
| Dataset containing the ``'implicit_distance'`` array in
| ``point_data``.
|
| See Also
| --------
| select_interior_points
|
| Examples
| --------
| Compute the distance between all the points on a sphere and a
| plane.
|
| >>> import pyvista as pv
| >>> sphere = pv.Sphere(radius=0.35)
| >>> plane = pv.Plane()
| >>> _ = sphere.compute_implicit_distance(plane, inplace=True)
| >>> dist = sphere['implicit_distance']
| >>> type(dist)
| <class 'pyvista.core.pyvista_ndarray.pyvista_ndarray'>
|
| Plot these distances as a heatmap. Note how distances above the
| plane are positive, and distances below the plane are negative.
|
| >>> pl = pv.Plotter()
| >>> _ = pl.add_mesh(sphere, scalars='implicit_distance', cmap='bwr')
| >>> _ = pl.add_mesh(plane, color='w', style='wireframe')
| >>> pl.show()
|
| We can also compute the distance from all the points on the
| plane to the sphere.
|
| >>> _ = plane.compute_implicit_distance(sphere, inplace=True)
|
| Again, we can plot these distances as a heatmap. Note how
| distances inside the sphere are negative and distances outside
| the sphere are positive.
|
| >>> pl = pv.Plotter()
| >>> _ = pl.add_mesh(
| ... plane,
| ... scalars='implicit_distance',
| ... cmap='bwr',
| ... clim=[-0.35, 0.35],
| ... )
| >>> _ = pl.add_mesh(sphere, color='w', style='wireframe')
| >>> pl.show()
|
| See :ref:`clip_with_surface_example` and
| :ref:`voxelize_example` for more examples using
| this filter.
|
| connectivity(self: '_DataSetType', extraction_mode: "Literal['all', 'largest', 'specified', 'cell_seed', 'point_seed', 'closest']" = 'all', variable_input: 'float | VectorLike[float] | None' = None, scalar_range: 'VectorLike[float] | None' = None, scalars: 'str | None' = None, label_regions: 'bool' = True, region_assignment_mode: "Literal['ascending', 'descending', 'unspecified']" = 'descending', region_ids: 'VectorLike[int] | None' = None, point_ids: 'VectorLike[int] | None' = None, cell_ids: 'VectorLike[int] | None' = None, closest_point: 'VectorLike[float] | None' = None, inplace: 'bool' = False, progress_bar: 'bool' = False, **kwargs)
| Find and label connected regions.
|
| This filter extracts cell regions based on a specified connectivity
| criterion. The extraction criterion can be controlled with
| ``extraction_mode`` to extract the largest region or the closest
| region to a seed point, for example.
|
| In general, cells are considered to be connected if they
| share a point. However, if a ``scalar_range`` is provided, cells
| must also have at least one point with scalar values in the
| specified range to be considered connected.
|
| See :ref:`connectivity_example` and :ref:`volumetric_analysis_example` for
| more examples using this filter.
|
| .. versionadded:: 0.43.0
|
| * New extraction modes: ``'specified'``, ``'cell_seed'``, ``'point_seed'``,
| and ``'closest'``.
| * Extracted regions are now sorted in descending order by
| cell count.
| * Region connectivity can be controlled using ``scalar_range``.
|
| .. deprecated:: 0.43.0
| Parameter ``largest`` is deprecated. Use ``'largest'`` or
| ``extraction_mode='largest'`` instead.
|
| Parameters
| ----------
| extraction_mode : str, default: "all"
| * ``'all'``: Extract all connected regions.
| * ``'largest'`` : Extract the largest connected region (by cell
| count).
| * ``'specified'``: Extract specific region IDs. Use ``region_ids``
| to specify the region IDs to extract.
| * ``'cell_seed'``: Extract all regions sharing the specified cell
| ids. Use ``cell_ids`` to specify the cell ids.
| * ``'point_seed'`` : Extract all regions sharing the specified
| point ids. Use ``point_ids`` to specify the point ids.
| * ``'closest'`` : Extract the region closest to the specified
| point. Use ``closest_point`` to specify the point.
|
| variable_input : float | sequence[float], optional
| The convenience parameter used for specifying any required input
| values for some values of ``extraction_mode``. Setting
| ``variable_input`` is equivalent to setting:
|
| * ``'region_ids'`` if mode is ``'specified'``.
| * ``'cell_ids'`` if mode is ``'cell_seed'``.
| * ``'point_ids'`` if mode is ``'point_seed'``.
| * ``'closest_point'`` if mode is ``'closest'``.
|
| It has no effect if the mode is ``'all'`` or ``'largest'``.
|
| scalar_range : sequence[float], optional
| Scalar range in the form ``[min, max]``. If set, the connectivity is
| restricted to cells with at least one point with scalar values in
| the specified range.
|
| scalars : str, optional
| Name of scalars to use if ``scalar_range`` is specified. Defaults
| to currently active scalars.
|
| .. note::
| This filter requires point scalars to determine region
| connectivity. If cell scalars are provided, they are first
| converted to point scalars with
| :func:`~pyvista.DataObjectFilters.cell_data_to_point_data`
| before applying the filter. The converted point scalars are
| removed from the output after applying the filter.
|
| label_regions : bool, default: True
| If ``True``, ``'RegionId'`` point and cell scalar arrays are stored.
| Each region is assigned a unique ID. IDs are zero-indexed and are
| assigned by region cell count in descending order (i.e. the largest
| region has ID ``0``).
|
| region_assignment_mode : str, default: "descending"
| Strategy used to assign connected region IDs if ``label_regions`` is True.
| Can be either:
|
| - ``"ascending"``: IDs are sorted by increasing order of cell count
| - ``"descending"``: IDs are sorted by decreasing order of cell counts
| - ``"unspecified"``: no particular order
|
| .. versionadded:: 0.47
|
| .. admonition:: ParaView compatibility
| :class: note dropdown
|
| The default value ``"descending"`` differs from ParaView's, which
| is set to ``"unspecified"`` (verified for 5.11 and 6.0 versions).
|
| region_ids : sequence[int], optional
| Region ids to extract. Only used if ``extraction_mode`` is
| ``specified``.
|
| point_ids : sequence[int], optional
| Point ids to use as seeds. Only used if ``extraction_mode`` is
| ``point_seed``.
|
| cell_ids : sequence[int], optional
| Cell ids to use as seeds. Only used if ``extraction_mode`` is
| ``cell_seed``.
|
| closest_point : sequence[int], optional
| Point coordinates in ``(x, y, z)``. Only used if
| ``extraction_mode`` is ``closest``.
|
| inplace : bool, default: False
| If ``True`` the mesh is updated in-place, otherwise a copy
| is returned. A copy is always returned if the input type is
| not ``pyvista.PolyData`` or ``pyvista.UnstructuredGrid``.
|
| progress_bar : bool, default: False
| Display a progress bar.
|
| **kwargs : dict, optional
| Used for handling deprecated parameters.
|
| Returns
| -------
| pyvista.DataSet
| Dataset with labeled connected regions. Return type is
| ``pyvista.PolyData`` if input type is ``pyvista.PolyData`` and
| ``pyvista.UnstructuredGrid`` otherwise.
|
| See Also
| --------
| extract_largest, split_bodies, threshold, extract_values
|
| Examples
| --------
| Create a single mesh with three disconnected regions where each
| region has a different cell count.
|
| >>> import numpy as np
| >>> import pyvista as pv
| >>> large = pv.Sphere(
| ... center=(-4, 0, 0), phi_resolution=40, theta_resolution=40
| ... )
| >>> medium = pv.Sphere(
| ... center=(-2, 0, 0), phi_resolution=15, theta_resolution=15
| ... )
| >>> small = pv.Sphere(center=(0, 0, 0), phi_resolution=7, theta_resolution=7)
| >>> mesh = large + medium + small
|
| Compute connectivity. There are three regions, one for each sphere.
|
| >>> conn = mesh.connectivity('all')
| >>> np.unique(conn['RegionId'])
| pyvista_ndarray([0, 1, 2])
|
| Plot the connectivity labels using :meth:`~pyvista.DataSetFilters.color_labels`.
|
| >>> def labels_plotter(dataset: pv.DataSet) -> pv.Plotter:
| ... rgb = ['red', 'green', 'blue']
| ... colored, color_dict = dataset.color_labels(rgb, return_dict=True)
| ... pl = pv.Plotter()
| ... pl.add_mesh(colored, show_edges=True)
| ... pl.add_legend(color_dict)
| ... pl.camera_position = pv.CameraPosition(
| ... position=(3.8, 5.8, 5.8),
| ... focal_point=(-2.0, 0.0, 0.0),
| ... viewup=(0.0, 0.0, 1.0),
| ... )
| ... return pl
| >>>
| >>> pl = labels_plotter(conn)
| >>> pl.show()
|
|
| Restrict connectivity to a scalar range.
|
| >>> mesh['y_coordinates'] = mesh.points[:, 1]
| >>> conn = mesh.connectivity('all', scalar_range=[-1, 0])
| >>> pl = labels_plotter(conn)
| >>> pl.show()
|
| Extract the region closest to the origin.
|
| >>> conn = mesh.connectivity('closest', (0, 0, 0))
| >>> pl = labels_plotter(conn)
| >>> pl.show()
|
| Extract a region using a cell ID ``3100`` as a seed.
|
| >>> conn = mesh.connectivity('cell_seed', 3100)
| >>> pl = labels_plotter(conn)
| >>> pl.show()
|
| Extract the largest region.
|
| >>> conn = mesh.connectivity('largest')
| >>> pl = labels_plotter(conn)
| >>> pl.show()
|
| Extract the largest and smallest regions by specifying their
| region IDs. Note that the region IDs of the output differ from
| the specified IDs since the input has three regions but the output
| only has two.
|
| >>> large_id = 0 # largest always has ID '0'
| >>> small_id = 2 # smallest has ID 'N-1' with N=3 regions
| >>> conn = mesh.connectivity('specified', (small_id, large_id))
| >>> pl = labels_plotter(conn)
| >>> pl.show()
|
| contour(self: '_DataSetType', isosurfaces: 'int | Sequence[float]' = 10, scalars: 'str | NumpyArray[float] | None' = None, compute_normals: 'bool' = False, compute_gradients: 'bool' = False, compute_scalars: 'bool' = True, rng: 'VectorLike[float] | None' = None, preference: "Literal['point', 'cell']" = 'point', method: "Literal['contour', 'marching_cubes', 'flying_edges']" = 'contour', progress_bar: 'bool' = False)
| Contour an input self by an array.
|
| ``isosurfaces`` can be an integer specifying the number of
| isosurfaces in the data range or a sequence of values for
| explicitly setting the isosurfaces.
|
| Parameters
| ----------
| isosurfaces : int | sequence[float], optional
| Number of isosurfaces to compute across valid data range or a
| sequence of float values to explicitly use as the isosurfaces.
|
| scalars : str | array_like[float], optional
| Name or array of scalars to threshold on. If this is an array, the
| output of this filter will save them as ``"Contour Data"``.
| Defaults to currently active scalars.
|
| compute_normals : bool, default: False
| Compute normals for the dataset.
|
| compute_gradients : bool, default: False
| Compute gradients for the dataset.
|
| compute_scalars : bool, default: True
| Preserves the scalar values that are being contoured.
|
| rng : sequence[float], optional
| If an integer number of isosurfaces is specified, this is
| the range over which to generate contours. Default is the
| scalars array's full data range.
|
| preference : str, default: "point"
| When ``scalars`` is specified, this is the preferred array
| type to search for in the dataset. Must be either
| ``'point'`` or ``'cell'``.
|
| method : str, default: "contour"
| Specify to choose which vtk filter is used to create the contour.
| Must be one of ``'contour'``, ``'marching_cubes'`` and
| ``'flying_edges'``.
|
| progress_bar : bool, default: False
| Display a progress bar to indicate progress.
|
| Returns
| -------
| pyvista.PolyData
| Contoured surface.
|
| Examples
| --------
| Generate contours for the random hills dataset.
|
| >>> from pyvista import examples
| >>> hills = examples.load_random_hills()
| >>> contours = hills.contour()
| >>> contours.plot(line_width=5)
|
| Generate the surface of a mobius strip using flying edges.
|
| >>> import pyvista as pv
| >>> a = 0.4
| >>> b = 0.1
| >>> def f(x, y, z):
| ... xx = x * x
| ... yy = y * y
| ... zz = z * z
| ... xyz = x * y * z
| ... xx_yy = xx + yy
| ... a_xx = a * xx
| ... b_yy = b * yy
| ... return (
| ... (xx_yy + 1) * (a_xx + b_yy)
| ... + zz * (b * xx + a * yy)
| ... - 2 * (a - b) * xyz
| ... - a * b * xx_yy
| ... ) ** 2 - 4 * (xx + yy) * (a_xx + b_yy - xyz * (a - b)) ** 2
| >>> n = 100
| >>> x_min, y_min, z_min = -1.35, -1.7, -0.65
| >>> grid = pv.ImageData(
| ... dimensions=(n, n, n),
| ... spacing=(
| ... abs(x_min) / n * 2,
| ... abs(y_min) / n * 2,
| ... abs(z_min) / n * 2,
| ... ),
| ... origin=(x_min, y_min, z_min),
| ... )
| >>> x, y, z = grid.points.T
| >>> values = f(x, y, z)
| >>> out = grid.contour(
| ... 1,
| ... scalars=values,
| ... rng=[0, 0],
| ... method='flying_edges',
| ... )
| >>> out.plot(color='lightblue', smooth_shading=True)
|
| See :ref:`using_filters_example`, :ref:`marching_cubes_example`, or
| :ref:`gyroid_example` for more examples using this
| filter.
|
| decimate_boundary(self: '_DataSetType', target_reduction: 'float' = 0.5, progress_bar: 'bool' = False)
| Return a decimated version of a triangulation of the boundary.
|
| Only the outer surface of the input dataset will be considered.
|
| Parameters
| ----------
| target_reduction : float, default: 0.5
| Fraction of the original mesh to remove.
| TargetReduction is set to ``0.9``, this filter will try to reduce
| the data set to 10% of its original size and will remove 90%
| of the input triangles.
|
| progress_bar : bool, default: False
| Display a progress bar to indicate progress.
|
| Returns
| -------
| pyvista.PolyData
| Decimated boundary.
|
| Examples
| --------
| See the :ref:`linked_views_example` example.
|
| delaunay_3d(self: '_DataSetType', alpha: 'float' = 0.0, tol: 'float' = 0.001, offset: 'float' = 2.5, progress_bar: 'bool' = False)
| Construct a 3D Delaunay triangulation of the mesh.
|
| This filter can be used to generate a 3D tetrahedral mesh from
| a surface or scattered points. If you want to create a
| surface from a point cloud, see
| :func:`pyvista.PolyDataFilters.reconstruct_surface`.
|
| Parameters
| ----------
| alpha : float, default: 0.0
| Distance value to control output of this filter. For a
| non-zero alpha value, only vertices, edges, faces, or
| tetrahedra contained within the circumsphere (of radius
| alpha) will be output. Otherwise, only tetrahedra will be
| output.
|
| tol : float, default: 0.001
| Tolerance to control discarding of closely spaced points.
| This tolerance is specified as a fraction of the diagonal
| length of the bounding box of the points.
|
| offset : float, default: 2.5
| Multiplier to control the size of the initial, bounding
| Delaunay triangulation.
|
| progress_bar : bool, default: False
| Display a progress bar to indicate progress.
|
| Returns
| -------
| pyvista.UnstructuredGrid
| UnstructuredGrid containing the Delaunay triangulation.
|
| Examples
| --------
| Generate a 3D Delaunay triangulation of a surface mesh of a
| sphere and plot the interior edges generated.
|
| >>> import pyvista as pv
| >>> sphere = pv.Sphere(theta_resolution=5, phi_resolution=5)
| >>> grid = sphere.delaunay_3d()
| >>> edges = grid.extract_all_edges()
| >>> edges.plot(line_width=5, color='k')
|
| See :ref:`convex_hull_example` for more examples using this filter.
|
| explode(self: '_DataSetType', factor: 'float' = 0.1)
| Push each individual cell away from the center of the dataset.
|
| Parameters
| ----------
| factor : float, default: 0.1
| How much each cell will move from the center of the dataset
| relative to its distance from it. Increase this number to push the
| cells farther away.
|
| Returns
| -------
| pyvista.UnstructuredGrid
| UnstructuredGrid containing the exploded cells.
|
| Notes
| -----
| This is similar to :func:`shrink <pyvista.DataSetFilters.shrink>`
| except that it does not change the size of the cells.
|
| Examples
| --------
| >>> import numpy as np
| >>> import pyvista as pv
| >>> xrng = np.linspace(0, 1, 3)
| >>> yrng = np.linspace(0, 2, 4)
| >>> zrng = np.linspace(0, 3, 5)
| >>> grid = pv.RectilinearGrid(xrng, yrng, zrng)
| >>> exploded = grid.explode()
| >>> exploded.plot(show_edges=True)
|
| extract_cells(self: '_DataSetType', ind: 'int | VectorLike[int]', invert: 'bool' = False, pass_cell_ids: 'bool' = True, pass_point_ids: 'bool' = True, progress_bar: 'bool' = False)
| Return a subset of the grid.
|
| Parameters
| ----------
| ind : int | VectorLike[int]
| Cell indices to extract. Can be a single int or a vector of ints.
| A bool vector is also supported; the vector size should match the number of cells.
|
| invert : bool, default: False
| Invert the selection.
|
| pass_point_ids : bool, default: True
| Add a point array ``'vtkOriginalPointIds'`` that identifies the original
| points the extracted points correspond to.
|
| .. versionadded:: 0.47
|
| pass_cell_ids : bool, default: True
| Add a cell array ``'vtkOriginalCellIds'`` that identifies the original cells
| the extracted cells correspond to.
|
| .. versionadded:: 0.47
|
| progress_bar : bool, default: False
| Display a progress bar to indicate progress.
|
| See Also
| --------
| extract_points, extract_values
|
| Returns
| -------
| pyvista.UnstructuredGrid
| Subselected grid.
|
| Examples
| --------
| >>> import pyvista as pv
| >>> from pyvista import examples
| >>> grid = pv.read(examples.hexbeamfile)
| >>> subset = grid.extract_cells(range(20))
| >>> subset.n_cells
| 20
| >>> pl = pv.Plotter()
| >>> actor = pl.add_mesh(grid, style='wireframe', line_width=5, color='black')
| >>> actor = pl.add_mesh(subset, color='grey')
| >>> pl.show()
|
| extract_cells_by_type(self: '_DataSetType', cell_types: 'int | VectorLike[int]', progress_bar: 'bool' = False)
| Extract cells of a specified type.
|
| Given an input dataset and a list of cell types, produce an output
| dataset containing only cells of the specified type(s). Note that if
| the input dataset is homogeneous (e.g., all cells are of the same type)
| and the cell type is one of the cells specified, then the input dataset
| is shallow copied to the output.
|
| The type of output dataset is always the same as the input type. Since
| structured types of data (i.e., :class:`pyvista.ImageData`,
| :class:`pyvista.StructuredGrid`, :class:`pyvista.RectilinearGrid`)
| are all composed of a cell of the same
| type, the output is either empty, or a shallow copy of the input.
| Unstructured data (:class:`pyvista.UnstructuredGrid`,
| :class:`pyvista.PolyData`) input may produce a subset of the input data
| (depending on the selected cell types).
|
| Parameters
| ----------
| cell_types : int | VectorLike[int]
| The cell types to extract. Must be a single or list of integer cell
| types. See :class:`pyvista.CellType`.
|
| progress_bar : bool, default: False
| Display a progress bar to indicate progress.
|
| Returns
| -------
| pyvista.DataSet
| Dataset with the extracted cells. Type is the same as the input.
|
| Notes
| -----
| Unlike :func:`pyvista.DataSetFilters.extract_cells` which always
| produces a :class:`pyvista.UnstructuredGrid` output, this filter
| produces the same output type as input type.
|
| Examples
| --------
| Create an unstructured grid with both hexahedral and tetrahedral
| cells and then extract each individual cell type.
|
| >>> import pyvista as pv
| >>> from pyvista import examples
| >>> beam = examples.load_hexbeam()
| >>> beam = beam.translate([1, 0, 0])
| >>> ugrid = beam + examples.load_tetbeam()
| >>> hex_cells = ugrid.extract_cells_by_type(pv.CellType.HEXAHEDRON)
| >>> tet_cells = ugrid.extract_cells_by_type(pv.CellType.TETRA)
| >>> pl = pv.Plotter(shape=(1, 2))
| >>> _ = pl.add_text('Extracted Hexahedron cells')
| >>> _ = pl.add_mesh(hex_cells, show_edges=True)
| >>> pl.subplot(0, 1)
| >>> _ = pl.add_text('Extracted Tetrahedron cells')
| >>> _ = pl.add_mesh(tet_cells, show_edges=True)
| >>> pl.show()
|
| extract_feature_edges(self: '_DataSetType', feature_angle: 'float' = 30.0, boundary_edges: 'bool' = True, non_manifold_edges: 'bool' = True, feature_edges: 'bool' = True, manifold_edges: 'bool' = True, clear_data: 'bool' = False, progress_bar: 'bool' = False) -> 'PolyData'
| Extract edges from the surface of the mesh.
|
| If the given mesh is not PolyData, the external surface of the given
| mesh is extracted and used.
|
| From vtk documentation, the edges are one of the following:
|
| 1) Boundary (used by one polygon) or a line cell.
| 2) Non-manifold (used by three or more polygons).
| 3) Feature edges (edges used by two triangles and whose
| dihedral angle > feature_angle).
| 4) Manifold edges (edges used by exactly two polygons).
|
| Parameters
| ----------
| feature_angle : float, default: 30.0
| Feature angle (in degrees) used to detect sharp edges on
| the mesh. Used only when ``feature_edges=True``.
|
| boundary_edges : bool, default: True
| Extract the boundary edges.
|
| non_manifold_edges : bool, default: True
| Extract non-manifold edges.
|
| feature_edges : bool, default: True
| Extract edges exceeding ``feature_angle``.
|
| manifold_edges : bool, default: True
| Extract manifold edges.
|
| clear_data : bool, default: False
| Clear any point, cell, or field data. This is useful
| if wanting to strictly extract the edges.
|
| progress_bar : bool, default: False
| Display a progress bar to indicate progress.
|
| Returns
| -------
| pyvista.PolyData
| Extracted edges.
|
| Examples
| --------
| Extract the edges from an unstructured grid.
|
| >>> import pyvista as pv
| >>> from pyvista import examples
| >>> hex_beam = pv.read(examples.hexbeamfile)
| >>> feat_edges = hex_beam.extract_feature_edges()
| >>> feat_edges.clear_data() # clear array data for plotting
| >>> feat_edges.plot(line_width=10)
|
| See the :ref:`extract_edges_example` for more examples using this filter.
|
| extract_geometry(self: '_DataSetType', extent: 'VectorLike[float] | None' = None, progress_bar: 'bool' = False) -> 'PolyData'
| Extract the outer surface of a volume or structured grid dataset.
|
| This will extract all 0D, 1D, and 2D cells producing the
| boundary faces of the dataset.
|
| .. deprecated:: 0.47.0
| Use :meth:`~pyvista.DataObjectFilters.extract_surface` instead
| with keyword `algorithm=None`.
|
| Parameters
| ----------
| extent : VectorLike[float], optional
| Specify a ``(x_min, x_max, y_min, y_max, z_min, z_max)`` bounding box to
| clip data.
|
| progress_bar : bool, default: False
| Display a progress bar to indicate progress.
|
| Returns
| -------
| pyvista.PolyData
| Surface of the dataset.
|
| Examples
| --------
| Extract the surface of a sample unstructured grid.
|
| >>> import pyvista as pv
| >>> from pyvista import examples
| >>> hex_beam = pv.read(examples.hexbeamfile)
| >>> hex_beam.extract_geometry() # doctest:+SKIP
| PolyData (...)
| N Cells: 88
| N Points: 90
| N Strips: 0
| X Bounds: 0.000e+00, 1.000e+00
| Y Bounds: 0.000e+00, 1.000e+00
| Z Bounds: 0.000e+00, 5.000e+00
| N Arrays: 3
|
| See :ref:`surface_smoothing_example` for more examples using this filter.
|
| extract_largest(self: '_DataSetType', inplace: 'bool' = False, progress_bar: 'bool' = False)
| Extract largest connected set in mesh.
|
| Can be used to reduce residues obtained when generating an
| isosurface. Works only if residues are not connected (share
| at least one point with) the main component of the image.
|
| Parameters
| ----------
| inplace : bool, default: False
| Updates mesh in-place.
|
| progress_bar : bool, default: False
| Display a progress bar to indicate progress.
|
| Returns
| -------
| pyvista.DataSet
| Largest connected set in the dataset. Return type matches input.
|
| Examples
| --------
| Join two meshes together, extract the largest, and plot it.
|
| >>> import pyvista as pv
| >>> mesh = pv.Sphere() + pv.Cube()
| >>> largest = mesh.extract_largest()
| >>> largest.plot()
|
| See :ref:`connectivity_example` and :ref:`volumetric_analysis_example` for
| more examples using this filter.
|
| .. seealso::
| :func:`pyvista.DataSetFilters.connectivity`
|
| extract_points(self: '_DataSetType', ind: 'int | VectorLike[int] | VectorLike[bool]', adjacent_cells: 'bool' = True, include_cells: 'bool' = True, pass_cell_ids: 'bool' = True, pass_point_ids: 'bool' = True, progress_bar: 'bool' = False)
| Return a subset of the grid (with cells) that contains any of the given point indices.
|
| Parameters
| ----------
| ind : sequence[int]
| Sequence of point indices to be extracted.
|
| adjacent_cells : bool, default: True
| If ``True``, extract the cells that contain at least one of
| the extracted points. If ``False``, extract the cells that
| contain exclusively points from the extracted points list.
| Has no effect if ``include_cells`` is ``False``.
|
| include_cells : bool, default: True
| Specifies if the cells shall be returned or not.
|
| pass_point_ids : bool, default: True
| Add a point array ``'vtkOriginalPointIds'`` that identifies the original
| points the extracted points correspond to.
|
| .. versionadded:: 0.47
|
| pass_cell_ids : bool, default: True
| Add a cell array ``'vtkOriginalCellIds'`` that identifies the original cells
| the extracted cells correspond to.
|
| .. versionadded:: 0.47
|
| progress_bar : bool, default: False
| Display a progress bar to indicate progress.
|
| See Also
| --------
| extract_cells, extract_values
|
| Returns
| -------
| pyvista.UnstructuredGrid
| Subselected grid.
|
| Examples
| --------
| Extract all the points of a sphere with a Z coordinate greater than 0
|
| >>> import pyvista as pv
| >>> sphere = pv.Sphere()
| >>> extracted = sphere.extract_points(
| ... sphere.points[:, 2] > 0, include_cells=False
| ... )
| >>> extracted.clear_data() # clear for plotting
| >>> extracted.plot()
|
| extract_values(self: '_DataSetType', values: 'float | VectorLike[float] | MatrixLike[float] | dict[str, float] | dict[float, str] | None' = None, *, ranges: 'VectorLike[float] | MatrixLike[float] | dict[str, VectorLike[float]] | dict[tuple[float, float], str] | None' = None, scalars: 'str | None' = None, preference: "Literal['point', 'cell']" = 'point', component_mode: "Literal['any', 'all', 'multi'] | int" = 'all', invert: 'bool' = False, adjacent_cells: 'bool' = True, include_cells: 'bool | None' = None, split: 'bool' = False, pass_point_ids: 'bool' = True, pass_cell_ids: 'bool' = True, progress_bar: 'bool' = False)
| Return a subset of the mesh based on the value(s) of point or cell data.
|
| Points and cells may be extracted with a single value, multiple values, a range
| of values, or any mix of values and ranges. This enables threshold-like
| filtering of data in a discontinuous manner to extract a single label or groups
| of labels from categorical data, or to extract multiple regions from continuous
| data. Extracted values may optionally be split into separate meshes.
|
| This filter operates on point data and cell data distinctly:
|
| **Point data**
|
| All cells with at least one point with the specified value(s) are returned.
| Optionally, set ``adjacent_cells`` to ``False`` to only extract points from
| cells where all points in the cell strictly have the specified value(s).
| In these cases, a point is only included in the output if that point is part
| of an extracted cell.
|
| Alternatively, set ``include_cells`` to ``False`` to exclude cells from
| the operation completely and extract all points with a specified value.
|
| **Cell Data**
|
| Only the cells (and their points) with the specified values(s) are included
| in the output.
|
| Internally, :meth:`~pyvista.DataSetFilters.extract_points` is called to extract
| points for point data, and :meth:`~pyvista.DataSetFilters.extract_cells` is
| called to extract cells for cell data.
|
| By default, two arrays are included with the output: ``'vtkOriginalPointIds'``
| and ``'vtkOriginalCellIds'``. These arrays can be used to link the filtered
| points or cells directly to the input.
|
| .. versionadded:: 0.44
|
| Parameters
| ----------
| values : float | ArrayLike[float] | dict, optional
| Value(s) to extract. Can be a number, an iterable of numbers, or a dictionary
| with numeric entries. For ``dict`` inputs, either its keys or values may be
| numeric, and the other field must be strings. The numeric field is used as
| the input for this parameter, and if ``split`` is ``True``, the string field
| is used to set the block names of the returned :class:`~pyvista.MultiBlock`.
|
| .. note::
| When extracting multi-component values with ``component_mode=multi``,
| each value is specified as a multi-component scalar. In this case,
| ``values`` can be a single vector or an array of row vectors.
|
| ranges : ArrayLike[float] | dict, optional
| Range(s) of values to extract. Can be a single range (i.e. a sequence of
| two numbers in the form ``[lower, upper]``), a sequence of ranges, or a
| dictionary with range entries. Any combination of ``values`` and ``ranges``
| may be specified together. The endpoints of the ranges are included in the
| extraction. Ranges cannot be set when ``component_mode=multi``.
|
| For ``dict`` inputs, either its keys or values may be numeric, and the other
| field must be strings. The numeric field is used as the input for this
| parameter, and if ``split`` is ``True``, the string field is used to set the
| block names of the returned :class:`~pyvista.MultiBlock`.
|
| .. note::
| Use ``+/-`` infinity to specify an unlimited bound, e.g.:
|
| - ``[0, float('inf')]`` to extract values greater than or equal to zero.
| - ``[float('-inf'), 0]`` to extract values less than or equal to zero.
|
| scalars : str, optional
| Name of scalars to extract with. Defaults to currently active scalars.
|
| preference : str, default: 'point'
| When ``scalars`` is specified, this is the preferred array type to search
| for in the dataset. Must be either ``'point'`` or ``'cell'``.
|
| component_mode : int | 'any' | 'all' | 'multi', default: 'all'
| Specify the component(s) to use when ``scalars`` is a multi-component array.
| Has no effect when the scalars have a single component. Must be one of:
|
| - number: specify the component number as a 0-indexed integer. The selected
| component must have the specified value(s).
| - ``'any'``: any single component can have the specified value(s).
| - ``'all'``: all individual components must have the specified values(s).
| - ``'multi'``: the entire multi-component item must have the specified value.
|
| invert : bool, default: False
| Invert the extraction values. If ``True`` extract the points (with cells)
| which do *not* have the specified values.
|
| adjacent_cells : bool, default: True
| If ``True``, include cells (and their points) that contain at least one of
| the extracted points. If ``False``, only include cells that contain
| exclusively points from the extracted points list. Has no effect if
| ``include_cells`` is ``False``. Has no effect when extracting values from
| cell data.
|
| include_cells : bool, default: None
| Specify if cells shall be used for extraction or not. If ``False``, points
| with the specified values are extracted regardless of their cell
| connectivity, and all cells at the output will be vertex cells (one for each
| point.) Has no effect when extracting values from cell data.
|
| By default, this value is ``True`` if the input has at least one cell and
| ``False`` otherwise.
|
| split : bool, default: False
| If ``True``, each value in ``values`` and each range in ``range`` is
| extracted independently and returned as a :class:`~pyvista.MultiBlock`.
| The number of blocks returned equals the number of input values and ranges.
| The blocks may be named if a dictionary is used as input. See ``values``
| and ``ranges`` for details.
|
| .. note::
| Output blocks may contain empty meshes if no values meet the extraction
| criteria. This can impact plotting since empty meshes cannot be plotted
| by default. Use :meth:`pyvista.MultiBlock.clean` on the output to remove
| empty meshes, or set ``pv.global_theme.allow_empty_mesh = True`` to
| enable plotting empty meshes.
|
| pass_point_ids : bool, default: True
| Add a point array ``'vtkOriginalPointIds'`` that identifies the original
| points the extracted points correspond to.
|
| pass_cell_ids : bool, default: True
| Add a cell array ``'vtkOriginalCellIds'`` that identifies the original cells
| the extracted cells correspond to.
|
| progress_bar : bool, default: False
| Display a progress bar to indicate progress.
|
| See Also
| --------
| split_values
| Wrapper around this filter to split values and return a :class:`~pyvista.MultiBlock`.
| :meth:`~pyvista.ImageDataFilters.select_values`
| Similar filter specialized for :class:`~pyvista.ImageData`.
| extract_points
| Extract a subset of a mesh's points.
| extract_cells
| Extract a subset of a mesh's cells.
| threshold
| Similar filter for thresholding a mesh by value.
| partition
| Split a mesh into a number of sub-parts.
| :ref:`compare_threshold_filters_example`
| This example showcases this filter and
| other similar ones.
|
| Returns
| -------
| output : pyvista.UnstructuredGrid | pyvista.MultiBlock
| An extracted mesh or a composite of extracted meshes, depending on ``split``.
|
| Examples
| --------
| Extract a single value from a grid's point data.
|
| >>> import numpy as np
| >>> import pyvista as pv
| >>> from pyvista import examples
| >>> mesh = examples.load_uniform()
| >>> extracted = mesh.extract_values(0)
|
| Plot extracted values. Since adjacent cells are included by default, points with
| values other than ``0`` are included in the output.
|
| >>> extracted.get_data_range()
| (np.float64(0.0), np.float64(81.0))
| >>> extracted.plot()
|
| Set ``include_cells=False`` to only extract points. The output scalars now
| strictly contain zeros.
|
| >>> extracted = mesh.extract_values(0, include_cells=False)
| >>> extracted.get_data_range()
| (np.float64(0.0), np.float64(0.0))
| >>> extracted.plot(render_points_as_spheres=True, point_size=100, color=True)
|
| Use ``ranges`` to extract values from a grid's point data in range.
|
| Here, we use ``+/-`` infinity to extract all values of ``100`` or less.
|
| >>> extracted = mesh.extract_values(ranges=[-np.inf, 100])
| >>> extracted.plot()
|
| Extract every third cell value from cell data.
|
| >>> mesh = examples.load_hexbeam()
| >>> lower, upper = mesh.get_data_range()
| >>> step = 3
| >>> extracted = mesh.extract_values(
| ... range(lower, upper, step) # values 0, 3, 6, ...
| ... )
|
| Plot result and show an outline of the input for context.
|
| >>> pl = pv.Plotter()
| >>> _ = pl.add_mesh(extracted)
| >>> _ = pl.add_mesh(mesh.extract_all_edges())
| >>> pl.show()
|
| Any combination of values and ranges may be specified.
|
| E.g. extract a single value and two ranges, and split the result into separate
| blocks of a MultiBlock.
|
| >>> extracted = mesh.extract_values(
| ... values=18, ranges=[[0, 8], [29, 40]], split=True
| ... )
| >>> extracted
| MultiBlock (...)
| N Blocks: 3
| X Bounds: 0.000e+00, 1.000e+00
| Y Bounds: 0.000e+00, 1.000e+00
| Z Bounds: 0.000e+00, 5.000e+00
| >>> extracted.plot(multi_colors=True)
|
| Extract values from multi-component scalars.
|
| First, create a point cloud with a 3-component RGB color array.
|
| >>> rng = np.random.default_rng(seed=1)
| >>> points = rng.random((30, 3))
| >>> colors = rng.random((30, 3))
| >>> point_cloud = pv.PointSet(points)
| >>> point_cloud['colors'] = colors
| >>> plot_kwargs = dict(render_points_as_spheres=True, point_size=50, rgb=True)
| >>> point_cloud.plot(**plot_kwargs)
|
| Extract values from a single component.
|
| E.g. extract points with a strong red component (i.e. > 0.8).
|
| >>> extracted = point_cloud.extract_values(ranges=[0.8, 1.0], component_mode=0)
| >>> extracted.plot(**plot_kwargs)
|
| Extract values from all components.
|
| E.g. extract points where all RGB components are dark (i.e. < 0.5).
|
| >>> extracted = point_cloud.extract_values(
| ... ranges=[0.0, 0.5], component_mode='all'
| ... )
| >>> extracted.plot(**plot_kwargs)
|
| Extract specific multi-component values.
|
| E.g. round the scalars to create binary RGB components, and extract only green
| and blue components.
|
| >>> point_cloud['colors'] = np.round(point_cloud['colors'])
| >>> green = [0, 1, 0]
| >>> blue = [0, 0, 1]
| >>>
| >>> extracted = point_cloud.extract_values(
| ... values=[blue, green],
| ... component_mode='multi',
| ... )
| >>> extracted.plot(**plot_kwargs)
|
| Use the original IDs returned by the extraction to modify the original point
| cloud.
|
| For example, change the color of the blue and green points to yellow.
|
| >>> point_ids = extracted['vtkOriginalPointIds']
| >>> yellow = [1, 1, 0]
| >>> point_cloud['colors'][point_ids] = yellow
| >>> point_cloud.plot(**plot_kwargs)
|
| gaussian_splatting(self: '_DataSetType', *, radius: 'float' = 0.1, dimensions: 'VectorLike[int]' = (50, 50, 50), progress_bar: 'bool' = False)
| Splat points into a volume using a Gaussian distribution.
|
| This filter uses :vtk:`vtkGaussianSplatter` to splat points into a volume
| dataset. Each point is surrounded with a Gaussian distribution function
| weighted by input scalar data. The distribution function is volumetrically
| sampled to create a structured dataset.
|
| .. versionadded:: 0.46
|
| Parameters
| ----------
| radius : float, default: 0.1
| This value is expressed as a percentage of the length of the longest side of
| the sampling volume. This determines the "width" of the splatter in
| terms of the distribution. Smaller numbers greatly reduce execution time.
|
| dimensions : VectorLike[int], default: (50, 50, 50)
| Sampling dimensions of the structured point set. Higher values produce better
| results but are much slower. This is the :attr:`~pyvista.ImageData.dimensions`
| of the returned :class:`~pyvista.ImageData`.
|
| progress_bar : bool, default: False
| Display a progress bar to indicate progress.
|
| Returns
| -------
| pyvista.ImageData
| Image data with scalar values representing the splatting
| of the points.
|
| See Also
| --------
| voxelize_binary_mask
| Alternative method for generating :class:`~pyvista.ImageData` from a dataset.
|
| Examples
| --------
| Create an image data volume from a point cloud using gaussian splatter.
|
| >>> import pyvista as pv
|
| Load the Stanford Bunny mesh.
|
| >>> bunny = pv.examples.download_bunny()
|
| Apply Gaussian splatter to generate a volumetric representation.
|
| >>> volume = bunny.gaussian_splatting(radius=0.01)
|
| Threshold the volume to filter out low-density regions.
|
| >>> threshed = volume.threshold(0.05)
|
| Visualize the thresholded volume with semi-transparency and no scalar bar.
|
| >>> threshed.plot(opacity=0.5, show_scalar_bar=False)
|
| glyph(self: '_DataSetType', orient: 'bool | str' = True, scale: 'bool | str' = True, factor: 'float' = 1.0, geom: '_vtk.vtkDataSet | DataSet | Sequence[_vtk.vtkDataSet | DataSet] | None' = None, indices: 'VectorLike[int] | None' = None, tolerance: 'float | None' = None, absolute: 'bool' = False, clamping: 'bool' = False, rng: 'VectorLike[float] | None' = None, color_mode: "Literal['scale', 'scalar', 'vector']" = 'scale', progress_bar: 'bool' = False)
| Copy a geometric representation (called a glyph) to the input dataset.
|
| The glyph may be oriented along the input vectors, and it may
| be scaled according to scalar data or vector
| magnitude. Passing a table of glyphs to choose from based on
| scalars or vector magnitudes is also supported. The arrays
| used for ``orient`` and ``scale`` must be either both point data
| or both cell data.
|
| Parameters
| ----------
| orient : bool | str, default: True
| If ``True``, use the active vectors array to orient the glyphs.
| If string, the vector array to use to orient the glyphs.
| If ``False``, the glyphs will not be orientated.
|
| scale : bool | str | sequence[float], default: True
| If ``True``, use the active scalars to scale the glyphs.
| If string, the scalar array to use to scale the glyphs.
| If ``False``, the glyphs will not be scaled.
|
| factor : float, default: 1.0
| Scale factor applied to scaling array.
|
| geom : :vtk:`vtkDataSet` | tuple[:vtk:`vtkDataSet`], optional
| The geometry to use for the glyph. If missing, an arrow glyph
| is used. If a sequence, the datasets inside define a table of
| geometries to choose from based on scalars or vectors. In this
| case a sequence of numbers of the same length must be passed as
| ``indices``. The values of the range (see ``rng``) affect lookup
| in the table.
|
| .. note::
|
| The reference direction is relative to ``(1, 0, 0)`` on the
| provided geometry. That is, the provided geometry will be rotated
| from ``(1, 0, 0)`` to the direction of the ``orient`` vector at
| each point.
|
| indices : sequence[float], optional
| Specifies the index of each glyph in the table for lookup in case
| ``geom`` is a sequence. If given, must be the same length as
| ``geom``. If missing, a default value of ``range(len(geom))`` is
| used. Indices are interpreted in terms of the scalar range
| (see ``rng``). Ignored if ``geom`` has length 1.
|
| tolerance : float, optional
| Specify tolerance in terms of fraction of bounding box length.
| Float value is between 0 and 1. Default is None. If ``absolute``
| is ``True`` then the tolerance can be an absolute distance.
| If ``None``, points merging as a preprocessing step is disabled.
|
| absolute : bool, default: False
| Control if ``tolerance`` is an absolute distance or a fraction.
|
| clamping : bool, default: False
| Turn on/off clamping of "scalar" values to range.
|
| rng : sequence[float], optional
| Set the range of values to be considered by the filter
| when scalars values are provided.
|
| color_mode : str, optional, default: ``'scale'``
| If ``'scale'`` , color the glyphs by scale.
| If ``'scalar'`` , color the glyphs by scalar.
| If ``'vector'`` , color the glyphs by vector.
|
| .. versionadded:: 0.44
|
| progress_bar : bool, default: False
| Display a progress bar to indicate progress.
|
| Returns
| -------
| pyvista.PolyData
| Glyphs at either the cell centers or points.
|
| Examples
| --------
| Create arrow glyphs oriented by vectors and scaled by scalars.
| Factor parameter is used to reduce the size of the arrows.
|
| >>> import pyvista as pv
| >>> from pyvista import examples
| >>> mesh = examples.load_random_hills()
| >>> arrows = mesh.glyph(scale='Normals', orient='Normals', tolerance=0.05)
| >>> pl = pv.Plotter()
| >>> actor = pl.add_mesh(arrows, color='black')
| >>> actor = pl.add_mesh(
| ... mesh,
| ... scalars='Elevation',
| ... cmap='terrain',
| ... show_scalar_bar=False,
| ... )
| >>> pl.show()
|
| See :ref:`glyph_example`, :ref:`movie_glyphs_example`, and
| :ref:`glyph_table_example` for more examples using this filter.
|
| integrate_data(self: '_DataSetType', progress_bar: 'bool' = False)
| Integrate point and cell data.
|
| Area or volume is also provided in point data.
|
| This filter uses :vtk:`vtkIntegrateAttributes`.
|
| Parameters
| ----------
| progress_bar : bool, default: False
| Display a progress bar to indicate progress.
|
| Returns
| -------
| pyvista.UnstructuredGrid
| Mesh with 1 point and 1 vertex cell with integrated data in point
| and cell data.
|
| Examples
| --------
| Integrate data on a sphere mesh.
|
| >>> import pyvista as pv
| >>> import numpy as np
| >>> sphere = pv.Sphere(theta_resolution=100, phi_resolution=100)
| >>> sphere.point_data['data'] = 2 * np.ones(sphere.n_points)
| >>> integrated = sphere.integrate_data()
|
| There is only 1 point and cell, so access the only value.
|
| >>> integrated['Area'][0]
| np.float64(3.14)
| >>> integrated['data'][0]
| np.float64(6.28)
|
| See the :ref:`integrate_data_example` for more examples using this filter.
|
| interpolate(self: '_DataSetType', target: 'DataSet | _vtk.vtkDataSet', sharpness: 'float' = 2.0, radius: 'float' = 1.0, strategy: "Literal['null_value', 'mask_points', 'closest_point']" = 'null_value', null_value: 'float' = 0.0, n_points: 'int | None' = None, pass_cell_data: 'bool' = True, pass_point_data: 'bool' = True, progress_bar: 'bool' = False)
| Interpolate values onto this mesh from a given dataset.
|
| The ``target`` dataset is typically a point cloud. Only point data from
| the ``target`` mesh will be interpolated onto points of this mesh. Whether
| preexisting point and cell data of this mesh are preserved in the
| output can be customized with the ``pass_point_data`` and
| ``pass_cell_data`` parameters.
|
| This uses a Gaussian interpolation kernel. Use the ``sharpness`` and
| ``radius`` parameters to adjust this kernel. You can also switch this
| kernel to use an N closest points approach.
|
| If the cell topology is more useful for interpolating, e.g. from a
| discretized FEM or CFD simulation, use
| :func:`pyvista.DataObjectFilters.sample` instead.
|
| Parameters
| ----------
| target : pyvista.DataSet
| The vtk data object to sample from. Point and cell arrays from
| this object are interpolated onto this mesh.
|
| sharpness : float, default: 2.0
| Set the sharpness (i.e., falloff) of the Gaussian kernel. As the
| sharpness increases the effects of distant points are reduced.
|
| radius : float, optional
| Specify the radius within which the basis points must lie.
|
| strategy : str, default: "null_value"
| Specify a strategy to use when encountering a "null" point during
| the interpolation process. Null points occur when the local
| neighborhood (of nearby points to interpolate from) is empty. If
| the strategy is set to ``'mask_points'``, then an output array is
| created that marks points as being valid (=1) or null (invalid =0)
| (and the NullValue is set as well). If the strategy is set to
| ``'null_value'``, then the output data value(s) are set to the
| ``null_value`` (specified in the output point data). Finally, the
| strategy ``'closest_point'`` is to simply use the closest point to
| perform the interpolation.
|
| null_value : float, default: 0.0
| Specify the null point value. When a null point is encountered
| then all components of each null tuple are set to this value.
|
| n_points : int, optional
| If given, specifies the number of the closest points used to form
| the interpolation basis. This will invalidate the radius argument
| in favor of an N closest points approach. This typically has poorer
| results.
|
| pass_cell_data : bool, default: True
| Preserve input mesh's original cell data arrays.
|
| pass_point_data : bool, default: True
| Preserve input mesh's original point data arrays.
|
| progress_bar : bool, default: False
| Display a progress bar to indicate progress.
|
| Returns
| -------
| pyvista.DataSet
| Interpolated dataset. Return type matches input.
|
| See Also
| --------
| pyvista.DataObjectFilters.sample
| Resample array data from one mesh onto another.
|
| :meth:`pyvista.ImageDataFilters.resample`
| Resample image data to modify its dimensions and spacing.
|
| Examples
| --------
| Interpolate the values of 5 points onto a sample plane.
|
| >>> import pyvista as pv
| >>> import numpy as np
| >>> rng = np.random.default_rng(7)
| >>> point_cloud = rng.random((5, 3))
| >>> point_cloud[:, 2] = 0
| >>> point_cloud -= point_cloud.mean(0)
| >>> pdata = pv.PolyData(point_cloud)
| >>> pdata['values'] = rng.random(5)
| >>> plane = pv.Plane()
| >>> plane.clear_data()
| >>> plane = plane.interpolate(pdata, sharpness=3)
| >>> pl = pv.Plotter()
| >>> _ = pl.add_mesh(pdata, render_points_as_spheres=True, point_size=50)
| >>> _ = pl.add_mesh(plane, style='wireframe', line_width=5)
| >>> pl.show()
|
| See :ref:`interpolate_example`, :ref:`interpolate_sample_example`,
| and :ref:`resampling_example` for more examples using this filter.
|
| merge(self: '_DataSetType', grid: 'DataSet | _vtk.vtkDataSet | MultiBlock | Sequence[DataSet | _vtk.vtkDataSet] | None' = None, merge_points: 'bool' = True, tolerance: 'float' = 0.0, inplace: 'bool' = False, main_has_priority: 'bool | None' = None, progress_bar: 'bool' = False)
| Join one or many other grids to this grid.
|
| Can be used to merge points of adjacent cells when no grids
| are input.
|
| .. note::
| The ``+`` operator between two meshes uses this filter with
| the default parameters. When the target mesh is already a
| :class:`pyvista.UnstructuredGrid`, in-place merging via
| ``+=`` is similarly possible.
|
|
| .. warning::
|
| The merge order of this filter depends on the installed version
| of VTK. For example, if merging meshes ``a``, ``b``, and ``c``,
| the merged order is ``bca`` for VTK<9.5 and ``abc`` for VTK>=9.5.
| This may be a breaking change for some applications. If only
| merging two meshes, it may be possible to maintain `some` backwards
| compatibility by swapping the input order of the two meshes,
| though this may also affect the merged arrays and is therefore
| not fully backwards-compatible.
|
| Parameters
| ----------
| grid : :vtk:`vtkUnstructuredGrid` | list[:vtk:`vtkUnstructuredGrid`], optional
| Grids to merge to this grid.
|
| merge_points : bool, default: True
| Points in exactly the same location will be merged between
| the two meshes. Warning: this can leave degenerate point data.
|
| tolerance : float, default: 0.0
| The absolute tolerance to use to find coincident points when
| ``merge_points=True``.
|
| inplace : bool, default: False
| Updates grid inplace when True if the input type is an
| :class:`pyvista.UnstructuredGrid`.
|
| main_has_priority : bool, default: True
| When this parameter is true and merge_points is true,
| the arrays of the merging grids will be overwritten
| by the original main mesh.
|
| .. deprecated:: 0.46
|
| This keyword will be removed in a future version. The main mesh
| always has priority with VTK 9.5.0 or later.
|
| progress_bar : bool, default: False
| Display a progress bar to indicate progress.
|
| Returns
| -------
| pyvista.UnstructuredGrid
| Merged grid.
|
| Notes
| -----
| When two or more grids are joined, the type and name of each
| array must match or the arrays will be ignored and not
| included in the final merged mesh.
|
| Examples
| --------
| Merge three separate spheres into a single mesh.
|
| >>> import pyvista as pv
| >>> sphere_a = pv.Sphere(center=(1, 0, 0))
| >>> sphere_b = pv.Sphere(center=(0, 1, 0))
| >>> sphere_c = pv.Sphere(center=(0, 0, 1))
| >>> merged = sphere_a.merge([sphere_b, sphere_c])
| >>> merged.plot()
|
| merge_points(self: '_DataSetType', tolerance: 'float' = 0.0, inplace: 'bool' = False, progress_bar: 'bool' = False)
| Merge duplicate points in this mesh.
|
| .. versionadded:: 0.45
|
| Parameters
| ----------
| tolerance : float, optional
| Specify a tolerance to use when comparing points. Points within
| this tolerance will be merged.
|
| inplace : bool, default: False
| Overwrite the original mesh with the result. Only possible if the input
| is :class:`~pyvista.PolyData` or :class:`~pyvista.UnstructuredGrid`.
|
| progress_bar : bool, default: False
| Display a progress bar to indicate progress.
|
| Returns
| -------
| output : pyvista.PolyData | pyvista.UnstructuredGrid
| Mesh with merged points. PolyData is returned only if the input is PolyData.
|
| Examples
| --------
| Merge duplicate points in a mesh.
|
| >>> import pyvista as pv
| >>> mesh = pv.Cylinder(resolution=4)
| >>> mesh.n_points
| 16
| >>> _ = mesh.merge_points(inplace=True)
| >>> mesh.n_points
| 8
|
| oriented_bounding_box(self: '_DataSetType', box_style: "Literal['frame', 'outline', 'face']" = 'face', *, axis_0_direction: 'VectorLike[float] | str | None' = None, axis_1_direction: 'VectorLike[float] | str | None' = None, axis_2_direction: 'VectorLike[float] | str | None' = None, frame_width: 'float' = 0.1, return_meta: 'bool' = False, as_composite: 'bool' = True)
| Return an oriented bounding box (OBB) for this dataset.
|
| By default, the bounding box is a :class:`~pyvista.MultiBlock` with six
| :class:`PolyData` comprising the faces of a cube. The blocks are named and
| ordered as ``('+X','-X','+Y','-Y','+Z','-Z')``.
|
| The box can optionally be styled as an outline or frame.
|
| .. note::
|
| The names of the blocks of the returned :class:`~pyvista.MultiBlock`
| correspond to the oriented box's local axes, not the global x-y-z axes.
| E.g. the normal of the ``'+X'`` face of the returned box has the same
| direction as the box's primary axis, and is not necessarily pointing in
| the +x direction ``(1, 0, 0)``.
|
| .. versionadded:: 0.45
|
| Parameters
| ----------
| box_style : 'frame' | 'outline' | 'face', default: 'face'
| Choose the style of the box. If ``'face'`` (default), each face of the box
| is a single quad cell. If ``'outline'``, the edges of each face are returned
| as line cells. If ``'frame'``, the center portion of each face is removed to
| create a picture-frame style border with each face having four quads (one
| for each side of the frame). Use ``frame_width`` to control the size of the
| frame.
|
| axis_0_direction : VectorLike[float] | str, optional
| Approximate direction vector of this mesh's primary axis. If set, the first
| axis in the returned ``axes`` metadata is flipped such that it best aligns
| with the specified vector. Can be a vector or string specifying the axis by
| name (e.g. ``'x'`` or ``'-x'``, etc.).
|
| axis_1_direction : VectorLike[float] | str, optional
| Approximate direction vector of this mesh's secondary axis. If set, the second
| axis in the returned ``axes`` metadata is flipped such that it best aligns
| with the specified vector. Can be a vector or string specifying the axis by
| name (e.g. ``'x'`` or ``'-x'``, etc.).
|
| axis_2_direction : VectorLike[float] | str, optional
| Approximate direction vector of this mesh's third axis. If set, the third
| axis in the returned ``axes`` metadata is flipped such that it best aligns
| with the specified vector. Can be a vector or string specifying the axis by
| name (e.g. ``'x'`` or ``'-x'``, etc.).
|
| frame_width : float, optional
| Set the width of the frame. Only has an effect if ``box_style`` is
| ``'frame'``. Values must be between ``0.0`` (minimal frame) and ``1.0``
| (large frame). The frame is scaled to ensure it has a constant width.
|
| return_meta : bool, default: False
| If ``True``, also returns the corner point and the three axes vectors
| defining the orientation of the box. The sign of the axes vectors can be
| controlled using the ``axis_#_direction`` arguments.
|
| as_composite : bool, default: True
| Return the box as a :class:`pyvista.MultiBlock` with six blocks: one for
| each face. Set this ``False`` to merge the output and return
| :class:`~pyvista.PolyData`.
|
| See Also
| --------
| bounding_box
| Similar filter for an axis-aligned bounding box (AABB).
|
| align_xyz
| Align a mesh to the world x-y-z axes. Used internally by this filter.
|
| pyvista.Plotter.add_bounding_box
| Add a bounding box to a scene.
|
| pyvista.CubeFacesSource
| Generate the faces of a cube. Used internally by this filter.
|
| Returns
| -------
| output : pyvista.MultiBlock | pyvista.PolyData
| MultiBlock with six named cube faces when ``as_composite=True`` and
| PolyData otherwise.
|
| numpy.ndarray
| The box's corner point corresponding to the origin of its axes if
| ``return_meta=True``.
|
| numpy.ndarray
| The box's orthonormal axes vectors if ``return_meta=True``.
|
| Examples
| --------
| Create a bounding box for a dataset.
|
| >>> import pyvista as pv
| >>> from pyvista import examples
| >>> mesh = examples.download_oblique_cone()
| >>> box = mesh.oriented_bounding_box()
|
| Plot the mesh and its bounding box.
|
| >>> pl = pv.Plotter()
| >>> _ = pl.add_mesh(mesh, color='red')
| >>> _ = pl.add_mesh(box, opacity=0.5)
| >>> pl.show()
|
| Return the metadata for the box.
|
| >>> box, point, axes = mesh.oriented_bounding_box('outline', return_meta=True)
|
| Use the metadata to plot the box's axes using :class:`~pyvista.AxesAssembly`.
| The assembly is aligned with the x-y-z axes and positioned at the origin by
| default. Create a transformation to scale, then rotate, then translate the
| assembly to the corner point of the box. The transpose of the axes is used
| as an inverted rotation matrix.
|
| >>> scale = box.length / 4
| >>> transform = pv.Transform().scale(scale).rotate(axes.T).translate(point)
| >>> axes_assembly = pv.AxesAssembly(user_matrix=transform.matrix)
|
| Plot the box and the axes.
|
| >>> pl = pv.Plotter()
| >>> _ = pl.add_mesh(mesh)
| >>> _ = pl.add_mesh(box, color='black', line_width=5)
| >>> _ = pl.add_actor(axes_assembly)
| >>> pl.show()
|
| Note how the box's z-axis is pointing from the cone's tip to its base. If we
| want to flip this axis, we can "seed" its direction as the ``'-z'`` direction.
|
| >>> box, _, axes = mesh.oriented_bounding_box(
| ... 'outline', axis_2_direction='-z', return_meta=True
| ... )
| >>>
|
| Plot the box and axes again. This time, use :class:`~pyvista.AxesAssemblySymmetric`
| and position the axes in the center of the box.
|
| >>> center = pv.merge(box).points.mean(axis=0)
| >>> scale = box.length / 2
| >>> transform = pv.Transform().scale(scale).rotate(axes.T).translate(center)
| >>> axes_assembly = pv.AxesAssemblySymmetric(user_matrix=transform.matrix)
|
| >>> pl = pv.Plotter()
| >>> _ = pl.add_mesh(mesh)
| >>> _ = pl.add_mesh(box, color='black', line_width=5)
| >>> _ = pl.add_actor(axes_assembly)
| >>> pl.show()
|
| outline(self: '_DataObjectType', generate_faces: 'bool' = False, progress_bar: 'bool' = False)
| Produce an outline of the full extent for the input dataset.
|
| Parameters
| ----------
| generate_faces : bool, default: False
| Generate solid faces for the box. This is disabled by default.
|
| progress_bar : bool, default: False
| Display a progress bar to indicate progress.
|
| Returns
| -------
| pyvista.PolyData
| Mesh containing an outline of the original dataset.
|
| See Also
| --------
| bounding_box
| Similar filter with additional options.
|
| Examples
| --------
| Generate and plot the outline of a sphere. This is
| effectively the ``(x, y, z)`` bounds of the mesh.
|
| >>> import pyvista as pv
| >>> sphere = pv.Sphere()
| >>> outline = sphere.outline()
| >>> pv.plot([sphere, outline], line_width=5)
|
| See :ref:`using_filters_example` for more examples using this filter.
|
| outline_corners(self: '_DataObjectType', factor: 'float' = 0.2, progress_bar: 'bool' = False)
| Produce an outline of the corners for the input dataset.
|
| Parameters
| ----------
| factor : float, default: 0.2
| Controls the relative size of the corners to the length of
| the corresponding bounds.
|
| progress_bar : bool, default: False
| Display a progress bar to indicate progress.
|
| Returns
| -------
| pyvista.PolyData
| Mesh containing outlined corners.
|
| Examples
| --------
| Generate and plot the corners of a sphere. This is
| effectively the ``(x, y, z)`` bounds of the mesh.
|
| >>> import pyvista as pv
| >>> sphere = pv.Sphere()
| >>> corners = sphere.outline_corners(factor=0.1)
| >>> pv.plot([sphere, corners], line_width=5)
|
| pack_labels(self: '_DataSetType', sort: 'bool' = False, scalars: 'str | None' = None, preference: "Literal['point', 'cell']" = 'point', output_scalars: 'str | None' = None, progress_bar: 'bool' = False, inplace: 'bool' = False)
| Renumber labeled data such that labels are contiguous.
|
| This filter renumbers scalar label data of any type with ``N`` labels
| such that the output labels are contiguous from ``[0, N)``. The
| output may optionally be sorted by label count.
|
| The output array ``'packed_labels'`` is added to the output by default,
| and is automatically set as the active scalars.
|
| See Also
| --------
| sort_labels
| Similar function with ``sort=True`` by default.
|
| Notes
| -----
| This filter uses :vtk:`vtkPackLabels` as the underlying method which
| requires VTK version 9.3 or higher. If :vtk:`vtkPackLabels` is not
| available, packing is done with ``NumPy`` instead which may be
| slower. For best performance, consider upgrading VTK.
|
| .. versionadded:: 0.43
|
| Parameters
| ----------
| sort : bool, default: False
| Whether to sort the output by label count in descending order
| (i.e. from largest to smallest).
|
| scalars : str, optional
| Name of scalars to pack. Defaults to currently active scalars.
|
| preference : str, default: "point"
| When ``scalars`` is specified, this is the preferred array
| type to search for in the dataset. Must be either
| ``'point'`` or ``'cell'``.
|
| output_scalars : str, None
| Name of the packed output scalars. By default, the output is
| saved to ``'packed_labels'``.
|
| progress_bar : bool, default: False
| If ``True``, display a progress bar. Has no effect if VTK
| version is lower than 9.3.
|
| inplace : bool, default: False
| If ``True``, the mesh is updated in-place.
|
| Returns
| -------
| pyvista.DataSet
| Dataset with packed labels.
|
| Examples
| --------
| Pack segmented image labels.
|
| Load non-contiguous image labels
|
| >>> from pyvista import examples
| >>> import numpy as np
| >>> image_labels = examples.load_frog_tissues()
|
| Show range of labels
|
| >>> image_labels.get_data_range()
| (np.uint8(0), np.uint8(29))
|
| Find 'gaps' in the labels
|
| >>> label_numbers = np.unique(image_labels.active_scalars)
| >>> label_max = np.max(label_numbers)
| >>> missing_labels = set(range(label_max)) - set(label_numbers)
| >>> len(missing_labels)
| 4
|
| Pack labels to remove gaps
|
| >>> packed_labels = image_labels.pack_labels()
|
| Show range of packed labels
|
| >>> packed_labels.get_data_range()
| (np.uint8(0), np.uint8(25))
|
| partition(self: '_DataSetType', n_partitions: 'int', generate_global_id: 'bool' = False, as_composite: 'bool' = True)
| Break down input dataset into a requested number of partitions.
|
| Cells on boundaries are uniquely assigned to each partition without duplication.
|
| It uses a kdtree implementation that builds balances the cell
| centers among a requested number of partitions. The current implementation
| only supports power-of-2 target partition. If a non-power of two value
| is specified for ``n_partitions``, then the load balancing simply
| uses the power-of-two greater than the requested value
|
| For more details, see :vtk:`vtkRedistributeDataSetFilter`.
|
| Parameters
| ----------
| n_partitions : int
| Specify the number of partitions to split the input dataset
| into. Current implementation results in a number of partitions equal
| to the power of 2 greater than or equal to the chosen value.
|
| generate_global_id : bool, default: False
| Generate global cell ids if ``None`` are present in the input. If
| global cell ids are present in the input then this flag is
| ignored.
|
| This is stored as ``"vtkGlobalCellIds"`` within the ``cell_data``
| of the output dataset(s).
|
| as_composite : bool, default: True
| Return the partitioned dataset as a :class:`pyvista.MultiBlock`.
|
| See Also
| --------
| split_bodies, extract_values
|
| Returns
| -------
| output : pyvista.MultiBlock | pyvista.UnstructuredGrid
| UnStructuredGrid if ``as_composite=False`` and MultiBlock when ``True``.
|
| Examples
| --------
| Partition a simple ImageData into a :class:`pyvista.MultiBlock`
| containing each partition.
|
| >>> import pyvista as pv
| >>> grid = pv.ImageData(dimensions=(5, 5, 5))
| >>> out = grid.partition(4, as_composite=True)
| >>> out.plot(multi_colors=True, show_edges=True)
|
| Partition of the Stanford bunny.
|
| >>> from pyvista import examples
| >>> mesh = examples.download_bunny()
| >>> out = mesh.partition(4, as_composite=True)
| >>> out.plot(multi_colors=True, cpos='xy')
|
| plot_over_circular_arc(self: '_DataSetType', pointa: 'VectorLike[float]', pointb: 'VectorLike[float]', center: 'VectorLike[float]', resolution: 'int | None' = None, scalars: 'str | None' = None, title: 'str | None' = None, ylabel: 'str | None' = None, figsize: 'tuple[int, int] | None' = None, figure: 'bool' = True, show: 'bool' = True, tolerance: 'float | None' = None, fname: 'str | None' = None, progress_bar: 'bool' = False) -> 'None'
| Sample a dataset along a circular arc and plot it.
|
| Plot the variables of interest in 2D where the X-axis is
| distance from Point A and the Y-axis is the variable of
| interest. Note that this filter returns ``None``.
|
| Parameters
| ----------
| pointa : sequence[float]
| Location in ``[x, y, z]``.
|
| pointb : sequence[float]
| Location in ``[x, y, z]``.
|
| center : sequence[float]
| Location in ``[x, y, z]``.
|
| resolution : int, optional
| Number of pieces to divide the circular arc into. Defaults
| to number of cells in the input mesh. Must be a positive
| integer.
|
| scalars : str, optional
| The string name of the variable in the input dataset to
| probe. The active scalar is used by default.
|
| title : str, optional
| The string title of the ``matplotlib`` figure.
|
| ylabel : str, optional
| The string label of the Y-axis. Defaults to the variable name.
|
| figsize : tuple(int), optional
| The size of the new figure.
|
| figure : bool, default: True
| Flag on whether or not to create a new figure.
|
| show : bool, default: True
| Shows the ``matplotlib`` figure when ``True``.
|
| tolerance : float, optional
| Tolerance used to compute whether a point in the source is
| in a cell of the input. If not given, tolerance is
| automatically generated.
|
| fname : str, optional
| Save the figure this file name when set.
|
| progress_bar : bool, default: False
| Display a progress bar to indicate progress.
|
| Examples
| --------
| Sample a dataset along a high resolution circular arc and plot.
|
| >>> from pyvista import examples
| >>> mesh = examples.load_uniform()
| >>> a = [mesh.bounds.x_min, mesh.bounds.y_min, mesh.bounds.z_max]
| >>> b = [mesh.bounds.x_max, mesh.bounds.y_min, mesh.bounds.z_min]
| >>> center = [
| ... mesh.bounds.x_min,
| ... mesh.bounds.y_min,
| ... mesh.bounds.z_min,
| ... ]
| >>> mesh.plot_over_circular_arc(
| ... a, b, center, resolution=1000, show=False
| ... ) # doctest:+SKIP
|
| plot_over_circular_arc_normal(self: '_DataSetType', center: 'VectorLike[float]', resolution: 'int | None' = None, normal: 'VectorLike[float] | None' = None, polar: 'VectorLike[float] | None' = None, angle: 'float | None' = None, scalars: 'str | None' = None, title: 'str | None' = None, ylabel: 'str | None' = None, figsize: 'tuple[int, int] | None' = None, figure: 'bool' = True, show: 'bool' = True, tolerance: 'float | None' = None, fname: 'str | None' = None, progress_bar: 'bool' = False) -> 'None'
| Sample a dataset along a circular arc defined by a normal and polar vector and plot it.
|
| Plot the variables of interest in 2D where the X-axis is
| distance from Point A and the Y-axis is the variable of
| interest. Note that this filter returns ``None``.
|
| Parameters
| ----------
| center : sequence[int]
| Location in ``[x, y, z]``.
|
| resolution : int, optional
| Number of pieces to divide circular arc into. Defaults to
| number of cells in the input mesh. Must be a positive
| integer.
|
| normal : sequence[float], optional
| The normal vector to the plane of the arc. By default it
| points in the positive Z direction.
|
| polar : sequence[float], optional
| Starting point of the arc in polar coordinates. By
| default it is the unit vector in the positive x direction.
|
| angle : float, optional
| Arc length (in degrees), beginning at the polar vector. The
| direction is counterclockwise. By default it is 360.
|
| scalars : str, optional
| The string name of the variable in the input dataset to
| probe. The active scalar is used by default.
|
| title : str, optional
| The string title of the `matplotlib` figure.
|
| ylabel : str, optional
| The string label of the Y-axis. Defaults to variable name.
|
| figsize : tuple(int), optional
| The size of the new figure.
|
| figure : bool, optional
| Flag on whether or not to create a new figure.
|
| show : bool, default: True
| Shows the matplotlib figure.
|
| tolerance : float, optional
| Tolerance used to compute whether a point in the source is
| in a cell of the input. If not given, tolerance is
| automatically generated.
|
| fname : str, optional
| Save the figure this file name when set.
|
| progress_bar : bool, default: False
| Display a progress bar to indicate progress.
|
| See Also
| --------
| :ref:`plot_over_circular_arc_example`
|
| Examples
| --------
| Sample a dataset along a high resolution circular arc and plot.
|
| >>> from pyvista import examples
| >>> mesh = examples.load_uniform()
| >>> normal = normal = [0, 0, 1]
| >>> polar = [0, 9, 0]
| >>> angle = 90
| >>> center = [
| ... mesh.bounds.x_min,
| ... mesh.bounds.y_min,
| ... mesh.bounds.z_min,
| ... ]
| >>> mesh.plot_over_circular_arc_normal(
| ... center, polar=polar, angle=angle
| ... ) # doctest:+SKIP
|
| plot_over_line(self: '_DataSetType', pointa: 'VectorLike[float]', pointb: 'VectorLike[float]', resolution: 'int | None' = None, scalars: 'str | None' = None, title: 'str | None' = None, ylabel: 'str | None' = None, figsize: 'tuple[int, int] | None' = None, figure: 'bool' = True, show: 'bool' = True, tolerance: 'float | None' = None, fname: 'str | None' = None, progress_bar: 'bool' = False) -> 'None'
| Sample a dataset along a high resolution line and plot.
|
| Plot the variables of interest in 2D using matplotlib where the
| X-axis is distance from Point A and the Y-axis is the variable
| of interest. Note that this filter returns ``None``.
|
| Parameters
| ----------
| pointa : sequence[float]
| Location in ``[x, y, z]``.
|
| pointb : sequence[float]
| Location in ``[x, y, z]``.
|
| resolution : int, optional
| Number of pieces to divide line into. Defaults to number of cells
| in the input mesh. Must be a positive integer.
|
| scalars : str, optional
| The string name of the variable in the input dataset to probe. The
| active scalar is used by default.
|
| title : str, optional
| The string title of the matplotlib figure.
|
| ylabel : str, optional
| The string label of the Y-axis. Defaults to variable name.
|
| figsize : tuple(int, int), optional
| The size of the new figure.
|
| figure : bool, default: True
| Flag on whether or not to create a new figure.
|
| show : bool, default: True
| Shows the matplotlib figure.
|
| tolerance : float, optional
| Tolerance used to compute whether a point in the source is in a
| cell of the input. If not given, tolerance is automatically generated.
|
| fname : str, optional
| Save the figure this file name when set.
|
| progress_bar : bool, default: False
| Display a progress bar to indicate progress.
|
| Examples
| --------
| See the :ref:`plot_over_line_example` example.
|
| remove_nan_cells(self: '_DataSetType', scalars: 'str | None' = None, preference: "Literal['point', 'cell']" = 'point', component_mode: "Literal['component', 'all', 'any']" = 'all', component: 'int' = 0, progress_bar: 'bool' = False) -> 'UnstructuredGrid'
| Remove cells whose scalar values are NaN.
|
| A cell is considered NaN if any of its associated scalar values are
| NaN. For point data, this means any cell containing a NaN point is
| dropped; for cell data, cells whose value is NaN are dropped.
|
| .. versionadded:: 0.48
|
| .. note::
| This filter is equivalent to calling
| :meth:`~pyvista.DataSetFilters.threshold` with ``all_scalars=True``
| and the default (auto-computed) value range, which uses
| :func:`numpy.nanmin` and :func:`numpy.nanmax` to exclude NaN
| values from the bounds. It is provided as a convenience because
| ``threshold`` defaults to ``preference='cell'`` and
| ``all_scalars=False``, which does not reliably remove NaN cells
| from point data.
|
| Parameters
| ----------
| scalars : str, optional
| Name of scalars to check for NaN values. Defaults to the
| currently active scalars.
|
| preference : str, default: 'point'
| When ``scalars`` is specified, this is the preferred array
| type to search for in the dataset. Must be either ``'point'``
| or ``'cell'``.
|
| component_mode : {'component', 'all', 'any'}, default: 'all'
| The method to satisfy the criteria for multicomponent scalars.
| ``'component'`` uses only the single component specified by
| ``component``. ``'all'`` drops a cell if any component is NaN.
| ``'any'`` keeps a cell as long as at least one component is
| finite.
|
| component : int, default: 0
| When using ``component_mode='component'``, this sets which
| component to check for NaN values.
|
| progress_bar : bool, default: False
| Display a progress bar to indicate progress.
|
| Returns
| -------
| pyvista.UnstructuredGrid
| Dataset with NaN cells removed.
|
| See Also
| --------
| threshold
| Threshold a dataset by value. ``remove_nan_cells`` is a thin
| wrapper around this filter.
| :meth:`~pyvista.DataSetFilters.extract_cells`
| Extract a subset of cells by index.
| :meth:`~pyvista.DataSetFilters.extract_values`
| Threshold-like filter for extracting specific values and ranges.
|
| Examples
| --------
| Create a small grid with some NaN point values and remove the
| affected cells.
|
| >>> import numpy as np
| >>> import pyvista as pv
| >>> grid = pv.ImageData(dimensions=(5, 5, 5))
| >>> values = np.arange(grid.n_points, dtype=float)
| >>> values[::7] = np.nan
| >>> grid.point_data['values'] = values
| >>> cleaned = grid.remove_nan_cells(scalars='values')
| >>> cleaned.n_cells < grid.n_cells
| True
| >>> bool(np.any(np.isnan(cleaned.point_data['values'])))
| False
|
| See :ref:`using_filters_example` for an end-to-end filter pipeline
| that begins with this filter.
|
| sample_over_circular_arc(self: '_DataSetType', pointa: 'VectorLike[float]', pointb: 'VectorLike[float]', center: 'VectorLike[float]', resolution: 'int | None' = None, tolerance: 'float | None' = None, progress_bar: 'bool' = False)
| Sample a dataset over a circular arc.
|
| Parameters
| ----------
| pointa : sequence[float]
| Location in ``[x, y, z]``.
|
| pointb : sequence[float]
| Location in ``[x, y, z]``.
|
| center : sequence[float]
| Location in ``[x, y, z]``.
|
| resolution : int, optional
| Number of pieces to divide circular arc into. Defaults to
| number of cells in the input mesh. Must be a positive
| integer.
|
| tolerance : float, optional
| Tolerance used to compute whether a point in the source is
| in a cell of the input. If not given, tolerance is
| automatically generated.
|
| progress_bar : bool, default: False
| Display a progress bar to indicate progress.
|
| Returns
| -------
| pyvista.PolyData
| Arc containing the sampled data.
|
| Examples
| --------
| Sample a dataset over a circular arc and plot it.
|
| >>> import pyvista as pv
| >>> from pyvista import examples
| >>> uniform = examples.load_uniform()
| >>> uniform['height'] = uniform.points[:, 2]
| >>> pointa = [
| ... uniform.bounds.x_max,
| ... uniform.bounds.y_min,
| ... uniform.bounds.z_max,
| ... ]
| >>> pointb = [
| ... uniform.bounds.x_max,
| ... uniform.bounds.y_max,
| ... uniform.bounds.z_min,
| ... ]
| >>> center = [
| ... uniform.bounds.x_max,
| ... uniform.bounds.y_min,
| ... uniform.bounds.z_min,
| ... ]
| >>> sampled_arc = uniform.sample_over_circular_arc(
| ... pointa=pointa, pointb=pointb, center=center
| ... )
| >>> pl = pv.Plotter()
| >>> _ = pl.add_mesh(uniform, style='wireframe')
| >>> _ = pl.add_mesh(sampled_arc, line_width=10)
| >>> pl.show_axes()
| >>> pl.show()
|
| sample_over_circular_arc_normal(self: '_DataSetType', center: 'VectorLike[float]', resolution: 'int | None' = None, normal: 'VectorLike[float] | None' = None, polar: 'VectorLike[float] | None' = None, angle: 'float | None' = None, tolerance: 'float | None' = None, progress_bar: 'bool' = False)
| Sample a dataset over a circular arc defined by a normal and polar vector and plot it.
|
| The number of segments composing the polyline is controlled by
| setting the object resolution.
|
| Parameters
| ----------
| center : sequence[float]
| Location in ``[x, y, z]``.
|
| resolution : int, optional
| Number of pieces to divide circular arc into. Defaults to
| number of cells in the input mesh. Must be a positive
| integer.
|
| normal : sequence[float], optional
| The normal vector to the plane of the arc. By default it
| points in the positive Z direction.
|
| polar : sequence[float], optional
| Starting point of the arc in polar coordinates. By
| default it is the unit vector in the positive x direction.
|
| angle : float, optional
| Arc length (in degrees), beginning at the polar vector. The
| direction is counterclockwise. By default it is 360.
|
| tolerance : float, optional
| Tolerance used to compute whether a point in the source is
| in a cell of the input. If not given, tolerance is
| automatically generated.
|
| progress_bar : bool, default: False
| Display a progress bar to indicate progress.
|
| Returns
| -------
| pyvista.PolyData
| Sampled Dataset.
|
| Examples
| --------
| Sample a dataset over a circular arc.
|
| >>> import pyvista as pv
| >>> from pyvista import examples
| >>> uniform = examples.load_uniform()
| >>> uniform['height'] = uniform.points[:, 2]
| >>> normal = [0, 0, 1]
| >>> polar = [0, 9, 0]
| >>> center = [
| ... uniform.bounds.x_max,
| ... uniform.bounds.y_min,
| ... uniform.bounds.z_max,
| ... ]
| >>> arc = uniform.sample_over_circular_arc_normal(
| ... center=center, normal=normal, polar=polar
| ... )
| >>> pl = pv.Plotter()
| >>> _ = pl.add_mesh(uniform, style='wireframe')
| >>> _ = pl.add_mesh(arc, line_width=10)
| >>> pl.show_axes()
| >>> pl.show()
|
| sample_over_line(self: '_DataSetType', pointa: 'VectorLike[float]', pointb: 'VectorLike[float]', resolution: 'int | None' = None, tolerance: 'float | None' = None, progress_bar: 'bool' = False)
| Sample a dataset onto a line.
|
| Parameters
| ----------
| pointa : sequence[float]
| Location in ``[x, y, z]``.
|
| pointb : sequence[float]
| Location in ``[x, y, z]``.
|
| resolution : int, optional
| Number of pieces to divide line into. Defaults to number of cells
| in the input mesh. Must be a positive integer.
|
| tolerance : float, optional
| Tolerance used to compute whether a point in the source is in a
| cell of the input. If not given, tolerance is automatically generated.
|
| progress_bar : bool, default: False
| Display a progress bar to indicate progress.
|
| Returns
| -------
| pyvista.PolyData
| Line object with sampled data from dataset.
|
| Examples
| --------
| Sample over a plane that is interpolating a point cloud.
|
| >>> import pyvista as pv
| >>> import numpy as np
| >>> rng = np.random.default_rng(12)
| >>> point_cloud = rng.random((5, 3))
| >>> point_cloud[:, 2] = 0
| >>> point_cloud -= point_cloud.mean(0)
| >>> pdata = pv.PolyData(point_cloud)
| >>> pdata['values'] = rng.random(5)
| >>> plane = pv.Plane()
| >>> plane.clear_data()
| >>> plane = plane.interpolate(pdata, sharpness=3.5)
| >>> sample = plane.sample_over_line((-0.5, -0.5, 0), (0.5, 0.5, 0))
| >>> pl = pv.Plotter()
| >>> _ = pl.add_mesh(pdata, render_points_as_spheres=True, point_size=50)
| >>> _ = pl.add_mesh(sample, scalars='values', line_width=10)
| >>> _ = pl.add_mesh(plane, scalars='values', style='wireframe')
| >>> pl.show()
|
| sample_over_multiple_lines(self: '_DataSetType', points: 'MatrixLike[float]', tolerance: 'float | None' = None, progress_bar: 'bool' = False)
| Sample a dataset onto a multiple lines.
|
| Parameters
| ----------
| points : array_like[float]
| List of points defining multiple lines.
|
| tolerance : float, optional
| Tolerance used to compute whether a point in the source is in a
| cell of the input. If not given, tolerance is automatically generated.
|
| progress_bar : bool, default: False
| Display a progress bar to indicate progress.
|
| Returns
| -------
| pyvista.PolyData
| Line object with sampled data from dataset.
|
| Examples
| --------
| Sample over a plane that is interpolating a point cloud.
|
| >>> import pyvista as pv
| >>> import numpy as np
| >>> rng = np.random.default_rng(12)
| >>> point_cloud = rng.random((5, 3))
| >>> point_cloud[:, 2] = 0
| >>> point_cloud -= point_cloud.mean(0)
| >>> pdata = pv.PolyData(point_cloud)
| >>> pdata['values'] = rng.random(5)
| >>> plane = pv.Plane()
| >>> plane.clear_data()
| >>> plane = plane.interpolate(pdata, sharpness=3.5)
| >>> sample = plane.sample_over_multiple_lines(
| ... [
| ... [-0.5, -0.5, 0],
| ... [0.5, -0.5, 0],
| ... [0.5, 0.5, 0],
| ... ]
| ... )
| >>> pl = pv.Plotter()
| >>> _ = pl.add_mesh(pdata, render_points_as_spheres=True, point_size=50)
| >>> _ = pl.add_mesh(sample, scalars='values', line_width=10)
| >>> _ = pl.add_mesh(plane, scalars='values', style='wireframe')
| >>> pl.show()
|
| select_enclosed_points(self: '_DataSetType', surface: 'PolyData', tolerance: 'float' = 0.001, inside_out: 'bool' = False, check_surface: 'bool' = True, progress_bar: 'bool' = False)
| Mark points as to whether they are inside a closed surface.
|
| This evaluates all the input points to determine whether they are in an
| enclosed surface. The filter produces a (0,1) mask
| (in the form of a :vtk:`vtkDataArray`) that indicates whether points are
| outside (mask value=0) or inside (mask value=1) a provided surface.
| (The name of the output :vtk:`vtkDataArray` is ``"SelectedPoints"``.)
|
| This filter produces and output data array, but does not modify the
| input dataset. If you wish to extract cells or points, various
| threshold filters are available (i.e., threshold the output array).
|
| .. warning::
| The filter assumes that the surface is closed and
| manifold. A boolean flag can be set to force the filter to
| first check whether this is true. If ``False`` and not manifold,
| an error will be raised.
|
| .. deprecated:: 0.47
| This filter may be unreliable as it can erroneously mark outside points as inside.
| Use :meth:`select_interior_points` instead.
|
| Parameters
| ----------
| surface : pyvista.PolyData
| Set the surface to be used to test for containment. This must be a
| :class:`pyvista.PolyData` object.
|
| tolerance : float, default: 0.001
| The tolerance on the intersection. The tolerance is expressed as a
| fraction of the bounding box of the enclosing surface.
|
| inside_out : bool, default: False
| By default, points inside the surface are marked inside or sent
| to the output. If ``inside_out`` is ``True``, then the points
| outside the surface are marked inside.
|
| check_surface : bool, default: True
| Specify whether to check the surface for closure. When ``True``, the
| algorithm first checks to see if the surface is closed and
| manifold. If the surface is not closed and manifold, a runtime
| error is raised.
|
| progress_bar : bool, default: False
| Display a progress bar to indicate progress.
|
| Returns
| -------
| pyvista.PolyData
| Mesh containing the ``point_data['SelectedPoints']`` array.
|
| See Also
| --------
| :ref:`extract_cells_inside_surface_example`
|
| Examples
| --------
| Determine which points on a plane are inside a manifold sphere
| surface mesh. Extract these points using the
| :func:`DataSetFilters.extract_points` filter and then plot them.
|
| >>> import pyvista as pv
| >>> sphere = pv.Sphere()
| >>> plane = pv.Plane()
| >>> selected = plane.select_enclosed_points(sphere) # doctest:+SKIP
| >>> pts = plane.extract_points( # doctest:+SKIP
| ... selected['SelectedPoints'].view(bool),
| ... adjacent_cells=False,
| ... )
| >>> pl = pv.Plotter() # doctest:+SKIP
| >>> _ = pl.add_mesh(sphere, style='wireframe') # doctest:+SKIP
| >>> _ = pl.add_points(pts, color='r') # doctest:+SKIP
| >>> pl.show() # doctest:+SKIP
|
| select_interior_points(self: '_DataSetType', surface: 'pv.PolyData', *, method: '_SelectInteriorPointsOptions' = 'signed_distance', inside_out: 'bool' = False, check_surface: 'bool' = True, locator_tolerance: 'float | None' = None) -> '_DataSetType'
| Mark points from this mesh as inside or outside relative to a closed surface.
|
| Evaluate all of this mesh's points to determine if they are inside an enclosed surface.
| The filter produces a boolean point array named ``'selected_points'`` with ``True``
| values indicating points are inside, and ``False`` values indicating points are outside the
| provided surface.
|
| By default, the input surface is checked to ensure it is closed. Optionally, this check may
| be disabled.
|
| .. note::
| This filter generates a data array, but does not modify the
| input dataset. If you wish to extract cells or points, various
| threshold filters are available (i.e., threshold the output array).
|
| .. versionadded:: 0.47
|
| Parameters
| ----------
| surface : PolyData
| Surface used to test for containment. It should be a closed surface such that it has
| a defined "inside" and "outside".
|
| method : 'signed_distance' | 'cell_locator', default: 'signed_distance'
| Underlying method used to select points.
|
| - ``'signed_distance'``: Use :meth:`compute_implicit_distance` and select points based
| on the distance. Points with negative distance are inside, points with positive
| distance are outside.
| - ``'cell_locator'``: Use :vtk:`vtkSelectEnclosedPoints` to select points. This uses
| :vtk:`vtkStaticCellLocator` internally to spatially search for interior points. Use
| the ``locator_tolerance`` to control the search tolerance.
|
| .. note::
| The ``'signed_distance'`` method is generally slower, but is also more reliable
| for correctly identifying interior points.
|
| .. warning::
| The ``'cell_locator'`` option can erroneously mark outside points as inside.
|
| inside_out : bool, default: False
| By default, points inside the surface have value ``True``, and points outside
| have value ``False``. Set ``inside_out=True`` to invert this.
|
| check_surface : bool, default: True
| Specify whether to check the surface for closure. When ``True``, the
| algorithm first checks to see if the surface is closed and
| manifold. If the surface is not closed, a runtime error is raised.
|
| locator_tolerance : float, default: 0.001
| The tolerance on the intersection when using the ``'cell_locator'`` method. The
| tolerance is expressed as a fraction of the bounding box of the enclosing surface.
|
| Returns
| -------
| PolyData
| Mesh with a new ``'selected_points'`` :attr:`~pyvista.DataSet.point_data` array.
|
| See Also
| --------
| compute_implicit_distance, extract_points, extract_cells
| :ref:`extract_cells_inside_surface_example`
|
| Examples
| --------
| Determine which points on a plane are inside a manifold sphere surface mesh.
| Extract these points using the :func:`~DataSetFilters.extract_points` filter
| and then plot them.
|
| >>> import pyvista as pv
| >>> sphere = pv.Sphere()
| >>> plane = pv.Plane()
| >>> selected = plane.select_interior_points(sphere)
| >>> pts = plane.extract_points(
| ... selected['selected_points'], include_cells=False
| ... )
| >>> pl = pv.Plotter()
| >>> _ = pl.add_mesh(sphere, style='wireframe', line_width=3)
| >>> _ = pl.add_points(
| ... pts, color='r', point_size=15, render_points_as_spheres=True
| ... )
| >>> pl.show()
|
| Select the outside points instead.
|
| >>> selected = plane.select_interior_points(sphere, inside_out=True)
| >>> pts = plane.extract_points(
| ... selected['selected_points'], include_cells=False
| ... )
| >>> pl = pv.Plotter()
| >>> _ = pl.add_mesh(sphere, style='wireframe', line_width=3)
| >>> _ = pl.add_points(
| ... pts, color='r', point_size=15, render_points_as_spheres=True
| ... )
| >>> pl.show()
|
| separate_cells(self: '_DataSetType')
| Return a copy of the dataset with separated cells with no shared points.
|
| This method may be useful when datasets have scalars that need to be
| associated to each point of each cell rather than either each cell or
| just the points of the dataset.
|
| Returns
| -------
| pyvista.UnstructuredGrid
| UnstructuredGrid with isolated cells.
|
| Examples
| --------
| Load the example hex beam and separate its cells. This increases the
| total number of points in the dataset since points are no longer
| shared.
|
| >>> from pyvista import examples
| >>> grid = examples.load_hexbeam()
| >>> grid.n_points
| 99
| >>> sep_grid = grid.separate_cells()
| >>> sep_grid.n_points
| 320
|
| See the :ref:`point_cell_scalars_example` for a more detailed example
| using this filter.
|
| shrink(self: '_DataSetType', shrink_factor: 'float' = 1.0, progress_bar: 'bool' = False)
| Shrink the individual faces of a mesh.
|
| This filter shrinks the individual faces of a mesh rather than
| scaling the entire mesh.
|
| Parameters
| ----------
| shrink_factor : float, default: 1.0
| Fraction of shrink for each cell. Default does not modify the
| faces.
|
| progress_bar : bool, default: False
| Display a progress bar to indicate progress.
|
| Returns
| -------
| pyvista.DataSet
| Dataset with shrunk faces. Return type matches input.
|
| Examples
| --------
| First, plot the original cube.
|
| >>> import pyvista as pv
| >>> mesh = pv.Cube()
| >>> mesh.plot(show_edges=True, line_width=5)
|
| Now, plot the mesh with shrunk faces.
|
| >>> shrunk = mesh.shrink(0.5)
| >>> shrunk.clear_data() # cleans up plot
| >>> shrunk.plot(show_edges=True, line_width=5)
|
| sort_labels(self: '_DataSetType', scalars: 'str | None' = None, preference: "Literal['point', 'cell']" = 'point', output_scalars: 'str | None' = None, progress_bar: 'bool' = False, inplace: 'bool' = False)
| Sort labeled data by number of points or cells.
|
| This filter renumbers scalar label data of any type with ``N`` labels
| such that the output labels are contiguous from ``[0, N)`` and
| sorted in descending order from largest to smallest (by label count).
| I.e., the largest label will have a value of ``0`` and the smallest
| label will have a value of ``N-1``.
|
| The filter is a convenience method for :func:`pyvista.DataSetFilters.pack_labels`
| with ``sort=True``.
|
| Parameters
| ----------
| scalars : str, optional
| Name of scalars to sort. Defaults to currently active scalars.
|
| preference : str, default: "point"
| When ``scalars`` is specified, this is the preferred array
| type to search for in the dataset. Must be either
| ``'point'`` or ``'cell'``.
|
| output_scalars : str, None
| Name of the sorted output scalars. By default, the output is
| saved to ``'packed_labels'``.
|
| progress_bar : bool, default: False
| If ``True``, display a progress bar. Has no effect if VTK
| version is lower than 9.3.
|
| inplace : bool, default: False
| If ``True``, the mesh is updated in-place.
|
| Returns
| -------
| pyvista.DataSet
| Dataset with sorted labels.
|
| Examples
| --------
| Sort segmented image labels.
|
| Load image labels
|
| >>> from pyvista import examples
| >>> import numpy as np
| >>> image_labels = examples.load_frog_tissues()
|
| Show label info for first four labels
|
| >>> label_number, label_size = np.unique(
| ... image_labels['MetaImage'], return_counts=True
| ... )
| >>> label_number[:4]
| pyvista_ndarray([0, 1, 2, 3], dtype=uint8)
| >>> label_size[:4]
| array([30805713, 35279, 19172, 38129])
|
| Sort labels
|
| >>> sorted_labels = image_labels.sort_labels()
|
| Show sorted label info for the four largest labels. Note
| the difference in label size after sorting.
|
| >>> sorted_label_number, sorted_label_size = np.unique(
| ... sorted_labels['packed_labels'], return_counts=True
| ... )
| >>> sorted_label_number[:4]
| pyvista_ndarray([0, 1, 2, 3], dtype=uint8)
| >>> sorted_label_size[:4]
| array([30805713, 438052, 204672, 133880])
|
| split_bodies(self: '_DataSetType', label: 'bool' = False, progress_bar: 'bool' = False)
| Find, label, and split connected bodies/volumes.
|
| This splits different connected bodies into blocks in a
| :class:`pyvista.MultiBlock` dataset.
|
| Parameters
| ----------
| label : bool, default: False
| A flag on whether to keep the ID arrays given by the
| ``connectivity`` filter.
|
| progress_bar : bool, default: False
| Display a progress bar to indicate progress.
|
| See Also
| --------
| extract_values, partition, connectivity
|
| Returns
| -------
| pyvista.MultiBlock
| MultiBlock with a split bodies.
|
| Examples
| --------
| Split a uniform grid thresholded to be non-connected.
|
| >>> from pyvista import examples
| >>> dataset = examples.load_uniform()
| >>> _ = dataset.set_active_scalars('Spatial Cell Data')
| >>> threshed = dataset.threshold_percent([0.15, 0.50], invert=True)
| >>> bodies = threshed.split_bodies()
| >>> len(bodies)
| 2
|
| See :ref:`split_vol` for more examples using this filter.
|
| split_values(self: '_DataSetType', values: 'None | (float | VectorLike[float] | MatrixLike[float] | dict[str, float] | dict[float, str])' = None, *, ranges: 'None | (VectorLike[float] | MatrixLike[float] | dict[str, VectorLike[float]] | dict[tuple[float, float], str])' = None, scalars: 'str | None' = None, preference: "Literal['point', 'cell']" = 'point', component_mode: "Literal['any', 'all', 'multi'] | int" = 'all', **kwargs)
| Split mesh into separate sub-meshes using point or cell data.
|
| By default, this filter generates a separate mesh for each unique value in the
| data array and combines them as blocks in a :class:`~pyvista.MultiBlock`
| dataset. Optionally, specific values and/or ranges of values may be specified to
| control which values to split from the input.
|
| This filter is a convenience method for :meth:`~pyvista.DataSetFilters.extract_values`
| with ``split`` set to ``True`` by default. Refer to that filter's documentation
| for more details.
|
| .. versionadded:: 0.44
|
| Parameters
| ----------
| values : float | ArrayLike[float] | dict, optional
| Value(s) to extract. Can be a number, an iterable of numbers, or a dictionary
| with numeric entries. For ``dict`` inputs, either its keys or values may be
| numeric, and the other field must be strings. The numeric field is used as
| the input for this parameter, and if ``split`` is ``True``, the string field
| is used to set the block names of the returned :class:`~pyvista.MultiBlock`.
|
| .. note::
| When extracting multi-component values with ``component_mode=multi``,
| each value is specified as a multi-component scalar. In this case,
| ``values`` can be a single vector or an array of row vectors.
|
| ranges : array_like | dict, optional
| Range(s) of values to extract. Can be a single range (i.e. a sequence of
| two numbers in the form ``[lower, upper]``), a sequence of ranges, or a
| dictionary with range entries. Any combination of ``values`` and ``ranges``
| may be specified together. The endpoints of the ranges are included in the
| extraction. Ranges cannot be set when ``component_mode=multi``.
|
| For ``dict`` inputs, either its keys or values may be numeric, and the other
| field must be strings. The numeric field is used as the input for this
| parameter, and if ``split`` is ``True``, the string field is used to set the
| block names of the returned :class:`~pyvista.MultiBlock`.
|
| .. note::
| Use ``+/-`` infinity to specify an unlimited bound, e.g.:
|
| - ``[0, float('inf')]`` to extract values greater than or equal to zero.
| - ``[float('-inf'), 0]`` to extract values less than or equal to zero.
|
| scalars : str, optional
| Name of scalars to extract with. Defaults to currently active scalars.
|
| preference : str, default: 'point'
| When ``scalars`` is specified, this is the preferred array type to search
| for in the dataset. Must be either ``'point'`` or ``'cell'``.
|
| component_mode : int | 'any' | 'all' | 'multi', default: 'all'
| Specify the component(s) to use when ``scalars`` is a multi-component array.
| Has no effect when the scalars have a single component. Must be one of:
|
| - number: specify the component number as a 0-indexed integer. The selected
| component must have the specified value(s).
| - ``'any'``: any single component can have the specified value(s).
| - ``'all'``: all individual components must have the specified values(s).
| - ``'multi'``: the entire multi-component item must have the specified value.
|
| **kwargs : dict, optional
| Additional keyword arguments passed to :meth:`~pyvista.DataSetFilters.extract_values`.
|
| See Also
| --------
| extract_values, split_bodies, partition
|
| Returns
| -------
| pyvista.MultiBlock
| Composite of split meshes with :class:`pyvista.UnstructuredGrid` blocks.
|
| Examples
| --------
| Load image with labeled regions.
|
| >>> import numpy as np
| >>> import pyvista as pv
| >>> from pyvista import examples
| >>> image = examples.load_channels()
| >>> np.unique(image.active_scalars)
| pyvista_ndarray([0, 1, 2, 3, 4])
|
| Split the image into its separate regions. Here, we also remove the first
| region for visualization.
|
| >>> multiblock = image.split_values()
| >>> _ = multiblock.pop(0) # Remove first region
|
| Plot the regions.
|
| >>> pl = pv.Plotter()
| >>> _ = pl.add_composite(multiblock, multi_colors=True)
| >>> _ = pl.show_grid()
| >>> pl.show()
|
| Note that the block names are generic by default.
|
| >>> multiblock.keys()
| ['Block-01', 'Block-02', 'Block-03', 'Block-04']
|
| To name the output blocks, use a dictionary as input instead.
|
| Here, we also explicitly omit the region with ``0`` values from the input
| instead of removing it from the output.
|
| >>> labels = dict(region1=1, region2=2, region3=3, region4=4)
| >>>
| >>> multiblock = image.split_values(labels)
| >>> multiblock.keys()
| ['region1', 'region2', 'region3', 'region4']
|
| Plot the regions as separate meshes using the labels instead of plotting
| the MultiBlock directly.
|
| Clear scalar data so we can color each mesh using a single color
|
| >>> _ = [block.clear_data() for block in multiblock]
| >>>
| >>> pl = pv.Plotter()
| >>> pl.set_color_cycler('default')
| >>> _ = [
| ... pl.add_mesh(block, label=label)
| ... for block, label in zip(multiblock, labels)
| ... ]
| >>> _ = pl.add_legend()
| >>> pl.show()
|
| streamlines(self: '_DataSetType', vectors: 'str | None' = None, source_center: 'VectorLike[float] | None' = None, source_radius: 'float | None' = None, n_points: 'int' = 100, start_position: 'VectorLike[float] | None' = None, return_source: 'bool' = False, pointa: 'VectorLike[float] | None' = None, pointb: 'VectorLike[float] | None' = None, progress_bar: 'bool' = False, **kwargs)
| Integrate a vector field to generate streamlines.
|
| The default behavior uses a sphere as the source - set its
| location and radius via the ``source_center`` and
| ``source_radius`` keyword arguments. ``n_points`` defines the
| number of starting points on the sphere surface.
| Alternatively, a line source can be used by specifying
| ``pointa`` and ``pointb``. ``n_points`` again defines the
| number of points on the line.
|
| You can retrieve the source by specifying
| ``return_source=True``.
|
| Optional keyword parameters from
| :func:`pyvista.DataSetFilters.streamlines_from_source` can be
| used here to control the generation of streamlines.
|
| Parameters
| ----------
| vectors : str, optional
| The string name of the active vector field to integrate across.
|
| source_center : sequence[float], optional
| Length 3 tuple of floats defining the center of the source
| particles. Defaults to the center of the dataset.
|
| source_radius : float, optional
| Float radius of the source particle cloud. Defaults to one-tenth of
| the diagonal of the dataset's spatial extent.
|
| n_points : int, default: 100
| Number of particles present in source sphere or line.
|
| start_position : sequence[float], optional
| A single point. This will override the sphere point source.
|
| return_source : bool, default: False
| Return the source particles as :class:`pyvista.PolyData` as well as the
| streamlines. This will be the second value returned if ``True``.
|
| pointa, pointb : sequence[float], optional
| The coordinates of a start and end point for a line source. This
| will override the sphere and start_position point source.
|
| progress_bar : bool, default: False
| Display a progress bar to indicate progress.
|
| **kwargs : dict, optional
| See :func:`pyvista.DataSetFilters.streamlines_from_source`.
|
| Returns
| -------
| streamlines : pyvista.PolyData
| This produces polylines as the output, with each cell
| (i.e., polyline) representing a streamline. The attribute values
| associated with each streamline are stored in the cell data, whereas
| those associated with streamline-points are stored in the point data.
|
| source : pyvista.PolyData
| The points of the source are the seed points for the streamlines.
| Only returned if ``return_source=True``.
|
| Examples
| --------
| See the :ref:`streamlines_example` example.
|
| streamlines_evenly_spaced_2D(self: '_DataSetType', vectors: 'str | None' = None, start_position: 'VectorLike[float] | None' = None, integrator_type: 'Literal[2, 4]' = 2, step_length: 'float' = 0.5, step_unit: "Literal['cl', 'l']" = 'cl', max_steps: 'int' = 2000, terminal_speed: 'float' = 1e-12, interpolator_type: "Literal['point', 'cell', 'p', 'c']" = 'point', separating_distance: 'float' = 10.0, separating_distance_ratio: 'float' = 0.5, closed_loop_maximum_distance: 'float' = 0.5, loop_angle: 'float' = 20.0, minimum_number_of_loop_points: 'int' = 4, compute_vorticity: 'bool' = True, progress_bar: 'bool' = False)
| Generate evenly spaced streamlines on a 2D dataset.
|
| This filter only supports datasets that lie on the xy plane, i.e. ``z=0``.
| Particular care must be used to choose a `separating_distance`
| that do not result in too much memory being utilized. The
| default unit is cell length.
|
| Parameters
| ----------
| vectors : str, optional
| The string name of the active vector field to integrate across.
|
| start_position : sequence[float], optional
| The seed point for generating evenly spaced streamlines.
| If not supplied, a random position in the dataset is chosen.
|
| integrator_type : {2, 4}, default: 2
| The integrator type to be used for streamline generation.
| The default is Runge-Kutta2. The recognized solvers are:
| RUNGE_KUTTA2 (``2``) and RUNGE_KUTTA4 (``4``).
|
| step_length : float, default: 0.5
| Constant Step size used for line integration, expressed in length
| units or cell length units (see ``step_unit`` parameter).
|
| step_unit : {'cl', 'l'}, default: "cl"
| Uniform integration step unit. The valid unit is now limited to
| only LENGTH_UNIT (``'l'``) and CELL_LENGTH_UNIT (``'cl'``).
| Default is CELL_LENGTH_UNIT.
|
| max_steps : int, default: 2000
| Maximum number of steps for integrating a streamline.
|
| terminal_speed : float, default: 1e-12
| Terminal speed value, below which integration is terminated.
|
| interpolator_type : str, optional
| Set the type of the velocity field interpolator to locate cells
| during streamline integration either by points or cells.
| The cell locator is more robust then the point locator. Options
| are ``'point'`` or ``'cell'`` (abbreviations of ``'p'`` and ``'c'``
| are also supported).
|
| separating_distance : float, default: 10
| The distance between streamlines expressed in ``step_unit``.
|
| separating_distance_ratio : float, default: 0.5
| Streamline integration is stopped if streamlines are closer than
| ``SeparatingDistance*SeparatingDistanceRatio`` to other streamlines.
|
| closed_loop_maximum_distance : float, default: 0.5
| The distance between points on a streamline to determine a
| closed loop.
|
| loop_angle : float, default: 20
| The maximum angle in degrees between points to determine a closed loop.
|
| minimum_number_of_loop_points : int, default: 4
| The minimum number of points before which a closed loop will
| be determined.
|
| compute_vorticity : bool, default: True
| Vorticity computation at streamline points. Necessary for generating
| proper stream-ribbons using the :vtk:`vtkRibbonFilter`.
|
| progress_bar : bool, default: False
| Display a progress bar to indicate progress.
|
| Returns
| -------
| pyvista.PolyData
| This produces polylines as the output, with each cell
| (i.e., polyline) representing a streamline. The attribute
| values associated with each streamline are stored in the
| cell data, whereas those associated with streamline-points
| are stored in the point data.
|
| Examples
| --------
| Plot evenly spaced streamlines for cylinder in a crossflow.
| This dataset is a multiblock dataset, and the fluid velocity is in the
| first block.
|
| >>> import pyvista as pv
| >>> from pyvista import examples
| >>> mesh = examples.download_cylinder_crossflow()
| >>> streams = mesh[0].streamlines_evenly_spaced_2D(
| ... start_position=(4, 0.1, 0.0),
| ... separating_distance=3,
| ... separating_distance_ratio=0.2,
| ... )
| >>> pl = pv.Plotter()
| >>> _ = pl.add_mesh(streams.tube(radius=0.02), scalars='vorticity_mag')
| >>> pl.view_xy()
| >>> pl.show()
|
| See :ref:`streamlines_2D_example` for more examples using this filter.
|
| streamlines_from_source(self: '_DataSetType', source: '_vtk.vtkDataSet', vectors: 'str | None' = None, integrator_type: 'Literal[45, 2, 4]' = 45, integration_direction: "Literal['both', 'backward', 'forward']" = 'both', surface_streamlines: 'bool' = False, initial_step_length: 'float' = 0.5, step_unit: "Literal['cl', 'l']" = 'cl', min_step_length: 'float' = 0.01, max_step_length: 'float' = 1.0, max_steps: 'int' = 2000, terminal_speed: 'float' = 1e-12, max_error: 'float' = 1e-06, max_time: 'float | None' = None, compute_vorticity: 'bool' = True, rotation_scale: 'float' = 1.0, interpolator_type: "Literal['point', 'cell', 'p', 'c']" = 'point', progress_bar: 'bool' = False, max_length: 'float | None' = None)
| Generate streamlines of vectors from the points of a source mesh.
|
| The integration is performed using a specified integrator, by default
| Runge-Kutta45. This supports integration through any type of dataset.
| If the dataset contains 2D cells like polygons or triangles and the
| ``surface_streamlines`` parameter is used, the integration is constrained
| to lie on the surface defined by 2D cells.
|
| Parameters
| ----------
| source : pyvista.DataSet
| The points of the source provide the starting points of the
| streamlines. This will override both sphere and line sources.
|
| vectors : str, optional
| The string name of the active vector field to integrate across.
|
| integrator_type : {45, 2, 4}, default: 45
| The integrator type to be used for streamline generation.
| The default is Runge-Kutta45. The recognized solvers are:
| RUNGE_KUTTA2 (``2``), RUNGE_KUTTA4 (``4``), and RUNGE_KUTTA45
| (``45``). Options are ``2``, ``4``, or ``45``.
|
| integration_direction : str, default: "both"
| Specify whether the streamline is integrated in the upstream or
| downstream directions (or both). Options are ``'both'``,
| ``'backward'``, or ``'forward'``.
|
| surface_streamlines : bool, default: False
| Compute streamlines on a surface.
|
| initial_step_length : float, default: 0.5
| Initial step size used for line integration, expressed ib length
| unitsL or cell length units (see ``step_unit`` parameter).
| either the starting size for an adaptive integrator, e.g., RK45, or
| the constant / fixed size for non-adaptive ones, i.e., RK2 and RK4).
|
| step_unit : {'cl', 'l'}, default: "cl"
| Uniform integration step unit. The valid unit is now limited to
| only LENGTH_UNIT (``'l'``) and CELL_LENGTH_UNIT (``'cl'``).
| Default is CELL_LENGTH_UNIT.
|
| min_step_length : float, default: 0.01
| Minimum step size used for line integration, expressed in length or
| cell length units. Only valid for an adaptive integrator, e.g., RK45.
|
| max_step_length : float, default: 1.0
| Maximum step size used for line integration, expressed in length or
| cell length units. Only valid for an adaptive integrator, e.g., RK45.
|
| max_steps : int, default: 2000
| Maximum number of steps for integrating a streamline.
|
| terminal_speed : float, default: 1e-12
| Terminal speed value, below which integration is terminated.
|
| max_error : float, 1e-6
| Maximum error tolerated throughout streamline integration.
|
| max_time : float, optional
| Specify the maximum length of a streamline expressed in physical length.
|
| .. deprecated:: 0.45.0
| ``max_time`` parameter is deprecated. Use ``max_length`` instead.
| It will be removed in v0.48. Default for ``max_time`` changed in v0.45.0.
|
| compute_vorticity : bool, default: True
| Vorticity computation at streamline points. Necessary for generating
| proper stream-ribbons using the :vtk:`vtkRibbonFilter`.
|
| rotation_scale : float, default: 1.0
| This can be used to scale the rate with which the streamribbons
| twist.
|
| interpolator_type : str, default: "point"
| Set the type of the velocity field interpolator to locate cells
| during streamline integration either by points or cells.
| The cell locator is more robust then the point locator. Options
| are ``'point'`` or ``'cell'`` (abbreviations of ``'p'`` and ``'c'``
| are also supported).
|
| progress_bar : bool, default: False
| Display a progress bar to indicate progress.
|
| max_length : float, optional
| Specify the maximum length of a streamline expressed in physical length.
| Default is 4 times the diagonal length of the bounding box of the ``source``
| dataset.
|
| Returns
| -------
| pyvista.PolyData
| Streamlines. This produces polylines as the output, with
| each cell (i.e., polyline) representing a streamline. The
| attribute values associated with each streamline are
| stored in the cell data, whereas those associated with
| streamline-points are stored in the point data.
|
| Examples
| --------
| See the :ref:`streamlines_example` example.
|
| surface_indices(self: '_DataSetType', progress_bar: 'bool' = False)
| Return the surface indices of a grid.
|
| .. versionchanged:: 0.47
| The underlying algorithm used to compute surface indices has changed.
| :vtk:`vtkGeometryFilter` is now used, previously it was :vtk:`vtkDataSetSurfaceFilter`.
|
| Parameters
| ----------
| progress_bar : bool, default: False
| Display a progress bar to indicate progress.
|
| Returns
| -------
| numpy.ndarray
| Indices of the surface points.
|
| Examples
| --------
| Return the first 10 surface indices of an UnstructuredGrid.
|
| >>> from pyvista import examples
| >>> grid = examples.load_hexbeam()
| >>> ind = grid.surface_indices()
| >>> ind[:10]
| pyvista_ndarray([0, 1, 2, 3, 4, 5, 6, 7, 8, 9])
|
| tessellate(self: '_DataSetType', max_n_subdivide: 'int' = 3, merge_points: 'bool' = True, progress_bar: 'bool' = False)
| Tessellate a mesh.
|
| This filter approximates nonlinear FEM-like elements with linear
| simplices. The output mesh will have geometry and any fields specified
| as attributes in the input mesh's point data. The attribute's copy
| flags are honored, except for normals.
|
| For more details see :vtk:`vtkTessellatorFilter`.
|
| Parameters
| ----------
| max_n_subdivide : int, default: 3
| Maximum number of subdivisions.
|
| merge_points : bool, default: True
| The adaptive tessellation will output vertices that are not shared among cells,
| even where they should be. This can be corrected to some extent.
|
| progress_bar : bool, default: False
| Display a progress bar to indicate progress.
|
| Returns
| -------
| pyvista.DataSet
| Dataset with tessellated mesh. Return type matches input.
|
| Examples
| --------
| First, plot the high order FEM-like elements.
|
| >>> import pyvista as pv
| >>> import numpy as np
| >>> points = np.array(
| ... [
| ... [0.0, 0.0, 0.0],
| ... [2.0, 0.0, 0.0],
| ... [1.0, 2.0, 0.0],
| ... [1.0, 0.5, 0.0],
| ... [1.5, 1.5, 0.0],
| ... [0.5, 1.5, 0.0],
| ... ]
| ... )
| >>> cells = np.array([6, 0, 1, 2, 3, 4, 5])
| >>> cell_types = np.array([69])
| >>> mesh = pv.UnstructuredGrid(cells, cell_types, points)
| >>> mesh.plot(show_edges=True, line_width=5)
|
| Now, plot the tessellated mesh.
|
| >>> tessellated = mesh.tessellate()
| >>> tessellated.clear_data() # cleans up plot
| >>> tessellated.plot(show_edges=True, line_width=5)
|
| texture_map_to_plane(self: '_DataSetType', origin: 'VectorLike[float] | None' = None, point_u: 'VectorLike[float] | None' = None, point_v: 'VectorLike[float] | None' = None, inplace: 'bool' = False, name: 'str' = 'Texture Coordinates', use_bounds: 'bool' = False, progress_bar: 'bool' = False)
| Texture map this dataset to a user defined plane.
|
| This is often used to define a plane to texture map an image
| to this dataset. The plane defines the spatial reference and
| extent of that image.
|
| Parameters
| ----------
| origin : sequence[float], optional
| Length 3 iterable of floats defining the XYZ coordinates of the
| bottom left corner of the plane.
|
| point_u : sequence[float], optional
| Length 3 iterable of floats defining the XYZ coordinates of the
| bottom right corner of the plane.
|
| point_v : sequence[float], optional
| Length 3 iterable of floats defining the XYZ coordinates of the
| top left corner of the plane.
|
| inplace : bool, default: False
| If ``True``, the new texture coordinates will be added to this
| dataset. If ``False``, a new dataset is returned with the texture
| coordinates.
|
| name : str, default: "Texture Coordinates"
| The string name to give the new texture coordinates if applying
| the filter inplace.
|
| use_bounds : bool, default: False
| Use the bounds to set the mapping plane by default (bottom plane
| of the bounding box).
|
| progress_bar : bool, default: False
| Display a progress bar to indicate progress.
|
| Returns
| -------
| pyvista.DataSet
| Original dataset with texture coordinates if
| ``inplace=True``, otherwise a copied dataset.
|
| Examples
| --------
| See :ref:`topo_map_example`
|
| texture_map_to_sphere(self: '_DataSetType', center: 'VectorLike[float] | None' = None, prevent_seam: 'bool' = True, inplace: 'bool' = False, name: 'str' = 'Texture Coordinates', progress_bar: 'bool' = False)
| Texture map this dataset to a user defined sphere.
|
| This is often used to define a sphere to texture map an image
| to this dataset. The sphere defines the spatial reference and
| extent of that image.
|
| Parameters
| ----------
| center : sequence[float], optional
| Length 3 iterable of floats defining the XYZ coordinates of the
| center of the sphere. If ``None``, this will be automatically
| calculated.
|
| prevent_seam : bool, default: True
| Control how the texture coordinates are generated. If
| set, the s-coordinate ranges from 0 to 1 and 1 to 0
| corresponding to the theta angle variation between 0 to
| 180 and 180 to 0 degrees. Otherwise, the s-coordinate
| ranges from 0 to 1 between 0 to 360 degrees.
|
| inplace : bool, default: False
| If ``True``, the new texture coordinates will be added to
| the dataset inplace. If ``False`` (default), a new dataset
| is returned with the texture coordinates.
|
| name : str, default: "Texture Coordinates"
| The string name to give the new texture coordinates if applying
| the filter inplace.
|
| progress_bar : bool, default: False
| Display a progress bar to indicate progress.
|
| Returns
| -------
| pyvista.DataSet
| Dataset containing the texture mapped to a sphere. Return
| type matches input.
|
| Examples
| --------
| See :ref:`texture_example`.
|
| threshold(self: '_DataSetType', value: 'float | VectorLike[float] | None' = None, scalars: 'str | None' = None, invert: 'bool' = False, continuous: 'bool' = False, preference: "Literal['point', 'cell']" = 'cell', all_scalars: 'bool' = False, component_mode: "Literal['component', 'all', 'any']" = 'all', component: 'int' = 0, method: "Literal['upper', 'lower']" = 'upper', progress_bar: 'bool' = False)
| Apply a :vtk:`vtkThreshold` filter to the input dataset.
|
| This filter will apply a :vtk:`vtkThreshold` filter to the input
| dataset and return the resulting object. This extracts cells
| where the scalar value in each cell satisfies the threshold
| criterion. If ``scalars`` is ``None``, the input's active
| scalars array is used.
|
| .. warning::
| Thresholding is inherently a cell operation, even though it can use
| associated point data for determining whether to keep a cell. In
| other words, whether or not a given point is included after
| thresholding depends on whether that point is part of a cell that
| is kept after thresholding.
|
| Please also note the default ``preference`` choice for CELL data
| over POINT data. This is contrary to most other places in PyVista's
| API where the preference typically defaults to POINT data. We chose
| to prefer CELL data here so that if thresholding by a named array
| that exists for both the POINT and CELL data, this filter will
| default to the CELL data array while performing the CELL-wise
| operation.
|
| Parameters
| ----------
| value : float | sequence[float], optional
| Single value or ``(min, max)`` to be used for the data threshold. If
| a sequence, then length must be 2. If no value is specified, the
| non-NaN data range will be used to remove any NaN values.
| Please reference the ``method`` parameter for how single values
| are handled.
|
| scalars : str, optional
| Name of scalars to threshold on. Defaults to currently active scalars.
|
| invert : bool, default: False
| Invert the threshold results. That is, cells that would have been
| in the output with this option off are excluded, while cells that
| would have been excluded from the output are included.
|
| continuous : bool, default: False
| When True, the continuous interval [minimum cell scalar,
| maximum cell scalar] will be used to intersect the threshold bound,
| rather than the set of discrete scalar values from the vertices.
|
| preference : str, default: 'cell'
| When ``scalars`` is specified, this is the preferred array
| type to search for in the dataset. Must be either
| ``'point'`` or ``'cell'``. Throughout PyVista, the preference
| is typically ``'point'`` but since the threshold filter is a
| cell-wise operation, we prefer cell data for thresholding
| operations.
|
| all_scalars : bool, default: False
| If using scalars from point data, all
| points in a cell must satisfy the threshold when this
| value is ``True``. When ``False``, any point of the cell
| with a scalar value satisfying the threshold criterion
| will extract the cell. Has no effect when using cell data.
|
| component_mode : {'component', 'all', 'any'}
| The method to satisfy the criteria for the threshold of
| multicomponent scalars. 'component' (default)
| uses only the ``component``. 'all' requires all
| components to meet criteria. 'any' is when
| any component satisfies the criteria.
|
| component : int, default: 0
| When using ``component_mode='component'``, this sets
| which component to threshold on.
|
| method : str, default: 'upper'
| Set the threshold method for single-values, defining which
| threshold bounds to use. If the ``value`` is a range, this
| parameter will be ignored, extracting data between the two
| values. For single values, ``'lower'`` will extract data
| lower than the ``value``. ``'upper'`` will extract data
| larger than the ``value``.
|
| progress_bar : bool, default: False
| Display a progress bar to indicate progress.
|
| See Also
| --------
| threshold_percent
| Threshold a dataset by a percentage of its scalar range.
| :meth:`~pyvista.DataSetFilters.remove_nan_cells`
| Convenience wrapper to remove cells containing NaN values.
| :meth:`~pyvista.DataSetFilters.extract_values`
| Threshold-like filter for extracting specific values and ranges.
| :meth:`~pyvista.ImageDataFilters.image_threshold`
| Similar method for thresholding :class:`~pyvista.ImageData`.
| :meth:`~pyvista.ImageDataFilters.select_values`
| Threshold-like filter for ``ImageData`` to keep some values and replace others.
| :ref:`compare_threshold_filters_example`
| This example showcases this filter and
| other similar ones.
|
|
| Returns
| -------
| pyvista.UnstructuredGrid
| Dataset containing geometry that meets the threshold requirements.
|
| Examples
| --------
| >>> import pyvista as pv
| >>> import numpy as np
| >>> volume = np.zeros([10, 10, 10])
| >>> volume[:3] = 1
| >>> vol = pv.wrap(volume)
| >>> threshed = vol.threshold(0.1)
| >>> threshed
| UnstructuredGrid (...)
| N Cells: 243
| N Points: 400
| X Bounds: 0.000e+00, 3.000e+00
| Y Bounds: 0.000e+00, 9.000e+00
| Z Bounds: 0.000e+00, 9.000e+00
| N Arrays: 1
|
| Apply the threshold filter to Perlin noise. First generate
| the structured grid.
|
| >>> import pyvista as pv
| >>> noise = pv.perlin_noise(0.1, (1, 1, 1), (0, 0, 0))
| >>> grid = pv.sample_function(
| ... noise, bounds=[0, 1.0, -0, 1.0, 0, 1.0], dim=(20, 20, 20)
| ... )
| >>> grid.plot(
| ... cmap='gist_earth_r',
| ... show_scalar_bar=True,
| ... show_edges=False,
| ... )
|
| Next, apply the threshold.
|
| >>> import pyvista as pv
| >>> noise = pv.perlin_noise(0.1, (1, 1, 1), (0, 0, 0))
| >>> grid = pv.sample_function(
| ... noise, bounds=[0, 1.0, -0, 1.0, 0, 1.0], dim=(20, 20, 20)
| ... )
| >>> threshed = grid.threshold(value=0.02)
| >>> threshed.plot(
| ... cmap='gist_earth_r',
| ... show_scalar_bar=False,
| ... show_edges=True,
| ... )
|
| See :ref:`using_filters_example` and :ref:`image_representations_example`
| for more examples using this filter.
|
| threshold_percent(self: '_DataSetType', percent: 'float' = 0.5, scalars: 'str | None' = None, invert: 'bool' = False, continuous: 'bool' = False, preference: "Literal['point', 'cell']" = 'cell', method: "Literal['upper', 'lower']" = 'upper', progress_bar: 'bool' = False)
| Threshold the dataset by a percentage of its range on the active scalars array.
|
| .. warning::
| Thresholding is inherently a cell operation, even though it can use
| associated point data for determining whether to keep a cell. In
| other words, whether or not a given point is included after
| thresholding depends on whether that point is part of a cell that
| is kept after thresholding.
|
| Parameters
| ----------
| percent : float | sequence[float], optional
| The percentage in the range ``(0, 1)`` to threshold. If value is
| out of 0 to 1 range, then it will be divided by 100 and checked to
| be in that range.
|
| scalars : str, optional
| Name of scalars to threshold on. Defaults to currently active scalars.
|
| invert : bool, default: False
| Invert the threshold results. That is, cells that would have been
| in the output with this option off are excluded, while cells that
| would have been excluded from the output are included.
|
| continuous : bool, default: False
| When True, the continuous interval [minimum cell scalar,
| maximum cell scalar] will be used to intersect the threshold bound,
| rather than the set of discrete scalar values from the vertices.
|
| preference : str, default: 'cell'
| When ``scalars`` is specified, this is the preferred array
| type to search for in the dataset. Must be either
| ``'point'`` or ``'cell'``. Throughout PyVista, the preference
| is typically ``'point'`` but since the threshold filter is a
| cell-wise operation, we prefer cell data for thresholding
| operations.
|
| method : str, default: 'upper'
| Set the threshold method for single-values, defining which
| threshold bounds to use. If the ``value`` is a range, this
| parameter will be ignored, extracting data between the two
| values. For single values, ``'lower'`` will extract data
| lower than the ``value``. ``'upper'`` will extract data
| larger than the ``value``.
|
| progress_bar : bool, default: False
| Display a progress bar to indicate progress.
|
| Returns
| -------
| pyvista.UnstructuredGrid
| Dataset containing geometry that meets the threshold requirements.
|
| See Also
| --------
| threshold
| Threshold a dataset by value.
|
| Examples
| --------
| Apply a 50% threshold filter.
|
| >>> import pyvista as pv
| >>> noise = pv.perlin_noise(0.1, (2, 2, 2), (0, 0, 0))
| >>> grid = pv.sample_function(
| ... noise, bounds=[0, 1.0, -0, 1.0, 0, 1.0], dim=(30, 30, 30)
| ... )
| >>> threshed = grid.threshold_percent(0.5)
| >>> threshed.plot(
| ... cmap='gist_earth_r',
| ... show_scalar_bar=False,
| ... show_edges=True,
| ... )
|
| Apply a 80% threshold filter.
|
| >>> threshed = grid.threshold_percent(0.8)
| >>> threshed.plot(
| ... cmap='gist_earth_r',
| ... show_scalar_bar=False,
| ... show_edges=True,
| ... )
|
| See :ref:`using_filters_example` for more examples using a similar filter.
|
| voxelize(self: 'DataSet', *, reference_volume: 'ImageData | None' = None, dimensions: 'VectorLike[int] | None' = None, spacing: 'float | VectorLike[float] | None' = None, rounding_func: 'Callable[[VectorLike[float]], VectorLike[int]] | None' = None, cell_length_percentile: 'float | None' = None, cell_length_sample_size: 'int | None' = None, progress_bar: 'bool' = False) -> 'UnstructuredGrid'
| Voxelize mesh to UnstructuredGrid.
|
| The voxelization can be controlled in several ways:
|
| #. Specify the output geometry using a ``reference_volume``.
|
| #. Specify the ``spacing`` explicitly.
|
| #. Specify the ``dimensions`` explicitly.
|
| #. Specify the ``cell_length_percentile``. The spacing is estimated from the
| surface's cells using the specified percentile.
|
| Use ``reference_volume`` for full control of the output geometry. For
| all other options, the geometry is implicitly defined such that the generated
| mesh fits the bounds of the input mesh.
|
| If no inputs are provided, ``cell_length_percentile=0.1`` (10th percentile) is
| used by default to estimate the spacing.
|
| .. versionadded:: 0.46
|
| .. note::
|
| This method is a wrapper around :meth:`voxelize_binary_mask`. See that
| method for additional information.
|
| Parameters
| ----------
| reference_volume : ImageData, optional
| Volume to use as a reference. The output will have the same ``dimensions``,
| and ``spacing`` as the reference.
|
| dimensions : VectorLike[int], optional
| Dimensions of the voxelized mesh. Set this value to control the
| dimensions explicitly. If unset, the dimensions are defined implicitly
| through other parameter. See summary and examples for details.
|
| .. note::
|
| Dimensions is the number of points along each axis, not cells. Set
| dimensions to ``N+1`` instead for ``N`` cells along each axis.
|
| spacing : float | VectorLike[float], optional
| Approximate spacing to use for the generated mesh. Set this value
| to control the spacing explicitly. If unset, the spacing is defined
| implicitly through other parameters. See summary and examples for details.
|
| rounding_func : Callable[VectorLike[float], VectorLike[int]], optional
| Control how the dimensions are rounded to integers based on the provided or
| calculated ``spacing``. Should accept a length-3 vector containing the
| dimension values along the three directions and return a length-3 vector.
| :func:`numpy.round` is used by default.
|
| Rounding the dimensions implies rounding the actual spacing.
|
| Has no effect if ``dimensions`` is specified.
|
| cell_length_percentile : float, optional
| Cell length percentage ``p`` to use for computing the default ``spacing``.
| Default is ``0.1`` (10th percentile) and must be between ``0`` and ``1``.
| The ``p``-th percentile is computed from the cumulative distribution function
| (CDF) of lengths which are representative of the cell length scales present
| in the input. The CDF is computed by:
|
| #. Triangulating the input cells.
| #. Sampling a subset of up to ``cell_length_sample_size`` cells.
| #. Computing the distance between two random points in each cell.
| #. Inserting the distance into an ordered set to create the CDF.
|
| Has no effect if ``dimensions`` is specified.
|
| cell_length_sample_size : int, optional
| Number of samples to use for the cumulative distribution function (CDF)
| when using the ``cell_length_percentile`` option. ``100 000`` samples are
| used by default.
|
| progress_bar : bool, default: False
| Display a progress bar to indicate progress.
|
| Returns
| -------
| UnstructuredGrid
| Voxelized unstructured grid of the original mesh.
|
| See Also
| --------
| voxelize_rectilinear
| Similar function that returns a :class:`~pyvista.RectilinearGrid` with cell data.
|
| voxelize_binary_mask
| Similar function that returns a :class:`~pyvista.ImageData` with point data.
|
| Examples
| --------
| Create a voxelized mesh with uniform spacing.
|
| >>> import numpy as np
| >>> import pyvista as pv
| >>> from pyvista import examples
| >>> mesh = examples.download_bunny_coarse()
| >>> vox = mesh.voxelize(spacing=0.01)
| >>> vox.plot(show_edges=True)
|
| Create a voxelized mesh using non-uniform spacing.
|
| >>> vox = mesh.voxelize(spacing=(0.01, 0.005, 0.002))
| >>> vox.plot(show_edges=True)
|
| The bounds of the voxelized mesh always match the bounds of the input.
|
| >>> mesh.bounds
| BoundsTuple(x_min = -0.13155962526798248,
| x_max = 0.18016336858272552,
| y_min = -0.12048563361167908,
| y_max = 0.18769524991512299,
| z_min = -0.14300920069217682,
| z_max = 0.09850578755140305)
|
| >>> vox.bounds
| BoundsTuple(x_min = -0.13155962526798248,
| x_max = 0.18016336858272552,
| y_min = -0.12048563361167908,
| y_max = 0.18769524991512299,
| z_min = -0.14300920069217682,
| z_max = 0.09650979936122894)
|
| Create a voxelized mesh with ``3 x 4 x 5`` cells. Since ``dimensions`` is the
| number of points, not cells, we need to add ``1`` to get the number of desired cells.
|
| >>> mesh = pv.Box()
| >>> cell_dimensions = np.array((3, 4, 5))
| >>> vox = mesh.voxelize(dimensions=cell_dimensions + 1)
| >>> vox.plot(show_edges=True)
|
| voxelize_binary_mask(self: 'DataSet', *, background_value: 'int | float' = 0, foreground_value: 'int | float' = 1, reference_volume: 'ImageData | None' = None, dimensions: 'VectorLike[int] | None' = None, spacing: 'float | VectorLike[float] | None' = None, rounding_func: 'Callable[[VectorLike[float]], VectorLike[int]] | None' = None, cell_length_percentile: 'float | None' = None, cell_length_sample_size: 'int | None' = None, progress_bar: 'bool' = False)
| Voxelize mesh as a binary :class:`~pyvista.ImageData` mask.
|
| The binary mask is a point data array where points inside and outside of the
| input surface are labelled with ``foreground_value`` and ``background_value``,
| respectively.
|
| This filter implements :vtk:`vtkPolyDataToImageStencil`. This
| algorithm operates as follows:
|
| * The algorithm iterates through the z-slice of the ``reference_volume``.
| * For each slice, it cuts the input :class:`~pyvista.PolyData` surface to create
| 2D polylines at that z position. It attempts to close any open polylines.
| * For each x position along the polylines, the corresponding y positions are
| determined.
| * For each slice, the grid points are labelled as foreground or background based
| on their xy coordinates.
|
| The voxelization can be controlled in several ways:
|
| #. Specify the output geometry using a ``reference_volume``.
|
| #. Specify the ``spacing`` explicitly.
|
| #. Specify the ``dimensions`` explicitly.
|
| #. Specify the ``cell_length_percentile``. The spacing is estimated from the
| surface's cells using the specified percentile.
|
| Use ``reference_volume`` for full control of the output mask's geometry. For
| all other options, the geometry is implicitly defined such that the generated
| mask fits the bounds of the input surface.
|
| If no inputs are provided, ``cell_length_percentile=0.1`` (10th percentile) is
| used by default to estimate the spacing. On systems with VTK < 9.2, the default
| spacing is set to ``1/100`` of the input mesh's length.
|
| .. versionadded:: 0.45.0
|
| .. note::
| For best results, ensure the input surface is a closed surface. The
| surface is considered closed if it has zero :attr:`~pyvista.PolyData.n_open_edges`.
|
| .. note::
| This filter returns voxels represented as point data, not
| :attr:`~pyvista.CellType.VOXEL` cells.
| This differs from :func:`~pyvista.voxelize` and :func:`~pyvista.voxelize_volume`
| which return meshes with voxel cells. See :ref:`image_representations_example`
| for examples demonstrating the difference.
|
| .. note::
| This filter does not discard internal surfaces, due, for instance, to
| intersecting meshes. Instead, the intersection will be considered as
| background which may produce unexpected results. See `Examples`.
|
| Parameters
| ----------
| background_value : int, default: 0
| Background value of the generated mask.
|
| foreground_value : int, default: 1
| Foreground value of the generated mask.
|
| reference_volume : ImageData, optional
| Volume to use as a reference. The output will have the same ``dimensions``,
| ``origin``, ``spacing``, and ``direction_matrix`` as the reference.
|
| dimensions : VectorLike[int], optional
| Dimensions of the generated mask image. Set this value to control the
| dimensions explicitly. If unset, the dimensions are defined implicitly
| through other parameter. See summary and examples for details.
|
| spacing : float | VectorLike[float], optional
| Approximate spacing to use for the generated mask image. Set this value
| to control the spacing explicitly. If unset, the spacing is defined
| implicitly through other parameters. See summary and examples for details.
|
| rounding_func : Callable[VectorLike[float], VectorLike[int]], optional
| Control how the dimensions are rounded to integers based on the provided or
| calculated ``spacing``. Should accept a length-3 vector containing the
| dimension values along the three directions and return a length-3 vector.
| :func:`numpy.round` is used by default.
|
| Rounding the dimensions implies rounding the actual spacing.
|
| Has no effect if ``reference_volume`` or ``dimensions`` are specified.
|
| cell_length_percentile : float, optional
| Cell length percentage ``p`` to use for computing the default ``spacing``.
| Default is ``0.1`` (10th percentile) and must be between ``0`` and ``1``.
| The ``p``-th percentile is computed from the cumulative distribution function
| (CDF) of lengths which are representative of the cell length scales present
| in the input. The CDF is computed by:
|
| #. Triangulating the input cells.
| #. Sampling a subset of up to ``cell_length_sample_size`` cells.
| #. Computing the distance between two random points in each cell.
| #. Inserting the distance into an ordered set to create the CDF.
|
| Has no effect if ``dimensions`` or ``reference_volume`` are specified.
|
| .. note::
| This option is only available for VTK 9.2 or greater.
|
| cell_length_sample_size : int, optional
| Number of samples to use for the cumulative distribution function (CDF)
| when using the ``cell_length_percentile`` option. ``100 000`` samples are
| used by default.
|
| progress_bar : bool, default: False
| Display a progress bar to indicate progress.
|
| Returns
| -------
| ImageData
| Generated binary mask with a ``'mask'`` point data array. The data array
| has dtype :class:`numpy.uint8` if the foreground and background values are
| unsigned and less than 256.
|
| See Also
| --------
| voxelize
| Similar function that returns a :class:`~pyvista.UnstructuredGrid` of
| :attr:`~pyvista.CellType.VOXEL` cells.
|
| voxelize_rectilinear
| Similar function that returns a :class:`~pyvista.RectilinearGrid` with cell data.
|
| pyvista.ImageDataFilters.contour_labels
| Filter that generates surface contours from labeled image data. Can be
| loosely considered as an inverse of this filter.
|
| pyvista.ImageDataFilters.points_to_cells
| Convert voxels represented as points to :attr:`~pyvista.CellType.VOXEL`
| cells.
|
| ImageData
| Class used to build custom ``reference_volume``.
|
| Examples
| --------
| Generate a binary mask from a coarse mesh.
|
| >>> import numpy as np
| >>> import pyvista as pv
| >>> from pyvista import examples
| >>> poly = examples.download_bunny_coarse()
| >>> mask = poly.voxelize_binary_mask()
|
| The mask is stored as :class:`~pyvista.ImageData` with point data scalars
| (zeros for background, ones for foreground).
|
| >>> mask
| ImageData (...)
| N Cells: 7056
| N Points: 8228
| X Bounds: -1.245e-01, 1.731e-01
| Y Bounds: -1.135e-01, 1.807e-01
| Z Bounds: -1.359e-01, 9.140e-02
| Dimensions: 22, 22, 17
| Spacing: 1.417e-02, 1.401e-02, 1.421e-02
| N Arrays: 1
|
| >>> np.unique(mask.point_data['mask'])
| pyvista_ndarray([0, 1], dtype=uint8)
|
| To visualize it as voxel cells, use :meth:`~pyvista.ImageDataFilters.points_to_cells`,
| then use :meth:`~pyvista.DataSetFilters.threshold` to extract the foreground.
|
| We also plot the voxel cells in blue and the input poly data in green for
| comparison.
|
| >>> def mask_and_polydata_plotter(mask, poly):
| ... voxel_cells = mask.points_to_cells().threshold(0.5)
| ...
| ... pl = pv.Plotter()
| ... _ = pl.add_mesh(voxel_cells, color='blue')
| ... _ = pl.add_mesh(poly, color='lime')
| ... pl.camera_position = 'xy'
| ... return pl
|
| >>> pl = mask_and_polydata_plotter(mask, poly)
| >>> pl.show()
|
| The spacing of the mask image is automatically adjusted to match the
| density of the input.
|
| Repeat the previous example with a finer mesh.
|
| >>> poly = examples.download_bunny()
| >>> mask = poly.voxelize_binary_mask()
| >>> pl = mask_and_polydata_plotter(mask, poly)
| >>> pl.show()
|
| Control the spacing manually instead. Here, a very coarse spacing is used.
|
| >>> mask = poly.voxelize_binary_mask(spacing=(0.01, 0.04, 0.02))
| >>> pl = mask_and_polydata_plotter(mask, poly)
| >>> pl.show()
|
| Note that the spacing is only approximate. Check the mask's actual spacing.
|
| >>> mask.spacing
| (0.009731187485158443, 0.03858340159058571, 0.020112216472625732)
|
| The actual values may be greater or less than the specified values. Use
| ``rounding_func=np.floor`` to force all values to be greater.
|
| >>> mask = poly.voxelize_binary_mask(
| ... spacing=(0.01, 0.04, 0.02), rounding_func=np.floor
| ... )
| >>> mask.spacing
| (0.01037993331750234, 0.05144453545411428, 0.020112216472625732)
|
| Set the dimensions instead of the spacing.
|
| >>> mask = poly.voxelize_binary_mask(dimensions=(10, 20, 30))
| >>> pl = mask_and_polydata_plotter(mask, poly)
| >>> pl.show()
|
| >>> mask.dimensions
| (10, 20, 30)
|
| Create a mask using a reference volume. First generate polydata from
| an existing mask.
|
| >>> volume = examples.load_frog_tissues()
| >>> poly = volume.contour_labels()
|
| Now create the mask from the polydata using the volume as a reference.
|
| >>> mask = poly.voxelize_binary_mask(reference_volume=volume)
| >>> pl = mask_and_polydata_plotter(mask, poly)
| >>> pl.show()
|
| Visualize the effect of internal surfaces.
|
| >>> mesh = pv.Cylinder() + pv.Cylinder(center=(0, 0.75, 0))
| >>> binary_mask = mesh.voxelize_binary_mask(
| ... dimensions=(1, 100, 50)
| ... ).points_to_cells()
| >>> pl = pv.Plotter()
| >>> _ = pl.add_mesh(binary_mask)
| >>> _ = pl.add_mesh(mesh.slice(), color='red')
| >>> pl.show(cpos='yz')
|
| Note how the intersection is excluded from the mask.
| To include the voxels delimited by internal surfaces in the foreground, the internal
| surfaces should be removed, for instance by applying a boolean union. Note that
| this operation in unreliable in VTK but may be performed with external tools such
| as `vtkbool <https://github.com/zippy84/vtkbool>`_.
|
| Alternatively, the intersecting parts of the mesh can be processed sequentially.
|
| >>> cylinder_1 = pv.Cylinder()
| >>> cylinder_2 = pv.Cylinder(center=(0, 0.75, 0))
|
| >>> reference_volume = pv.ImageData(
| ... dimensions=(1, 100, 50),
| ... spacing=(1, 0.0175, 0.02),
| ... origin=(0, -0.5 + 0.0175 / 2, -0.5 + 0.02 / 2),
| ... )
|
| >>> binary_mask_1 = cylinder_1.voxelize_binary_mask(
| ... reference_volume=reference_volume
| ... ).points_to_cells()
| >>> binary_mask_2 = cylinder_2.voxelize_binary_mask(
| ... reference_volume=reference_volume
| ... ).points_to_cells()
|
| >>> binary_mask_1['mask'] = binary_mask_1['mask'] | binary_mask_2['mask']
|
| >>> pl = pv.Plotter()
| >>> _ = pl.add_mesh(binary_mask_1)
| >>> _ = pl.add_mesh(cylinder_1.slice(), color='red')
| >>> _ = pl.add_mesh(cylinder_2.slice(), color='red')
| >>> pl.show(cpos='yz')
|
| When multiple internal surfaces are nested, they are successively treated as
| interfaces between background and foreground.
|
| >>> mesh = pv.Tube(radius=2) + pv.Tube(radius=3) + pv.Tube(radius=4)
| >>> binary_mask = mesh.voxelize_binary_mask(
| ... dimensions=(1, 50, 50)
| ... ).points_to_cells()
| >>> pl = pv.Plotter()
| >>> _ = pl.add_mesh(binary_mask)
| >>> _ = pl.add_mesh(mesh.slice(), color='red')
| >>> pl.show(cpos='yz')
|
| voxelize_rectilinear(self: 'DataSet', *, background_value: 'int | float' = 0, foreground_value: 'int | float' = 1, reference_volume: 'ImageData | None' = None, dimensions: 'VectorLike[int] | None' = None, spacing: 'float | VectorLike[float] | None' = None, rounding_func: 'Callable[[VectorLike[float]], VectorLike[int]] | None' = None, cell_length_percentile: 'float | None' = None, cell_length_sample_size: 'int | None' = None, progress_bar: 'bool' = False) -> 'RectilinearGrid'
| Voxelize mesh to create a RectilinearGrid voxel volume.
|
| The voxelization can be controlled in several ways:
|
| #. Specify the output geometry using a ``reference_volume``.
|
| #. Specify the ``spacing`` explicitly.
|
| #. Specify the ``dimensions`` explicitly.
|
| #. Specify the ``cell_length_percentile``. The spacing is estimated from the
| surface's cells using the specified percentile.
|
| Use ``reference_volume`` for full control of the output grid's geometry. For
| all other options, the geometry is implicitly defined such that the generated
| grid fits the bounds of the input mesh.
|
| If no inputs are provided, ``cell_length_percentile=0.1`` (10th percentile) is
| used by default to estimate the spacing. On systems with VTK < 9.2, the default
| spacing is set to ``1/100`` of the input mesh's length.
|
| A point data array ``mask`` is included where points inside and outside of the
| input surface are labelled with ``foreground_value`` and ``background_value``,
| respectively.
|
| .. versionadded:: 0.46
|
| .. note::
|
| This method is a wrapper around :meth:`voxelize_binary_mask`. See that
| method for additional information.
|
| Parameters
| ----------
| background_value : int, default: 0
| Background value of the generated grid.
|
| foreground_value : int, default: 1
| Foreground value of the generated grid.
|
| reference_volume : ImageData, optional
| Volume to use as a reference. The output will have the same ``dimensions``,
| ``origin``, and ``spacing`` as the reference.
|
| dimensions : VectorLike[int], optional
| Dimensions of the generated rectilinear grid. Set this value to control the
| dimensions explicitly. If unset, the dimensions are defined implicitly
| through other parameter. See summary and examples for details.
|
| .. note::
|
| Dimensions is the number of points along each axis, not cells. Set
| dimensions to ``N+1`` instead for ``N`` cells along each axis.
|
| spacing : float | VectorLike[float], optional
| Approximate spacing to use for the generated grid. Set this value
| to control the spacing explicitly. If unset, the spacing is defined
| implicitly through other parameters. See summary and examples for details.
|
| rounding_func : Callable[VectorLike[float], VectorLike[int]], optional
| Control how the dimensions are rounded to integers based on the provided or
| calculated ``spacing``. Should accept a length-3 vector containing the
| dimension values along the three directions and return a length-3 vector.
| :func:`numpy.round` is used by default.
|
| Rounding the dimensions implies rounding the actual spacing.
|
| Has no effect if ``reference_volume`` or ``dimensions`` are specified.
|
| cell_length_percentile : float, optional
| Cell length percentage ``p`` to use for computing the default ``spacing``.
| Default is ``0.1`` (10th percentile) and must be between ``0`` and ``1``.
| The ``p``-th percentile is computed from the cumulative distribution function
| (CDF) of lengths which are representative of the cell length scales present
| in the input. The CDF is computed by:
|
| #. Triangulating the input cells.
| #. Sampling a subset of up to ``cell_length_sample_size`` cells.
| #. Computing the distance between two random points in each cell.
| #. Inserting the distance into an ordered set to create the CDF.
|
| Has no effect if ``dimensions`` or ``reference_volume`` are specified.
|
| .. note::
| This option is only available for VTK 9.2 or greater.
|
| cell_length_sample_size : int, optional
| Number of samples to use for the cumulative distribution function (CDF)
| when using the ``cell_length_percentile`` option. ``100 000`` samples are
| used by default.
|
| progress_bar : bool, default: False
| Display a progress bar to indicate progress.
|
| Returns
| -------
| RectilinearGrid
| RectilinearGrid as voxelized volume with discretized cells.
|
| See Also
| --------
| voxelize
| Similar function that returns a :class:`~pyvista.UnstructuredGrid` of
| :attr:`~pyvista.CellType.VOXEL` cells.
|
| voxelize_binary_mask
| Similar function that returns a :class:`~pyvista.ImageData` with point data.
|
| Examples
| --------
| Create a voxel volume of a nut. By default, the spacing is automatically
| estimated.
|
| >>> import pyvista as pv
| >>> from pyvista import examples
| >>> mesh = pv.examples.load_nut()
| >>> vox = mesh.voxelize_rectilinear()
|
| Plot the mesh together with its volume.
|
| >>> pl = pv.Plotter()
| >>> _ = pl.add_mesh(mesh=vox, show_edges=True)
| >>> _ = pl.add_mesh(mesh=mesh, show_edges=True, opacity=1)
| >>> pl.show()
|
| Load a mesh of a cow.
|
| >>> mesh = examples.download_cow()
|
| Create an equal density voxel volume and plot the result.
|
| >>> vox = mesh.voxelize_rectilinear(spacing=0.15)
| >>> cpos = pv.CameraPosition(
| ... position=(15, 3, 15), focal_point=(0, 0, 0), viewup=(0, 0, 0)
| ... )
| >>> vox.plot(scalars='mask', show_edges=True, cpos=cpos)
|
| Slice the voxel volume to view the ``mask`` scalars.
|
| >>> slices = vox.slice_orthogonal()
| >>> slices.plot(scalars='mask', show_edges=True)
|
| Create a voxel volume from unequal density dimensions and plot result.
|
| >>> vox = mesh.voxelize_rectilinear(spacing=(0.15, 0.15, 0.5))
| >>> vox.plot(scalars='mask', show_edges=True, cpos=cpos)
|
| Slice the unequal density voxel volume to view the ``mask`` scalars.
|
| >>> slices = vox.slice_orthogonal()
| >>> slices.plot(scalars='mask', show_edges=True, cpos=cpos)
|
| warp_by_scalar(self: '_DataSetType', scalars: 'str | None' = None, factor: 'float' = 1.0, normal: 'VectorLike[float] | None' = None, inplace: 'bool' = False, progress_bar: 'bool' = False, **kwargs)
| Warp the dataset's points by a point data scalars array's values.
|
| This modifies point coordinates by moving points along point
| normals by the scalar amount times the scale factor.
|
| Parameters
| ----------
| scalars : str, optional
| Name of scalars to warp by. Defaults to currently active scalars.
|
| factor : float, default: 1.0
| A scaling factor to increase the scaling effect. Alias
| ``scale_factor`` also accepted - if present, overrides ``factor``.
|
| normal : sequence, optional
| User specified normal. If given, data normals will be
| ignored and the given normal will be used to project the
| warp.
|
| inplace : bool, default: False
| If ``True``, the points of the given dataset will be updated.
|
| progress_bar : bool, default: False
| Display a progress bar to indicate progress.
|
| **kwargs : dict, optional
| Accepts ``scale_factor`` instead of ``factor``.
|
| Returns
| -------
| pyvista.DataSet
| Warped Dataset. Return type matches input.
|
| Examples
| --------
| First, plot the unwarped mesh.
|
| >>> from pyvista import examples
| >>> mesh = examples.download_st_helens()
| >>> mesh.plot(cmap='gist_earth', show_scalar_bar=False)
|
| Now, warp the mesh by the ``'Elevation'`` scalars.
|
| >>> warped = mesh.warp_by_scalar('Elevation')
| >>> warped.plot(cmap='gist_earth', show_scalar_bar=False)
|
| See :ref:`compute_normals_example` for more examples using this filter.
|
| warp_by_vector(self: '_DataSetType', vectors: 'str | None' = None, factor: 'float' = 1.0, inplace: 'bool' = False, progress_bar: 'bool' = False)
| Warp the dataset's points by a point data vectors array's values.
|
| This modifies point coordinates by moving points along point
| vectors by the local vector times the scale factor.
|
| A classical application of this transform is to visualize
| eigenmodes in mechanics.
|
| Parameters
| ----------
| vectors : str, optional
| Name of vector to warp by. Defaults to currently active vector.
|
| factor : float, default: 1.0
| A scaling factor that multiplies the vectors to warp by. Can
| be used to enhance the warping effect.
|
| inplace : bool, default: False
| If ``True``, the function will update the mesh in-place.
|
| progress_bar : bool, default: False
| Display a progress bar to indicate progress.
|
| Returns
| -------
| pyvista.PolyData
| The warped mesh resulting from the operation.
|
| Examples
| --------
| Warp a sphere by vectors.
|
| >>> import pyvista as pv
| >>> from pyvista import examples
| >>> sphere = examples.load_sphere_vectors()
| >>> warped = sphere.warp_by_vector()
| >>> pl = pv.Plotter(shape=(1, 2))
| >>> pl.subplot(0, 0)
| >>> actor = pl.add_text('Before warp')
| >>> actor = pl.add_mesh(sphere, color='white')
| >>> pl.subplot(0, 1)
| >>> actor = pl.add_text('After warp')
| >>> actor = pl.add_mesh(warped, color='white')
| >>> pl.show()
|
| See :ref:`warp_by_vector_example` and :ref:`warp_by_vector_eigenmodes_example` for
| more examples using this filter.
|
| ----------------------------------------------------------------------
| Readonly properties inherited from pyvista.core.utilities.misc._BoundsSizeMixin:
|
| bounds_size
| Return the size of each axis of the object's bounding box.
|
| .. versionadded:: 0.46
|
| Returns
| -------
| tuple[float, float, float]
| Size of each x-y-z axis.
|
| Examples
| --------
| Get the size of a cube. The cube has edge lengths af ``(1.0, 1.0, 1.0)``
| by default.
|
| >>> import pyvista as pv
| >>> mesh = pv.Cube()
| >>> mesh.bounds_size
| (1.0, 1.0, 1.0)
|
| ----------------------------------------------------------------------
| Data descriptors inherited from pyvista.core.utilities.misc._BoundsSizeMixin:
|
| __dict__
| dictionary for instance variables
|
| __weakref__
| list of weak references to the object
|
| ----------------------------------------------------------------------
| Methods inherited from pyvista.core.filters.data_object.DataObjectFilters:
|
| cell_centers(self: '_DataSetOrMultiBlockType', vertex: 'bool' = True, pass_cell_data: 'bool' = True, progress_bar: 'bool' = False)
| Generate points at the center of the cells in this dataset.
|
| These points can be used for placing glyphs or vectors.
|
| Parameters
| ----------
| vertex : bool, default: True
| Enable or disable the generation of vertex cells.
|
| pass_cell_data : bool, default: True
| If enabled, pass the input cell data through to the output.
|
| progress_bar : bool, default: False
| Display a progress bar to indicate progress.
|
| Returns
| -------
| pyvista.PolyData
| Polydata where the points are the cell centers of the
| original dataset.
|
| Examples
| --------
| >>> import pyvista as pv
| >>> mesh = pv.Plane()
| >>> mesh.point_data.clear()
| >>> centers = mesh.cell_centers()
| >>> pl = pv.Plotter()
| >>> actor = pl.add_mesh(mesh, show_edges=True)
| >>> actor = pl.add_points(
| ... centers,
| ... render_points_as_spheres=True,
| ... color='red',
| ... point_size=20,
| ... )
| >>> pl.show()
|
| See :ref:`cell_centers_example` for more examples using this filter.
|
| cell_data_to_point_data(self: '_DataSetOrMultiBlockType', pass_cell_data: 'bool' = False, progress_bar: 'bool' = False)
| Transform cell data into point data.
|
| Point data are specified per node and cell data specified
| within cells. Optionally, the input point data can be passed
| through to the output.
|
| The method of transformation is based on averaging the data
| values of all cells using a particular point. Optionally, the
| input cell data can be passed through to the output as well.
|
| Parameters
| ----------
| pass_cell_data : bool, default: False
| If enabled, pass the input cell data through to the output.
|
| progress_bar : bool, default: False
| Display a progress bar to indicate progress.
|
| Returns
| -------
| output : DataSet | MultiBlock
| Dataset with the point data transformed into cell data.
| Return type matches input.
|
| See Also
| --------
| point_data_to_cell_data
| Similar transformation applied to point data.
| :meth:`~pyvista.ImageDataFilters.cells_to_points`
| Re-mesh :class:`~pyvista.ImageData` to a points-based representation.
|
| Examples
| --------
| First compute the face area of the example airplane mesh and
| show the cell values. This is to show discrete cell data.
|
| >>> from pyvista import examples
| >>> surf = examples.load_airplane()
| >>> surf = surf.compute_cell_sizes(length=False, volume=False)
| >>> surf.plot(scalars='Area')
|
| These cell scalars can be applied to individual points to
| effectively smooth out the cell data onto the points.
|
| >>> from pyvista import examples
| >>> surf = examples.load_airplane()
| >>> surf = surf.compute_cell_sizes(length=False, volume=False)
| >>> surf = surf.cell_data_to_point_data()
| >>> surf.plot(scalars='Area')
|
| cell_quality(self: '_DataSetOrMultiBlockType', quality_measure: "Literal['all', 'all_valid'] | _CellQualityLiteral | Sequence[_CellQualityLiteral]" = 'scaled_jacobian', *, null_value: 'float' = -1.0, progress_bar: 'bool' = False) -> '_DataSetOrMultiBlockType'
| Compute a function of (geometric) quality for each cell of a mesh.
|
| The per-cell quality is added to the mesh's cell data, in an array with
| the same name as the quality measure. Cell types not supported by this
| filter or undefined quality of supported cell types will have an
| entry of ``-1``.
|
| See the :ref:`cell_quality_measures_table` below for all measures and the
| :class:`~pyvista.CellType` supported by each one.
| Defaults to computing the ``scaled_jacobian`` quality measure.
|
| .. _cell_quality_measures_table:
|
| .. include:: /api/core/cell_quality/cell_quality_measures_table.rst
|
| .. note::
|
| Refer to the `Verdict Library Reference Manual <https://github.com/sandialabs/verdict/raw/master/SAND2007-2853p.pdf>`_
| for low-level technical information about how each metric is computed.
|
| .. versionadded:: 0.45
|
| Parameters
| ----------
| quality_measure : str | sequence[str], default: 'scaled_jacobian'
| The cell quality measure(s) to use. May be either:
|
| - A single measure or a sequence of measures listed in
| :ref:`cell_quality_measures_table`.
| - ``'all'`` to compute all measures.
| - ``'all_valid'`` to only keep quality measures that are valid for the mesh's
| cell type(s).
|
| A separate array is created for each measure.
|
| null_value : float, default: -1.0
| Float value for undefined quality. Undefined quality are qualities
| that could be addressed by this filter but is not well defined for
| the particular geometry of cell in question, e.g. a volume query
| for a triangle. Undefined quality will always be undefined.
| The default value is -1.
|
| progress_bar : bool, default: False
| Display a progress bar to indicate progress.
|
| Returns
| -------
| output : DataSet | MultiBlock
| Dataset with the computed mesh quality. Return type matches input.
| Cell data array(s) with the computed quality measure(s) are included.
|
| See Also
| --------
| :func:`~pyvista.cell_quality_info`
| Return information about a cell's quality measure, e.g. acceptable range.
| :meth:`~pyvista.DataObjectFilters.cell_validator`
| :meth:`~pyvista.DataObjectFilters.validate_mesh`
|
| Examples
| --------
| Compute and plot the minimum angle of a sample sphere mesh.
|
| >>> import pyvista as pv
| >>> sphere = pv.Sphere(theta_resolution=20, phi_resolution=20)
| >>> cqual = sphere.cell_quality('min_angle')
| >>> cqual.plot(show_edges=True)
|
| Quality measures like ``'volume'`` do not apply to 2D cells, and a null value
| of ``-1`` is returned.
|
| >>> qual = sphere.cell_quality('volume')
| >>> qual.get_data_range('volume')
| (np.float64(-1.0), np.float64(-1.0))
|
| Compute all valid quality measures for the sphere. These measures all return
| non-null values for :attr:`~pyvista.CellType.TRIANGLE` cells.
|
| >>> cqual = sphere.cell_quality('all_valid')
| >>> valid_measures = cqual.cell_data.keys()
| >>> valid_measures # doctest: +NORMALIZE_WHITESPACE
| ['area',
| 'aspect_frobenius',
| 'aspect_ratio',
| 'condition',
| 'distortion',
| 'max_angle',
| 'min_angle',
| 'radius_ratio',
| 'relative_size_squared',
| 'scaled_jacobian',
| 'shape',
| 'shape_and_size']
|
| See :ref:`mesh_quality_example` for more examples using this filter.
|
| cell_validator(self: '_DataSetOrMultiBlockType', *, tolerance: 'float | None' = None, planarity_tolerance: 'float | None' = None, size_tolerance: 'float | None' = None)
| Check the validity of each cell in this dataset.
|
| The status of each cell is encoded as a bit field cell data array ``'validity_state'``.
| The possible cell status values are:
|
|
| - :attr:`~pyvista.CellStatus.VALID`: Cell is valid and has no issues.
| - :attr:`~pyvista.CellStatus.COINCIDENT_POINTS`: Cell has duplicate coordinates or repeated use of the same connectivity entry.
| - :attr:`~pyvista.CellStatus.DEGENERATE_FACES`: Face(s) collapse to a line or a point through repeated collocated vertices.
| - :attr:`~pyvista.CellStatus.INTERSECTING_EDGES`: 2D cell has two edges that intersect.
| - :attr:`~pyvista.CellStatus.INTERSECTING_FACES`: 3D cell has two faces that intersect.
| - :attr:`~pyvista.CellStatus.INVALID_POINT_REFERENCES`: Cell references points outside the mesh's :class:`~pyvista.DataSet.points` array.
| - :attr:`~pyvista.CellStatus.INVERTED_FACES`: Cell face(s) do not point in the direction required by its :class:`~pyvista.CellType`.
| - :attr:`~pyvista.CellStatus.NEGATIVE_SIZE`: 1D, 2D, or 3D cell has negative length, area, or volume, respectively.
| - :attr:`~pyvista.CellStatus.NON_CONTIGUOUS_EDGES`: 2D cell's perimeter edges are not contiguous.
| - :attr:`~pyvista.CellStatus.NON_CONVEX`: 2D or 3D cell is not convex.
| - :attr:`~pyvista.CellStatus.NON_PLANAR_FACES`: Vertices for a face do not all lie in the same plane.
| - :attr:`~pyvista.CellStatus.WRONG_NUMBER_OF_POINTS`: Cell does not have the minimum number of points needed to describe it.
| - :attr:`~pyvista.CellStatus.ZERO_SIZE`: 1D, 2D, or 3D cell has zero length, area, or volume, respectively.
|
| Internally, :vtk:`vtkCellValidator` is first used to determine the initial status of each
| cell, then additional PyVista-exclusive checks are made and encoded in the validity state.
|
| For convenience, a field data array for each status is also appended:
|
| - Each field data array contains the indices of cells with the specified status.
| - The array names are lower-case versions of the status names above.
| - The ``VALID`` status is excluded from the field data, and an array named ``'invalid'``
| is included instead with cell ids for all invalid cells.
|
| .. versionadded:: 0.47
|
| .. versionchanged:: 0.48
| Include cell status checks for
| :attr:`~pyvista.CellStatus.INVALID_POINT_REFERENCES`,
| :attr:`~pyvista.CellStatus.ZERO_SIZE`,
| :attr:`~pyvista.CellStatus.NEGATIVE_SIZE`.
|
| .. versionchanged:: 0.48
| The ``'validity_state'`` array is now a 64-bit integer array. Previously, it was a
| 16-bit array.
|
| .. versionadded:: 0.48
| Add tolerance keywords.
|
| Parameters
| ----------
| tolerance : float, default: 1.1920929e-07
| Value used for most floating point equality checks throughout the cell checking
| process, e.g. for checking coincident points or intersecting edges.
| The default value is the epsilon (``eps``) of ``float32`` dtype using
| :attr:`numpy.finfo`.
|
| .. note::
| This tolerance is independent of other tolerances.
|
| planarity_tolerance : float, default: 0.1
| Allowed relative distance a planar polyhedral cell face may protrude out of
| its plane compared to the largest distance between a face center and
| any of its corner points. Defaults to 0.1, meaning any polygonal cell whose face
| protrudes more than 10% of their radius out of the plane will be marked as invalid
| with status :attr:`~pyvista.CellStatus.NON_PLANAR_FACES`.
|
| Set this value to 0 to disable planarity checks for polyhedron cells.
|
| .. note::
| This tolerance only applies to :attr:`~pyvista.CellType.POLYHEDRON` cells, and
| is independent of other tolerances.
|
| size_tolerance : float, optional
| Value used for evaluating the
| :meth:`size <pyvista.DataObjectFilters.compute_cell_sizes>` of a cell. Cells with an
| absolute size less than or equal to this value are flagged as having
| :attr:`~pyvista.CellStatus.ZERO_SIZE`, and
| cells with a size less than this value are flagged as having
| :attr:`~pyvista.CellStatus.NEGATIVE_SIZE`.
| The default value is the epsilon (``eps``) of the mesh's points dtype using
| :attr:`numpy.finfo`.
|
| Setting this tolerance explicitly may be useful for marking small cells as invalid.
|
| .. note::
| This tolerance is independent of any other tolerances.
|
| Returns
| -------
| DataSet
| Dataset with field data of cell validity.
|
| See Also
| --------
| :meth:`~pyvista.DataObjectFilters.validate_mesh`
| :meth:`~pyvista.DataObjectFilters.cell_quality`
| :ref:`mesh_validation_example`
|
| Examples
| --------
| Load a mesh with invalid cells.
|
| >>> import numpy as np
| >>> import pyvista as pv
| >>> from pyvista import examples
| >>> mesh = examples.download_cow()
|
| Validate the cells and show the included arrays.
|
| >>> validated = mesh.cell_validator()
| >>> validated.array_names # doctest: +NORMALIZE_WHITESPACE
| ['validity_state',
| 'invalid',
| 'coincident_points',
| 'degenerate_faces',
| 'intersecting_edges',
| 'intersecting_faces',
| 'invalid_point_references',
| 'inverted_faces',
| 'negative_size',
| 'non_contiguous_edges',
| 'non_convex',
| 'non_planar_faces',
| 'wrong_number_of_points',
| 'zero_size']
|
| There are many arrays, but most are empty. Show unique scalar values.
|
| >>> validity_state = validated.cell_data['validity_state']
| >>> np.unique(validity_state)
| pyvista_ndarray([ 0, 16])
|
| The ``0`` cells are valid, and the cells with value ``16`` (i.e. hex ``0x10``) have a
| nonconvex state. We confirm this by printing the ``'non_convex'`` array, which shows there
| are three invalid cells.
|
| >>> validated.field_data['non_convex']
| pyvista_ndarray([1013, 1532, 3250])
|
| Check the status of cells explicitly using :class:`~pyvista.CellStatus`. For checking
| if is a cell is valid, use equality ``==``.
|
| >>> validity_state[0] == pv.CellStatus.VALID
| np.True_
|
| >>> validity_state[1013] == pv.CellStatus.VALID
| np.False_
|
| Equality can also be used for checking specific status bits, but will only be ``True`` if
| the cell has exactly one status bit set.
|
| >>> validity_state[1013] == pv.CellStatus.NON_CONVEX
| np.True_
|
| In general, checking the status with bit operators should be preferred.
|
| >>> (
| ... validity_state[1013] & pv.CellStatus.NON_CONVEX
| ... ) == pv.CellStatus.NON_CONVEX
| np.True_
|
| We can also show all invalid cells. This matches the nonconvex ids, which confirms
| these are the only invalid cells.
|
| >>> validated.field_data['invalid']
| pyvista_ndarray([1013, 1532, 3250])
|
| Plot the cell states using :meth:`~pyvista.DataSetFilters.color_labels`. Orient the
| camera to show the underside of the cow where two of the invalid cells are located.
|
| >>> colored, color_map = validated.color_labels(
| ... scalars='validity_state', return_dict=True
| ... )
| >>> pl = pv.Plotter()
| >>> _ = pl.add_mesh(colored)
| >>> _ = pl.add_legend(color_map)
| >>> pl.view_xz()
| >>> pl.camera.zoom(2.5)
| >>> pl.show()
|
| Extract the invalid cells and plot them along with the original mesh as wireframe for
| context. Orient the camera to focus on the cow's left eye where the third invalid cell is
| located.
|
| >>> invalid_cells = mesh.extract_cells(validated['invalid'])
|
| >>> pl = pv.Plotter()
| >>> _ = pl.add_mesh(mesh, style='wireframe', color='light gray')
| >>> _ = pl.add_mesh(invalid_cells, color='lime')
| >>> pl.camera_position = pv.CameraPosition(
| ... position=(5.1, 1.8, -4.9),
| ... focal_point=(4.7, 1.8, 0.38),
| ... viewup=(0.0, 1.0, 0.0),
| ... )
| >>> pl.show()
|
| clip(self: '_DataSetOrMultiBlockType', normal: 'VectorLike[float] | _NormalsLiteral | None' = None, origin: 'VectorLike[float] | None' = None, invert: 'bool' = True, value: 'float' = 0.0, inplace: 'bool' = False, return_clipped: 'bool' = False, progress_bar: 'bool' = False, crinkle: 'bool' = False, plane: 'PolyData | None' = None)
| Clip a dataset by a plane by specifying the origin and normal.
|
| The origin and normal may be set explicitly or implicitly using a
| :func:`~pyvista.Plane`.
|
| If no parameters are given, the clip will occur in the center
| of the dataset along the x-axis.
|
| Parameters
| ----------
| normal : VectorLike[float] | str, optional
| Length-3 vector for the normal vector direction. Can also
| be specified as a string conventional direction such as
| ``'x'`` for ``(1, 0, 0)`` or ``'-x'`` for ``(-1, 0, 0)``, etc.
| The ``'x'`` direction is used by default.
|
| origin : VectorLike[float], optional
| The center ``(x, y, z)`` coordinate of the plane on which the clip
| occurs. The default is the center of the dataset.
|
| invert : bool, default: True
| If ``True``, remove mesh parts in the ``normal`` direction from ``origin``.
| If ``False``, remove parts in the opposite direction.
|
| value : float, default: 0.0
| Set the clipping value along the normal direction.
|
| inplace : bool, default: False
| Updates mesh in-place.
|
| return_clipped : bool, default: False
| Return both unclipped and clipped parts of the dataset.
|
| progress_bar : bool, default: False
| Display a progress bar to indicate progress.
|
| crinkle : bool, default: False
| Crinkle the clip by extracting the entire cells along the
| clip. This adds the ``"cell_ids"`` array to the ``cell_data``
| attribute that tracks the original cell IDs of the original
| dataset.
|
| plane : PolyData, optional
| :func:`~pyvista.Plane` mesh to use for clipping. Use this as an
| alternative to setting ``origin`` and ``normal``. The mean of the
| plane's normal vectors is used for the ``normal`` parameter and
| the mean of the plane's points is used for the ``origin`` parameter.
|
| .. versionadded:: 0.47
|
| Returns
| -------
| output : DataSet | MultiBlock | tuple[DataSet | MultiBlock, DataSet | MultiBlock]
| Clipped mesh when ``return_clipped=False`` or a tuple containing the
| unclipped and clipped meshes. Output mesh type matches input type for
| :class:`~pyvista.PointSet`, :class:`~pyvista.PolyData`, and
| :class:`~pyvista.MultiBlock`; otherwise the output type is
| :class:`~pyvista.UnstructuredGrid`.
|
| Examples
| --------
| Clip a cube along the +X direction. ``triangulate`` is used as
| the cube is initially composed of quadrilateral faces and
| subdivide only works on triangles.
|
| >>> import pyvista as pv
| >>> cube = pv.Cube().triangulate().subdivide(3)
| >>> clipped_cube = cube.clip()
| >>> clipped_cube.plot()
|
| Clip a cube in the +Z direction. This leaves half a cube
| below the XY plane.
|
| >>> import pyvista as pv
| >>> cube = pv.Cube().triangulate().subdivide(3)
| >>> clipped_cube = cube.clip('z')
| >>> clipped_cube.plot()
|
| See :ref:`clip_with_surface_example` for more examples using this filter.
|
| clip_box(self: '_DataSetOrMultiBlockType', bounds: 'float | VectorLike[float] | PolyData | None' = None, invert: 'bool' = True, factor: 'float' = 0.35, progress_bar: 'bool' = False, merge_points: 'bool' = True, crinkle: 'bool' = False)
| Clip a dataset by a bounding box defined by the bounds.
|
| If no bounds are given, a corner of the dataset bounds will be removed.
|
| Parameters
| ----------
| bounds : sequence[float], optional
| Length 6 sequence of floats: ``(x_min, x_max, y_min, y_max, z_min, z_max)``.
| Length 3 sequence of floats: distances from the min coordinate of
| of the input mesh. Single float value: uniform distance from the
| min coordinate. Length 12 sequence of length 3 sequence of floats:
| a plane collection (normal, center, ...).
| :class:`pyvista.PolyData`: if a poly mesh is passed that represents
| a box with 6 faces that all form a standard box, then planes will
| be extracted from the box to define the clipping region.
|
| invert : bool, default: True
| Flag on whether to flip/invert the clip.
|
| factor : float, default: 0.35
| If bounds are not given this is the factor along each axis to
| extract the default box.
|
| progress_bar : bool, default: False
| Display a progress bar to indicate progress.
|
| merge_points : bool, default: True
| If ``True``, coinciding points of independently defined mesh
| elements will be merged.
|
| crinkle : bool, default: False
| Crinkle the clip by extracting the entire cells along the
| clip. This adds the ``"cell_ids"`` array to the ``cell_data``
| attribute that tracks the original cell IDs of the original
| dataset.
|
| Returns
| -------
| pyvista.UnstructuredGrid
| Clipped dataset.
|
| Examples
| --------
| Clip a corner of a cube. The bounds of a cube are normally
| ``[-0.5, 0.5, -0.5, 0.5, -0.5, 0.5]``, and this removes 1/8 of
| the cube's surface.
|
| >>> import pyvista as pv
| >>> cube = pv.Cube().triangulate().subdivide(3)
| >>> clipped_cube = cube.clip_box([0, 1, 0, 1, 0, 1])
| >>> clipped_cube.plot()
|
| See :ref:`clip_with_plane_box_example` for more examples using this filter.
|
| clip_slab(self: '_DataSetOrMultiBlockType', thickness: 'float', normal: 'VectorLike[float] | _NormalsLiteral | None' = None, *, origin: 'VectorLike[float] | None' = None, invert: 'bool' = False, progress_bar: 'bool' = False, crinkle: 'bool' = False, plane: 'PolyData | None' = None)
| Clip a dataset by a slab of finite thickness around a plane.
|
| The slab is the volumetric region bounded by two parallel planes offset
| symmetrically by ``thickness / 2`` on each side of ``origin`` along
| ``normal``. This is sometimes called a "thick slice" because it yields
| a volumetric subset of the input rather than a 2D cross-section like
| :meth:`slice`.
|
| .. versionadded:: 0.48
|
| Parameters
| ----------
| thickness : float
| Total slab thickness measured perpendicular to ``normal``. Must be
| strictly positive. Half of ``thickness`` is applied on each side
| of ``origin``.
|
| normal : VectorLike[float] | str, optional
| Length-3 vector defining the slab's normal direction. Can also be
| specified as a string conventional direction such as ``'x'`` for
| ``(1, 0, 0)`` or ``'-x'`` for ``(-1, 0, 0)``, etc. The ``'x'``
| direction is used by default.
|
| origin : VectorLike[float], optional
| The center ``(x, y, z)`` coordinate of the slab. The default is
| the center of the dataset.
|
| invert : bool, default: False
| If ``False`` (the default), the slab interior is kept. If
| ``True``, the slab interior is removed and everything outside the
| two bounding planes is returned.
|
| progress_bar : bool, default: False
| Display a progress bar to indicate progress.
|
| crinkle : bool, default: False
| Crinkle the clip by extracting the entire cells along the slab
| boundaries. This adds the ``"cell_ids"`` array to the ``cell_data``
| attribute that tracks the original cell IDs of the input dataset.
|
| plane : PolyData, optional
| :func:`~pyvista.Plane` mesh to use for defining the slab orientation.
| Use this as an alternative to setting ``origin`` and ``normal``.
| The mean of the plane's normal vectors is used for the ``normal``
| parameter and the mean of the plane's points is used for the
| ``origin`` parameter.
|
| Returns
| -------
| pyvista.DataSet | pyvista.MultiBlock
| Clipped dataset. Output mesh type matches the input type for
| :class:`~pyvista.PointSet`, :class:`~pyvista.PolyData`, and
| :class:`~pyvista.MultiBlock`; otherwise the output type is
| :class:`~pyvista.UnstructuredGrid`.
|
| Raises
| ------
| ValueError
| If ``thickness`` is not strictly positive, or if ``normal`` is a
| zero vector.
|
| See Also
| --------
| clip
| clip_box
| slice
|
| Examples
| --------
| Extract a thick slab through the center of a sphere along the
| ``z``-axis.
|
| >>> import pyvista as pv
| >>> sphere = pv.Sphere()
| >>> slab = sphere.clip_slab(thickness=0.2, normal='z')
| >>> slab.plot(show_edges=True)
|
| compute_cell_sizes(self: '_DataSetOrMultiBlockType', length: 'bool' = True, area: 'bool' = True, volume: 'bool' = True, progress_bar: 'bool' = False, vertex_count: 'bool' = False)
| Compute sizes for 0D (vertex count), 1D (length), 2D (area) and 3D (volume) cells.
|
| Parameters
| ----------
| length : bool, default: True
| Specify whether or not to compute the length of 1D cells.
| This generates a ``'Length'`` cell data array.
|
| area : bool, default: True
| Specify whether or not to compute the area of 2D cells.
| This generates an ``'Area'`` cell data array.
|
| volume : bool, default: True
| Specify whether or not to compute the volume of 3D cells.
| This generates a ``'Volume'`` cell data array.
|
| progress_bar : bool, default: False
| Display a progress bar to indicate progress.
|
| vertex_count : bool, default: False
| Specify whether or not to compute sizes for vertex and polyvertex cells (0D cells).
| The computed value is the number of points in the cell.
| This generates a ``'VertexCount'`` cell data array.
|
| Returns
| -------
| output : DataSet | MultiBlock
| Dataset with `cell_data` containing the ``"VertexCount"``,
| ``"Length"``, ``"Area"``, and ``"Volume"`` arrays if set
| in the parameters. Return type matches input.
|
| Notes
| -----
| If cells do not have a dimension (for example, the length of
| hexahedral cells), the corresponding array will be all zeros.
|
| Examples
| --------
| Compute the face area of the example airplane mesh.
|
| >>> from pyvista import examples
| >>> surf = examples.load_airplane()
| >>> surf = surf.compute_cell_sizes(length=False, volume=False)
| >>> surf.plot(show_edges=True, scalars='Area')
|
| Create a mesh with cells of various dimensions.
|
| >>> mesh_0D = examples.cells.Vertex()
| >>> mesh_1D = examples.cells.Line()
| >>> mesh_2D = examples.cells.Quadrilateral()
| >>> mesh_3D = examples.cells.Hexahedron()
| >>> mesh = mesh_0D + mesh_1D + mesh_2D + mesh_3D
|
| Compute all arrays and compare them.
|
| >>> sizes = mesh.compute_cell_sizes(vertex_count=True)
| >>> sizes['VertexCount']
| pyvista_ndarray([1., 0., 0., 0.])
|
| >>> sizes['Length']
| pyvista_ndarray([0., 1., 0., 0.])
|
| >>> sizes['Area']
| pyvista_ndarray([0., 0., 1., 0.])
|
| >>> sizes['Volume']
| pyvista_ndarray([0., 0., 0., 1.])
|
| ctp(self: '_DataSetOrMultiBlockType', pass_cell_data: 'bool' = False, progress_bar: 'bool' = False, **kwargs)
| Transform cell data into point data.
|
| Point data are specified per node and cell data specified
| within cells. Optionally, the input point data can be passed
| through to the output.
|
| This method is an alias for :func:`cell_data_to_point_data`.
|
| Parameters
| ----------
| pass_cell_data : bool, default: False
| If enabled, pass the input cell data through to the output.
|
| progress_bar : bool, default: False
| Display a progress bar to indicate progress.
|
| **kwargs : dict, optional
| Deprecated keyword argument ``pass_cell_arrays``.
|
| Returns
| -------
| output : DataSet | MultiBlock
| Dataset with the cell data transformed into point data.
| Return type matches input.
|
| elevation(self: '_DataSetOrMultiBlockType', low_point: 'VectorLike[float] | None' = None, high_point: 'VectorLike[float] | None' = None, scalar_range: 'str | VectorLike[float] | None' = None, preference: "Literal['point', 'cell']" = 'point', set_active: 'bool' = True, progress_bar: 'bool' = False)
| Generate scalar values on a dataset.
|
| The scalar values lie within a user specified range, and are
| generated by computing a projection of each dataset point onto
| a line. The line can be oriented arbitrarily. A typical
| example is to generate scalars based on elevation or height
| above a plane.
|
| .. warning::
| This will create a scalars array named ``'Elevation'`` on the
| point data of the input dataset and overwrite the array
| named ``'Elevation'`` if present.
|
| Parameters
| ----------
| low_point : sequence[float], optional
| The low point of the projection line in 3D space. Default is bottom
| center of the dataset. Otherwise pass a length 3 sequence.
|
| high_point : sequence[float], optional
| The high point of the projection line in 3D space. Default is top
| center of the dataset. Otherwise pass a length 3 sequence.
|
| scalar_range : str | sequence[float], optional
| The scalar range to project to the low and high points on the line
| that will be mapped to the dataset. If None given, the values will
| be computed from the elevation (Z component) range between the
| high and low points. Min and max of a range can be given as a length
| 2 sequence. If ``str``, name of scalar array present in the
| dataset given, the valid range of that array will be used.
|
| preference : str, default: "point"
| When an array name is specified for ``scalar_range``, this is the
| preferred array type to search for in the dataset.
| Must be either ``'point'`` or ``'cell'``.
|
| set_active : bool, default: True
| A boolean flag on whether or not to set the new
| ``'Elevation'`` scalar as the active scalars array on the
| output dataset.
|
| progress_bar : bool, default: False
| Display a progress bar to indicate progress.
|
| Returns
| -------
| output : DataSet | MultiBlock
| Dataset containing elevation scalars in the
| ``"Elevation"`` array in ``point_data``.
|
| Examples
| --------
| Generate the "elevation" scalars for a sphere mesh. This is
| simply the height in Z from the XY plane.
|
| >>> import pyvista as pv
| >>> sphere = pv.Sphere()
| >>> sphere_elv = sphere.elevation()
| >>> sphere_elv.plot(smooth_shading=True)
|
| Access the first 4 elevation scalars. This is a point-wise
| array containing the "elevation" of each point.
|
| >>> sphere_elv['Elevation'][:4] # doctest:+SKIP
| array([-0.5 , 0.5 , -0.49706897, -0.48831028], dtype=float32)
|
| See :ref:`using_filters_example` for more examples using this filter.
|
| extract_all_edges(self: '_DataSetOrMultiBlockType', use_all_points: 'bool | None' = None, clear_data: 'bool' = False, progress_bar: 'bool' = False)
| Extract all the internal/external edges of the dataset as PolyData.
|
| This produces a full wireframe representation of the input dataset.
|
| Parameters
| ----------
| use_all_points : bool, optional
| .. deprecated:: 0.44.0
| Parameter ``use_all_points`` is deprecated since VTK < 9.2 is no
| longer supported. This parameter has no effect and is always ``True``.
|
| clear_data : bool, default: False
| Clear any point, cell, or field data. This is useful
| if wanting to strictly extract the edges.
|
| progress_bar : bool, default: False
| Display a progress bar to indicate progress.
|
| Returns
| -------
| pyvista.PolyData
| Edges extracted from the dataset.
|
| Examples
| --------
| Extract the edges of a sample unstructured grid and plot the edges.
| Note how it plots interior edges.
|
| >>> import pyvista as pv
| >>> from pyvista import examples
| >>> hex_beam = pv.read(examples.hexbeamfile)
| >>> edges = hex_beam.extract_all_edges()
| >>> edges.plot(line_width=5, color='k')
|
| See :ref:`cell_centers_example` for more examples using this filter.
|
| extract_surface(self: 'DataSet | MultiBlock', pass_pointid: 'bool' = True, pass_cellid: 'bool' = True, nonlinear_subdivision: 'int | None' = None, algorithm: '_ExtractSurfaceOptions | type[_SENTINEL]' = <class 'pyvista.core.filters.data_object._SENTINEL'>, progress_bar: 'bool' = False) -> 'PolyData'
| Extract surface geometry of the mesh as :class:`~pyvista.PolyData`.
|
| .. note::
| The underlying VTK algorithm can be selected for surface extraction.
| Using ``algorithm=None`` is recommended, and the appropriate algorithm
| will automatically be selected. The current default is ``'dataset_surface'``,
| but this will change to ``None`` in a future version.
|
| .. versionchanged:: 0.47
| This filter is now generalized to also work with :class:`~pyvista.MultiBlock`.
|
| Parameters
| ----------
| pass_pointid : bool, default: True
| Adds a point array ``"vtkOriginalPointIds"`` that identifies which original points
| these surface points correspond to.
|
| pass_cellid : bool, default: True
| Adds a cell array ``"vtkOriginalCellIds"`` that identifies which original cells these
| surface cells correspond to.
|
| nonlinear_subdivision : int, default: 1
| Determines how many times the faces of non-linear cells are subdivided into linear
| faces. This option is only relevant when the input is an
| :class:`~pyvista.UnstructuredGrid` with non-linear cells, and cannot be used with
| the ``'geometry'`` algorithm.
|
| If ``0``, the output is the equivalent to its linear counterpart (and the midpoints
| determining the non-linear interpolation are discarded). If ``1`` (the default), the
| non-linear face is triangulated based on the midpoints. If greater than ``1``, the
| triangulated pieces are recursively subdivided to reach the desired subdivision.
| Setting the value to greater than ``1`` may cause some point data to not be passed even
| if no nonlinear faces exist.
|
| algorithm : 'auto' | 'geometry' | 'dataset_surface'
| VTK algorithm to use internally.
|
| - ``'geometry'``: use :vtk:`vtkGeometryFilter`.
| - ``'dataset_surface'``: use :vtk:`vtkDataSetSurfaceFilter`.
| - ``None``: The algorithm is automatically selected based on the input. For most
| cases, the ``'geometry'`` algorithm is selected by default. The ``'dataset_surface'``
| algorithm is only selected for cases where the input is an
| :class:`~pyvista.UnstructuredGrid` with non-linear cells.
|
| Using ``algorithm=None`` is recommended. The current default is ``'dataset_surface'``,
| but this will change to ``None`` in a future version.
|
| Both algorithms produce similar surfaces, but ``'geometry'`` is more performant.
| The ``'geometry'`` algorithm also
|
| - merges points by default,
| - tends to preserve the original mesh's point order and connectivity, and
| - generates closed surfaces where closed surfaces would normally be expected.
|
| See :ref:`compare_surface_extract_algorithms` for some examples of differences.
|
| In general, users should not need to select the specific algorithm. This option is
| mostly provided for backwards-compatibility or specific use cases. For example, if
| working with both linear and non-linear meshes, it may be preferable to use
| ``'dataset_surface'`` explicitly so that the generated surfaces may be more directly
| comparable.
|
| .. versionadded:: 0.47
|
| progress_bar : bool, default: False
| Display a progress bar to indicate progress.
|
| Returns
| -------
| pyvista.PolyData
| Surface mesh of the grid.
|
| Warnings
| --------
| Both ``"vtkOriginalPointIds"`` and ``"vtkOriginalCellIds"`` may be
| affected by other VTK operations. See `issue 1164
| <https://github.com/pyvista/pyvista/issues/1164>`_ for
| recommendations on tracking indices across operations.
|
| Examples
| --------
| Extract the surface of an UnstructuredGrid.
|
| >>> import pyvista as pv
| >>> from pyvista import examples
| >>> grid = examples.load_hexbeam()
| >>> surf = grid.extract_surface(algorithm=None)
| >>> type(surf)
| <class 'pyvista.core.pointset.PolyData'>
| >>> surf['vtkOriginalPointIds']
| pyvista_ndarray([ 0, 1, 2, 3, 4, 5, 6, 7, 8, 9, 10, 11, 12, 13,
| 14, 15, 16, 17, 18, 19, 20, 21, 22, 23, 24, 25, 26, 27,
| 28, 29, 30, 31, 32, 33, 34, 35, 36, 37, 38, 39, 40, 41,
| 42, 43, 44, 45, 46, 47, 48, 49, 50, 51, 52, 53, 54, 55,
| 56, 57, 58, 59, 60, 61, 62, 63, 64, 65, 66, 67, 68, 69,
| 70, 71, 72, 73, 74, 75, 76, 77, 78, 79, 80, 81, 82, 83,
| 84, 85, 86, 87, 88, 89])
| >>> surf['vtkOriginalCellIds']
| pyvista_ndarray([ 0, 0, 0, 1, 1, 1, 3, 3, 3, 2, 2, 2, 36, 36,
| 36, 37, 37, 37, 39, 39, 39, 38, 38, 38, 5, 5, 9, 9,
| 13, 13, 17, 17, 21, 21, 25, 25, 29, 29, 33, 33, 4, 4,
| 8, 8, 12, 12, 16, 16, 20, 20, 24, 24, 28, 28, 32, 32,
| 7, 7, 11, 11, 15, 15, 19, 19, 23, 23, 27, 27, 31, 31,
| 35, 35, 6, 6, 10, 10, 14, 14, 18, 18, 22, 22, 26, 26,
| 30, 30, 34, 34])
|
| Note that in the "vtkOriginalCellIds" array, the same original cells
| appears multiple times since this array represents the original cell of
| each surface cell extracted.
|
| See the :ref:`extract_surface_example` and :ref:`surface_smoothing_example`
| for more examples using this filter.
|
| flip_normal(self: '_MeshType_co', normal: 'VectorLike[float]', point: 'VectorLike[float] | None' = None, transform_all_input_vectors: 'bool' = False, inplace: 'bool' = False) -> '_MeshType_co'
| Flip mesh about the normal.
|
| .. note::
| See also the notes at :func:`transform` which is used by this filter
| under the hood.
|
| Parameters
| ----------
| normal : VectorLike[float]
| Normal vector to flip about.
|
| point : VectorLike[float], optional
| Point to rotate about. Defaults to center of mesh at
| :attr:`~pyvista.DataSet.center`.
|
| transform_all_input_vectors : bool, default: False
| When ``True``, all input vectors are
| transformed. Otherwise, only the points, normals and
| active vectors are transformed.
|
| inplace : bool, default: False
| Updates mesh in-place.
|
| Returns
| -------
| output : DataSet | MultiBlock
| Dataset flipped about its normal. Return type matches input.
|
| See Also
| --------
| pyvista.Transform.reflect
| Concatenate a reflection matrix with a transformation.
|
| Examples
| --------
| >>> import pyvista as pv
| >>> from pyvista import examples
| >>> pl = pv.Plotter(shape=(1, 2))
| >>> pl.subplot(0, 0)
| >>> pl.show_axes()
| >>> mesh1 = examples.download_teapot()
| >>> _ = pl.add_mesh(mesh1)
| >>> pl.subplot(0, 1)
| >>> pl.show_axes()
| >>> mesh2 = mesh1.flip_normal([1.0, 1.0, 1.0], inplace=False)
| >>> _ = pl.add_mesh(mesh2)
| >>> pl.show(cpos='xy')
|
| flip_x(self: '_MeshType_co', point: 'VectorLike[float] | None' = None, transform_all_input_vectors: 'bool' = False, inplace: 'bool' = False) -> '_MeshType_co'
| Flip mesh about the x-axis.
|
| .. note::
| See also the notes at :func:`transform` which is used by this filter
| under the hood.
|
| Parameters
| ----------
| point : sequence[float], optional
| Point to rotate about. Defaults to center of mesh at
| :attr:`~pyvista.DataSet.center`.
|
| transform_all_input_vectors : bool, default: False
| When ``True``, all input vectors are
| transformed. Otherwise, only the points, normals and
| active vectors are transformed.
|
| inplace : bool, default: False
| Updates mesh in-place.
|
| Returns
| -------
| output : DataSet | MultiBlock
| Flipped dataset. Return type matches input.
|
| See Also
| --------
| pyvista.Transform.flip_x
| Concatenate a reflection about the x-axis with a transformation.
|
| Examples
| --------
| >>> import pyvista as pv
| >>> from pyvista import examples
| >>> pl = pv.Plotter(shape=(1, 2))
| >>> pl.subplot(0, 0)
| >>> pl.show_axes()
| >>> mesh1 = examples.download_teapot()
| >>> _ = pl.add_mesh(mesh1)
| >>> pl.subplot(0, 1)
| >>> pl.show_axes()
| >>> mesh2 = mesh1.flip_x(inplace=False)
| >>> _ = pl.add_mesh(mesh2)
| >>> pl.show(cpos='xy')
|
| flip_y(self: '_MeshType_co', point: 'VectorLike[float] | None' = None, transform_all_input_vectors: 'bool' = False, inplace: 'bool' = False) -> '_MeshType_co'
| Flip mesh about the y-axis.
|
| .. note::
| See also the notes at :func:`transform` which is used by this filter
| under the hood.
|
| Parameters
| ----------
| point : VectorLike[float], optional
| Point to rotate about. Defaults to center of mesh at
| :attr:`~pyvista.DataSet.center`.
|
| transform_all_input_vectors : bool, default: False
| When ``True``, all input vectors are
| transformed. Otherwise, only the points, normals and
| active vectors are transformed.
|
| inplace : bool, default: False
| Updates mesh in-place.
|
| Returns
| -------
| output : DataSet | MultiBlock
| Flipped dataset. Return type matches input.
|
| See Also
| --------
| pyvista.Transform.flip_y
| Concatenate a reflection about the y-axis with a transformation.
|
| Examples
| --------
| >>> import pyvista as pv
| >>> from pyvista import examples
| >>> pl = pv.Plotter(shape=(1, 2))
| >>> pl.subplot(0, 0)
| >>> pl.show_axes()
| >>> mesh1 = examples.download_teapot()
| >>> _ = pl.add_mesh(mesh1)
| >>> pl.subplot(0, 1)
| >>> pl.show_axes()
| >>> mesh2 = mesh1.flip_y(inplace=False)
| >>> _ = pl.add_mesh(mesh2)
| >>> pl.show(cpos='xy')
|
| flip_z(self: '_MeshType_co', point: 'VectorLike[float] | None' = None, transform_all_input_vectors: 'bool' = False, inplace: 'bool' = False) -> '_MeshType_co'
| Flip mesh about the z-axis.
|
| .. note::
| See also the notes at :func:`transform` which is used by this filter
| under the hood.
|
| Parameters
| ----------
| point : VectorLike[float], optional
| Point to rotate about. Defaults to center of mesh at
| :attr:`~pyvista.DataSet.center`.
|
| transform_all_input_vectors : bool, default: False
| When ``True``, all input vectors are
| transformed. Otherwise, only the points, normals and
| active vectors are transformed.
|
| inplace : bool, default: False
| Updates mesh in-place.
|
| Returns
| -------
| output : DataSet | MultiBlock
| Flipped dataset. Return type matches input.
|
| See Also
| --------
| pyvista.Transform.flip_z
| Concatenate a reflection about the z-axis with a transformation.
|
| Examples
| --------
| >>> import pyvista as pv
| >>> from pyvista import examples
| >>> pl = pv.Plotter(shape=(1, 2))
| >>> pl.subplot(0, 0)
| >>> pl.show_axes()
| >>> mesh1 = examples.download_teapot().rotate_x(90, inplace=False)
| >>> _ = pl.add_mesh(mesh1)
| >>> pl.subplot(0, 1)
| >>> pl.show_axes()
| >>> mesh2 = mesh1.flip_z(inplace=False)
| >>> _ = pl.add_mesh(mesh2)
| >>> pl.show(cpos='xz')
|
| point_data_to_cell_data(self: '_DataSetOrMultiBlockType', pass_point_data: 'bool' = False, categorical: 'bool' = False, progress_bar: 'bool' = False)
| Transform point data into cell data.
|
| Point data are specified per node and cell data specified within cells.
| Optionally, the input point data can be passed through to the output.
|
| Parameters
| ----------
| pass_point_data : bool, default: False
| If enabled, pass the input point data through to the output.
|
| categorical : bool, default: False
| Control whether the source point data is to be treated as
| categorical. If ``True``, histograming is used to assign the
| cell data. Specifically, a histogram is populated for each cell
| from the scalar values at each point, and the bin with the most
| elements is selected. In case of a tie, the smaller value is selected.
|
| .. note::
|
| If the point data is continuous, values that are almost equal (within
| ``1e-6``) are merged into a single bin. Otherwise, for discrete data
| the number of bins equals the number of unique values.
|
| progress_bar : bool, default: False
| Display a progress bar to indicate progress.
|
| Returns
| -------
| output : DataSet | MultiBlock
| Dataset with the point data transformed into cell data.
| Return type matches input.
|
| See Also
| --------
| cell_data_to_point_data
| Similar transformation applied to cell data.
| :meth:`~pyvista.ImageDataFilters.points_to_cells`
| Re-mesh :class:`~pyvista.ImageData` to a cells-based representation.
|
| Examples
| --------
| Color cells by their z coordinates. First, create point
| scalars based on z-coordinates of a sample sphere mesh. Then
| convert this point data to cell data. Use a low resolution
| sphere for emphasis of cell valued data.
|
| First, plot these values as point values to show the
| difference between point and cell data.
|
| >>> import pyvista as pv
| >>> sphere = pv.Sphere(theta_resolution=10, phi_resolution=10)
| >>> sphere['Z Coordinates'] = sphere.points[:, 2]
| >>> sphere.plot()
|
| Now, convert these values to cell data and then plot it.
|
| >>> import pyvista as pv
| >>> sphere = pv.Sphere(theta_resolution=10, phi_resolution=10)
| >>> sphere['Z Coordinates'] = sphere.points[:, 2]
| >>> sphere = sphere.point_data_to_cell_data()
| >>> sphere.plot()
|
| ptc(self: '_DataSetOrMultiBlockType', pass_point_data: 'bool' = False, progress_bar: 'bool' = False, **kwargs)
| Transform point data into cell data.
|
| Point data are specified per node and cell data specified
| within cells. Optionally, the input point data can be passed
| through to the output.
|
| This method is an alias for :func:`point_data_to_cell_data`.
|
| Parameters
| ----------
| pass_point_data : bool, default: False
| If enabled, pass the input point data through to the output.
|
| progress_bar : bool, default: False
| Display a progress bar to indicate progress.
|
| **kwargs : dict, optional
| Deprecated keyword argument ``pass_point_arrays``.
|
| Returns
| -------
| output : DataSet | MultiBlock
| Dataset with the point data transformed into cell data.
| Return type matches input.
|
| reflect(self: '_MeshType_co', normal: 'VectorLike[float]', point: 'VectorLike[float] | None' = None, inplace: 'bool' = False, transform_all_input_vectors: 'bool' = False, progress_bar: 'bool' = False) -> '_MeshType_co'
| Reflect a dataset across a plane.
|
| Parameters
| ----------
| normal : array_like[float]
| Normal direction for reflection.
|
| point : array_like[float]
| Point which, along with ``normal``, defines the reflection
| plane. If not specified, this is the origin.
|
| inplace : bool, default: False
| When ``True``, modifies the dataset inplace.
|
| transform_all_input_vectors : bool, default: False
| When ``True``, all input vectors are transformed. Otherwise,
| only the points, normals and active vectors are transformed.
|
| progress_bar : bool, default: False
| Display a progress bar to indicate progress.
|
| Returns
| -------
| output : DataSet | MultiBlock
| Reflected dataset. Return type matches input.
|
| See Also
| --------
| pyvista.Transform.reflect
| Concatenate a reflection matrix with a transformation.
|
| Examples
| --------
| >>> from pyvista import examples
| >>> mesh = examples.load_airplane()
| >>> mesh = mesh.reflect((0, 0, 1), point=(0, 0, -100))
| >>> mesh.plot(show_edges=True)
|
| See the :ref:`reflect_example` for more examples using this filter.
|
| resize(self: '_MeshType_co', *, bounds: 'VectorLike[float] | None' = None, bounds_size: 'float | VectorLike[float] | None' = None, length: 'float | None' = None, center: 'VectorLike[float] | None' = None, transform_all_input_vectors: 'bool' = False, inplace: 'bool' = False) -> '_MeshType_co'
| Resize the dataset's bounds.
|
| This filter rescales and translates the mesh to fit specified bounds. This is useful for
| normalizing datasets, changing units, or fitting datasets into specific coordinate ranges.
|
| It has three independent use cases:
|
| #. Use ``bounds`` to set the mesh's :attr:`~pyvista.DataSet.bounds` directly.
| #. Use ``bounds_size`` to set the mesh's ``bounds_size`` directly.
| #. Use ``length`` to set the mesh's diagonal ``length`` directly.
|
| By default, the ``bounds_size`` and ``length`` options resize the mesh so that its
| ``center`` is unchanged. Optionally, ``center`` may be set explicitly for these cases.
|
| .. versionadded:: 0.46
|
| See Also
| --------
| :meth:`scale`, :meth:`translate`
| Scale and/or translate a mesh. Used internally by :meth:`resize`.
|
| Parameters
| ----------
| bounds : VectorLike[float], optional
| Target :attr:`~pyvista.DataSet.bounds` for the resized dataset in the format
| ``[xmin, xmax, ymin, ymax, zmin, zmax]``. If provided, the dataset is scaled and
| translated to fit exactly within these bounds. Cannot be used together with
| ``bounds_size``, ``length``, or ``center``.
|
| bounds_size : float | VectorLike[float], optional
| Target size of the :attr:`~pyvista.DataSet.bounds` for the resized dataset. Use a
| single float to specify the size of all three axes, or a 3-element vector to set the
| size of each axis independently. Cannot be used together with ``bounds`` or ``length``.
|
| length : float, optional
| Target length of the :attr:`~pyvista.DataSet.bounds` for the resized dataset.
| Cannot be used together with ``bounds`` or ``bounds_size``.
|
| .. versionadded:: 0.47
|
| center : VectorLike[float], optional
| Center of the resized dataset in ``[x, y, z]``. By default, the mesh's
| :attr:`~pyvista.DataSet.center` is used. Only used when ``bounds_size`` or ``length``
| is specified.
|
| transform_all_input_vectors : bool, default: False
| When ``True``, all input vectors are transformed as part of the resize. Otherwise, only
| the points, normals and active vectors are transformed.
|
| inplace : bool, default: False
| If True, the dataset is modified in place. If False, a new dataset is returned.
|
| Returns
| -------
| output : DataSet | MultiBlock
| Resized dataset. Return type matches input.
|
| Examples
| --------
| Load a mesh with asymmetric bounds and show them.
|
| >>> import pyvista as pv
| >>> mesh = pv.Cube(
| ... x_length=1.0, y_length=2.0, z_length=3.0, center=(1.0, 2.0, 3.0)
| ... )
| >>> mesh.bounds
| BoundsTuple(x_min = 0.5,
| x_max = 1.5,
| y_min = 1.0,
| y_max = 3.0,
| z_min = 1.5,
| z_max = 4.5)
|
| Resize it to fit specific bounds.
|
| >>> resized = mesh.resize(bounds=[-1, 2, -3, 4, -5, 6])
| >>> resized.bounds
| BoundsTuple(x_min = -1.0,
| x_max = 2.0,
| y_min = -3.0,
| y_max = 4.0,
| z_min = -5.0,
| z_max = 6.0)
|
| Resize the mesh so its diagonal length is ``4.0``. The mesh's center is unchanged.
|
| >>> resized = mesh.resize(length=4.0)
| >>> resized.length
| 4.0
| >>> resized.center
| (1.0, 2.0, 3.0)
|
| Resize the mesh so its size is ``4.0``. The mesh's center is again unchanged.
|
| >>> resized = mesh.resize(bounds_size=4.0)
| >>> resized.bounds_size
| (4.0, 4.0, 4.0)
| >>> resized.center
| (1.0, 2.0, 3.0)
| >>> resized.bounds
| BoundsTuple(x_min = -1.0,
| x_max = 3.0,
| y_min = 0.0,
| y_max = 4.0,
| z_min = 1.0,
| z_max = 5.0)
|
| Specify a different size for each axis and set the desired center.
|
| >>> resized = mesh.resize(bounds_size=(2.0, 1.0, 0.5), center=(1.0, 0.5, 0.25))
| >>> resized.bounds_size
| (2.0, 1.0, 0.5)
| >>> resized.center
| (1.0, 0.5, 0.25)
|
| Center the mesh at the origin and normalize its bounds to ``1.0``.
|
| >>> resized = mesh.resize(bounds_size=1.0, center=(0.0, 0.0, 0.0))
| >>> resized.bounds
| BoundsTuple(x_min = -0.5,
| x_max = 0.5,
| y_min = -0.5,
| y_max = 0.5,
| z_min = -0.5,
| z_max = 0.5)
|
| rotate(self: '_MeshType_co', rotation: 'RotationLike', point: 'VectorLike[float] | None' = None, transform_all_input_vectors: 'bool' = False, inplace: 'bool' = False) -> '_MeshType_co'
| Rotate mesh about a point with a rotation matrix or ``Rotation`` object.
|
| .. note::
| See also the notes at :func:`transform` which is used by this filter
| under the hood.
|
| Parameters
| ----------
| rotation : RotationLike
| 3x3 rotation matrix or a SciPy ``Rotation`` object.
|
| point : VectorLike[float], optional
| Point to rotate about. Defaults to origin.
|
| transform_all_input_vectors : bool, default: False
| When ``True``, all input vectors are
| transformed. Otherwise, only the points, normals and
| active vectors are transformed.
|
| inplace : bool, default: False
| Updates mesh in-place.
|
| Returns
| -------
| output : DataSet | MultiBlock
| Rotated dataset. Return type matches input.
|
| See Also
| --------
| pyvista.Transform.rotate
| Concatenate a rotation matrix with a transformation.
|
| Examples
| --------
| Define a rotation. Here, a 3x3 matrix is used which rotates about the z-axis by
| 60 degrees.
|
| >>> import pyvista as pv
| >>> rotation = [
| ... [0.5, -0.8660254, 0.0],
| ... [0.8660254, 0.5, 0.0],
| ... [0.0, 0.0, 1.0],
| ... ]
|
| Use the rotation to rotate a cone about its tip.
|
| >>> mesh = pv.Cone()
| >>> tip = (0.5, 0.0, 0.0)
| >>> rot = mesh.rotate(rotation, point=tip)
|
| Plot the rotated mesh.
|
| >>> pl = pv.Plotter()
| >>> _ = pl.add_mesh(rot)
| >>> _ = pl.add_mesh(mesh, style='wireframe', line_width=3)
| >>> _ = pl.add_axes_at_origin()
| >>> pl.show()
|
| rotate_vector(self: '_MeshType_co', vector: 'VectorLike[float]', angle: 'float', point: 'VectorLike[float] | None' = None, transform_all_input_vectors: 'bool' = False, inplace: 'bool' = False) -> '_MeshType_co'
| Rotate mesh about a vector.
|
| .. note::
| See also the notes at :func:`transform` which is used by this filter
| under the hood.
|
| Parameters
| ----------
| vector : VectorLike[float]
| Vector to rotate about.
|
| angle : float
| Angle to rotate.
|
| point : VectorLike[float], optional
| Point to rotate about. Defaults to origin.
|
| transform_all_input_vectors : bool, default: False
| When ``True``, all input vectors are
| transformed. Otherwise, only the points, normals and
| active vectors are transformed.
|
| inplace : bool, default: False
| Updates mesh in-place.
|
| Returns
| -------
| output : DataSet | MultiBlock
| Rotated dataset. Return type matches input.
|
| See Also
| --------
| pyvista.Transform.rotate_vector
| Concatenate a rotation about a vector with a transformation.
|
| Examples
| --------
| Rotate a mesh 30 degrees about the ``(1, 1, 1)`` axis.
|
| >>> import pyvista as pv
| >>> mesh = pv.Cube()
| >>> rot = mesh.rotate_vector((1, 1, 1), 30, inplace=False)
|
| Plot the rotated mesh.
|
| >>> pl = pv.Plotter()
| >>> _ = pl.add_mesh(rot)
| >>> _ = pl.add_mesh(mesh, style='wireframe', line_width=3)
| >>> _ = pl.add_axes_at_origin()
| >>> pl.show()
|
| rotate_x(self: '_MeshType_co', angle: 'float', point: 'VectorLike[float] | None' = None, transform_all_input_vectors: 'bool' = False, inplace: 'bool' = False) -> '_MeshType_co'
| Rotate mesh about the x-axis.
|
| .. note::
| See also the notes at :func:`transform` which is used by this filter
| under the hood.
|
| Parameters
| ----------
| angle : float
| Angle in degrees to rotate about the x-axis.
|
| point : VectorLike[float], optional
| Point to rotate about. Defaults to origin.
|
| transform_all_input_vectors : bool, default: False
| When ``True``, all input vectors are
| transformed. Otherwise, only the points, normals and
| active vectors are transformed.
|
| inplace : bool, default: False
| Updates mesh in-place.
|
| Returns
| -------
| output : DataSet | MultiBlock
| Rotated dataset. Return type matches input.
|
| See Also
| --------
| pyvista.Transform.rotate_x
| Concatenate a rotation about the x-axis with a transformation.
|
| Examples
| --------
| Rotate a mesh 30 degrees about the x-axis.
|
| >>> import pyvista as pv
| >>> mesh = pv.Cube()
| >>> rot = mesh.rotate_x(30, inplace=False)
|
| Plot the rotated mesh.
|
| >>> pl = pv.Plotter()
| >>> _ = pl.add_mesh(rot)
| >>> _ = pl.add_mesh(mesh, style='wireframe', line_width=3)
| >>> _ = pl.add_axes_at_origin()
| >>> pl.show()
|
| rotate_y(self: '_MeshType_co', angle: 'float', point: 'VectorLike[float] | None' = None, transform_all_input_vectors: 'bool' = False, inplace: 'bool' = False) -> '_MeshType_co'
| Rotate mesh about the y-axis.
|
| .. note::
| See also the notes at :func:`transform` which is used by this filter
| under the hood.
|
| Parameters
| ----------
| angle : float
| Angle in degrees to rotate about the y-axis.
|
| point : VectorLike[float], optional
| Point to rotate about.
|
| transform_all_input_vectors : bool, default: False
| When ``True``, all input vectors are transformed. Otherwise, only
| the points, normals and active vectors are transformed.
|
| inplace : bool, default: False
| Updates mesh in-place.
|
| Returns
| -------
| output : DataSet | MultiBlock
| Rotated dataset. Return type matches input.
|
| See Also
| --------
| pyvista.Transform.rotate_y
| Concatenate a rotation about the y-axis with a transformation.
|
| Examples
| --------
| Rotate a cube 30 degrees about the y-axis.
|
| >>> import pyvista as pv
| >>> mesh = pv.Cube()
| >>> rot = mesh.rotate_y(30, inplace=False)
|
| Plot the rotated mesh.
|
| >>> pl = pv.Plotter()
| >>> _ = pl.add_mesh(rot)
| >>> _ = pl.add_mesh(mesh, style='wireframe', line_width=3)
| >>> _ = pl.add_axes_at_origin()
| >>> pl.show()
|
| rotate_z(self: '_MeshType_co', angle: 'float', point: 'VectorLike[float] | None' = None, transform_all_input_vectors: 'bool' = False, inplace: 'bool' = False) -> '_MeshType_co'
| Rotate mesh about the z-axis.
|
| .. note::
| See also the notes at :func:`transform` which is used by this filter
| under the hood.
|
| Parameters
| ----------
| angle : float
| Angle in degrees to rotate about the z-axis.
|
| point : VectorLike[float], optional
| Point to rotate about. Defaults to origin.
|
| transform_all_input_vectors : bool, default: False
| When ``True``, all input vectors are
| transformed. Otherwise, only the points, normals and
| active vectors are transformed.
|
| inplace : bool, default: False
| Updates mesh in-place.
|
| Returns
| -------
| output : DataSet | MultiBlock
| Rotated dataset. Return type matches input.
|
| See Also
| --------
| pyvista.Transform.rotate_z
| Concatenate a rotation about the z-axis with a transformation.
|
| Examples
| --------
| Rotate a mesh 30 degrees about the z-axis.
|
| >>> import pyvista as pv
| >>> mesh = pv.Cube()
| >>> rot = mesh.rotate_z(30, inplace=False)
|
| Plot the rotated mesh.
|
| >>> pl = pv.Plotter()
| >>> _ = pl.add_mesh(rot)
| >>> _ = pl.add_mesh(mesh, style='wireframe', line_width=3)
| >>> _ = pl.add_axes_at_origin()
| >>> pl.show()
|
| sample(self: '_DataSetOrMultiBlockType', target: 'DataSet | _vtk.vtkDataSet', tolerance: 'float | None' = None, pass_cell_data: 'bool' = True, pass_point_data: 'bool' = True, categorical: 'bool' = False, progress_bar: 'bool' = False, locator: "Literal['cell', 'cell_tree', 'obb_tree', 'static_cell'] | _vtk.vtkAbstractCellLocator | None" = 'static_cell', pass_field_data: 'bool' = True, mark_blank: 'bool' = True, snap_to_closest_point: 'bool' = False)
| Resample array data from a passed mesh onto this mesh.
|
| For `mesh1.sample(mesh2)`, the arrays from `mesh2` are sampled onto
| the points of `mesh1`. This function interpolates within an
| enclosing cell. This contrasts with
| :func:`pyvista.DataSetFilters.interpolate` that uses a distance
| weighting for nearby points. If there is cell topology, `sample` is
| usually preferred.
|
| The point data 'vtkValidPointMask' stores whether the point could be sampled
| with a value of 1 meaning successful sampling. And a value of 0 means
| unsuccessful.
|
| This uses :vtk:`vtkResampleWithDataSet`.
|
| Parameters
| ----------
| target : pyvista.DataSet
| The vtk data object to sample from - point and cell arrays from
| this object are sampled onto the nodes of the ``dataset`` mesh.
|
| tolerance : float, optional
| Tolerance used to compute whether a point in the source is
| in a cell of the input. If not given, tolerance is
| automatically generated.
|
| pass_cell_data : bool, default: True
| Preserve source mesh's original cell data arrays.
|
| pass_point_data : bool, default: True
| Preserve source mesh's original point data arrays.
|
| categorical : bool, default: False
| Control whether the source point data is to be treated as
| categorical. If the data is categorical, then the resultant data
| will be determined by a nearest neighbor interpolation scheme.
|
| progress_bar : bool, default: False
| Display a progress bar to indicate progress.
|
| locator : :vtk:`vtkAbstractCellLocator` or str or None, default: 'static_cell'
| Prototype cell locator to perform the ``FindCell()``
| operation. If ``None``, uses the DataSet ``FindCell`` method.
| Valid strings with mapping to vtk cell locators are
|
| * 'cell' - :vtk:`vtkCellLocator`
| * 'cell_tree' - :vtk:`vtkCellTreeLocator`
| * 'obb_tree' - :vtk:`vtkOBBTree`
| * 'static_cell' - :vtk:`vtkStaticCellLocator`
|
| pass_field_data : bool, default: True
| Preserve source mesh's original field data arrays.
|
| mark_blank : bool, default: True
| Whether to mark blank points and cells in "vtkGhostType".
|
| snap_to_closest_point : bool, default: False
| Whether to snap to cell with closest point if no cell is found. Useful
| when sampling from data with vertex cells. Requires vtk >=9.3.0.
|
| .. versionadded:: 0.43
|
| Returns
| -------
| output : DataSet | MultiBlock
| Dataset containing resampled data.
|
| See Also
| --------
| pyvista.DataSetFilters.interpolate
| Interpolate values from one mesh onto another.
|
| pyvista.ImageDataFilters.resample
| Resample image data to modify its dimensions and spacing.
|
| Examples
| --------
| Resample data from another dataset onto a sphere.
|
| >>> import pyvista as pv
| >>> from pyvista import examples
| >>> mesh = pv.Sphere(center=(4.5, 4.5, 4.5), radius=4.5)
| >>> data_to_probe = examples.load_uniform()
| >>> result = mesh.sample(data_to_probe)
| >>> result.plot(scalars='Spatial Point Data')
|
| If sampling from a set of points represented by a ``(n, 3)``
| shaped ``numpy.ndarray``, they need to be converted to a
| PyVista DataSet, e.g. :class:`pyvista.PolyData`, first.
|
| >>> import numpy as np
| >>> points = np.array([[1.5, 5.0, 6.2], [6.7, 4.2, 8.0]])
| >>> mesh = pv.PolyData(points)
| >>> result = mesh.sample(data_to_probe)
| >>> result['Spatial Point Data']
| pyvista_ndarray([ 46.5 , 225.12])
|
| See :ref:`resampling_example` and :ref:`interpolate_sample_example`
| for more examples using this filter.
|
| scale(self: '_MeshType_co', xyz: 'float | VectorLike[float]', transform_all_input_vectors: 'bool' = False, inplace: 'bool' = False, point: 'VectorLike[float] | None' = None) -> '_MeshType_co'
| Scale the mesh.
|
| .. note::
| See also the notes at :func:`transform` which is used by this filter
| under the hood.
|
| Parameters
| ----------
| xyz : float | VectorLike[float]
| A vector sequence defining the scale factors along x, y, and z. If
| a scalar, the same uniform scale is used along all three axes.
|
| transform_all_input_vectors : bool, default: False
| When ``True``, all input vectors are transformed. Otherwise, only
| the points, normals and active vectors are transformed.
|
| inplace : bool, default: False
| Updates mesh in-place.
|
| point : VectorLike[float], optional
| Point to scale from. Defaults to origin.
|
| Returns
| -------
| output : DataSet | MultiBlock
| Scaled dataset. Return type matches input.
|
| See Also
| --------
| pyvista.Transform.scale
| Concatenate a scale matrix with a transformation.
|
| pyvista.DataObjectFilters.resize
| Resize a mesh.
|
| Examples
| --------
| >>> import pyvista as pv
| >>> from pyvista import examples
| >>> mesh1 = examples.download_teapot()
| >>> mesh2 = mesh1.scale([10.0, 10.0, 10.0], inplace=False)
|
| Plot meshes side-by-side
|
| >>> pl = pv.Plotter(shape=(1, 2))
| >>> # Create plot with unscaled mesh
| >>> pl.subplot(0, 0)
| >>> _ = pl.add_mesh(mesh1)
| >>> pl.show_axes()
| >>> _ = pl.show_grid()
| >>> # Create plot with scaled mesh
| >>> pl.subplot(0, 1)
| >>> _ = pl.add_mesh(mesh2)
| >>> pl.show_axes()
| >>> _ = pl.show_grid()
| >>> pl.show(cpos='xy')
|
| slice(self: '_DataSetOrMultiBlockType', normal: 'VectorLike[float] | _NormalsLiteral | None' = None, origin: 'VectorLike[float] | None' = None, generate_triangles: 'bool' = False, contour: 'bool' = False, progress_bar: 'bool' = False, plane: 'PolyData | None' = None)
| Slice a dataset by a plane at the specified origin and normal vector orientation.
|
| The origin and normal may be set explicitly or implicitly using a
| :func:`~pyvista.Plane`.
|
| If no parameters are given, the slice will occur in the center
| of the dataset along the x-axis.
|
| Parameters
| ----------
| normal : VectorLike[float] | str, optional
| Length-3 vector for the normal vector direction. Can also
| be specified as a string conventional direction such as
| ``'x'`` for ``(1, 0, 0)`` or ``'-x'`` for ``(-1, 0, 0)``, etc.
| The ``'x'`` direction is used by default.
|
| origin : sequence[float], optional
| The center ``(x, y, z)`` coordinate of the plane on which
| the slice occurs. The default is the center of the dataset.
|
| generate_triangles : bool, default: False
| If this is enabled (``False`` by default), the output will
| be triangles. Otherwise the output will be the intersection
| polygons.
|
| .. note::
|
| PyVista's default is ``False``, which differs from
| :vtk:`vtkCutter`'s default of ``True``. The polygon
| codepath in :vtk:`vtkCutter` is significantly slower than
| the triangulation path: on a 1.3M-cell UnstructuredGrid
| the polygon path measures ~89 ms/op vs ~20 ms/op with
| ``generate_triangles=True`` (~5x slowdown). Pass
| ``generate_triangles=True`` for the fast path when the
| output cell shape is not load-bearing for your downstream
| code.
|
| contour : bool, default: False
| If ``True``, apply a ``contour`` filter after slicing.
|
| progress_bar : bool, default: False
| Display a progress bar to indicate progress.
|
| plane : PolyData, optional
| :func:`~pyvista.Plane` mesh to use for slicing. Use this as an
| alternative to setting ``origin`` and ``normal``. The mean of the
| plane's normal vectors is used for the ``normal`` parameter and
| the mean of the plane's points is used for the ``origin`` parameter.
|
| .. versionadded:: 0.47
|
| Returns
| -------
| pyvista.PolyData
| Sliced dataset.
|
| See Also
| --------
| slice_implicit
| slice_orthogonal
| slice_along_axis
| slice_along_line
| clip_slab
| :meth:`~pyvista.ImageDataFilters.slice_index`
|
| Examples
| --------
| Slice the surface of a sphere.
|
| >>> import pyvista as pv
| >>> sphere = pv.Sphere()
| >>> slice_x = sphere.slice(normal='x')
| >>> slice_y = sphere.slice(normal='y')
| >>> slice_z = sphere.slice(normal='z')
| >>> slices = slice_x + slice_y + slice_z
| >>> slices.plot(line_width=5)
|
| See :ref:`slice_example` for more examples using this filter.
|
| slice_along_axis(self: '_DataSetOrMultiBlockType', n: 'int' = 5, axis: "Literal['x', 'y', 'z', 0, 1, 2]" = 'x', tolerance: 'float | None' = None, generate_triangles: 'bool' = False, contour: 'bool' = False, bounds=None, center=None, progress_bar: 'bool' = False)
| Create many slices of the input dataset along a specified axis.
|
| Parameters
| ----------
| n : int, default: 5
| The number of slices to create.
|
| axis : str | int, default: 'x'
| The axis to generate the slices along. Perpendicular to the
| slices. Can be string name (``'x'``, ``'y'``, or ``'z'``) or
| axis index (``0``, ``1``, or ``2``).
|
| tolerance : float, optional
| The tolerance to the edge of the dataset bounds to create
| the slices. The ``n`` slices are placed equidistantly with
| an absolute padding of ``tolerance`` inside each side of the
| ``bounds`` along the specified axis. Defaults to 1% of the
| ``bounds`` along the specified axis.
|
| generate_triangles : bool, default: False
| When ``True``, the output will be triangles. Otherwise the output
| will be the intersection polygons.
|
| .. note::
|
| PyVista's default differs from :vtk:`vtkCutter` (which
| defaults to ``True``). The polygon path is ~5x slower on
| UnstructuredGrids. Pass ``generate_triangles=True`` for
| the fast path. See :meth:`slice_implicit` for details.
|
| contour : bool, default: False
| If ``True``, apply a ``contour`` filter after slicing.
|
| bounds : sequence[float], optional
| A 6-length sequence overriding the bounds of the mesh.
| The bounds along the specified axis define the extent
| where slices are taken.
|
| center : sequence[float], optional
| A 3-length sequence specifying the position of the line
| along which slices are taken. Defaults to the center of
| the mesh.
|
| progress_bar : bool, default: False
| Display a progress bar to indicate progress.
|
| Returns
| -------
| pyvista.PolyData
| Sliced dataset.
|
| See Also
| --------
| slice
| slice_implicit
| slice_orthogonal
| slice_along_line
| :meth:`~pyvista.ImageDataFilters.slice_index`
|
| Examples
| --------
| Slice the random hills dataset in the X direction.
|
| >>> from pyvista import examples
| >>> hills = examples.load_random_hills()
| >>> slices = hills.slice_along_axis(n=10)
| >>> slices.plot(line_width=5)
|
| Slice the random hills dataset in the Z direction.
|
| >>> from pyvista import examples
| >>> hills = examples.load_random_hills()
| >>> slices = hills.slice_along_axis(n=10, axis='z')
| >>> slices.plot(line_width=5)
|
| See :ref:`slice_example` for more examples using this filter.
|
| slice_along_line(self: '_DataSetOrMultiBlockType', line: 'pv.PolyData', generate_triangles: 'bool' = False, contour: 'bool' = False, progress_bar: 'bool' = False)
| Slice a dataset using a polyline/spline as the path.
|
| This also works for lines generated with :func:`pyvista.Line`.
|
| Parameters
| ----------
| line : pyvista.PolyData
| A PolyData object containing one single PolyLine cell.
|
| generate_triangles : bool, default: False
| When ``True``, the output will be triangles. Otherwise the output
| will be the intersection polygons.
|
| .. note::
|
| PyVista's default differs from :vtk:`vtkCutter` (which
| defaults to ``True``). The polygon path is ~5x slower on
| UnstructuredGrids. Pass ``generate_triangles=True`` for
| the fast path. See :meth:`slice_implicit` for details.
|
| contour : bool, default: False
| If ``True``, apply a ``contour`` filter after slicing.
|
| progress_bar : bool, default: False
| Display a progress bar to indicate progress.
|
| Returns
| -------
| pyvista.PolyData
| Sliced dataset.
|
| See Also
| --------
| slice
| slice_implicit
| slice_orthogonal
| slice_along_axis
| :meth:`~pyvista.ImageDataFilters.slice_index`
|
| Examples
| --------
| Slice the random hills dataset along a circular arc.
|
| >>> import numpy as np
| >>> import pyvista as pv
| >>> from pyvista import examples
| >>> hills = examples.load_random_hills()
| >>> center = np.array(hills.center)
| >>> point_a = center + np.array([5, 0, 0])
| >>> point_b = center + np.array([-5, 0, 0])
| >>> arc = pv.CircularArc(
| ... pointa=point_a, pointb=point_b, center=center, resolution=100
| ... )
| >>> line_slice = hills.slice_along_line(arc)
|
| Plot the circular arc and the hills mesh.
|
| >>> pl = pv.Plotter()
| >>> _ = pl.add_mesh(hills, smooth_shading=True, style='wireframe')
| >>> _ = pl.add_mesh(
| ... line_slice,
| ... line_width=10,
| ... render_lines_as_tubes=True,
| ... color='k',
| ... )
| >>> _ = pl.add_mesh(arc, line_width=10, color='grey')
| >>> pl.show()
|
| See :ref:`slice_example` for more examples using this filter.
|
| slice_implicit(self: '_DataSetOrMultiBlockType', implicit_function: '_vtk.vtkImplicitFunction', generate_triangles: 'bool' = False, contour: 'bool' = False, progress_bar: 'bool' = False)
| Slice a dataset by a VTK implicit function.
|
| Parameters
| ----------
| implicit_function : :vtk:`vtkImplicitFunction`
| Specify the implicit function to perform the cutting.
|
| generate_triangles : bool, default: False
| If ``True``, the output will be triangles. Otherwise the
| output will be the intersection polygons. If the cutting
| function is not a plane, the output will be 3D polygons,
| which might be nice to look at but hard to compute with
| downstream.
|
| .. note::
|
| PyVista's default is ``False``, which differs from
| :vtk:`vtkCutter`'s default of ``True``. The polygon
| codepath in :vtk:`vtkCutter` is significantly slower than
| the triangulation path: on a 1.3M-cell UnstructuredGrid
| the polygon path measures ~89 ms/op vs ~20 ms/op with
| ``generate_triangles=True`` (~5x slowdown). Pass
| ``generate_triangles=True`` for the fast path when the
| output cell shape is not load-bearing for your downstream
| code.
|
| contour : bool, default: False
| If ``True``, apply a ``contour`` filter after slicing.
|
| progress_bar : bool, default: False
| Display a progress bar to indicate progress.
|
| Returns
| -------
| pyvista.PolyData
| Sliced dataset.
|
| See Also
| --------
| slice
| slice_orthogonal
| slice_along_axis
| slice_along_line
| :meth:`~pyvista.ImageDataFilters.slice_index`
|
| Examples
| --------
| Slice the surface of a sphere.
|
| >>> import pyvista as pv
| >>> import vtk
| >>> sphere = vtk.vtkSphere()
| >>> sphere.SetRadius(10)
| >>> mesh = pv.Wavelet()
| >>> slice = mesh.slice_implicit(sphere)
| >>> slice.plot(show_edges=True, line_width=5)
|
| >>> cylinder = vtk.vtkCylinder()
| >>> cylinder.SetRadius(10)
| >>> mesh = pv.Wavelet()
| >>> slice = mesh.slice_implicit(cylinder)
| >>> slice.plot(show_edges=True, line_width=5)
|
| slice_orthogonal(self: '_DataSetOrMultiBlockType', x: 'float | None' = None, y: 'float | None' = None, z: 'float | None' = None, generate_triangles: 'bool' = False, contour: 'bool' = False, progress_bar: 'bool' = False)
| Create three orthogonal slices through the dataset on the three cartesian planes.
|
| Yields a MutliBlock dataset of the three slices.
|
| Parameters
| ----------
| x : float, optional
| The X location of the YZ slice.
|
| y : float, optional
| The Y location of the XZ slice.
|
| z : float, optional
| The Z location of the XY slice.
|
| generate_triangles : bool, default: False
| When ``True``, the output will be triangles. Otherwise the output
| will be the intersection polygons.
|
| .. note::
|
| PyVista's default differs from :vtk:`vtkCutter` (which
| defaults to ``True``). The polygon path is ~5x slower on
| UnstructuredGrids. Pass ``generate_triangles=True`` for
| the fast path. See :meth:`slice_implicit` for details.
|
| contour : bool, default: False
| If ``True``, apply a ``contour`` filter after slicing.
|
| progress_bar : bool, default: False
| Display a progress bar to indicate progress.
|
| Returns
| -------
| pyvista.PolyData
| Sliced dataset.
|
| See Also
| --------
| slice
| slice_implicit
| slice_along_axis
| slice_along_line
| :meth:`~pyvista.ImageDataFilters.slice_index`
|
| Examples
| --------
| Slice the random hills dataset with three orthogonal planes.
|
| >>> from pyvista import examples
| >>> hills = examples.load_random_hills()
| >>> slices = hills.slice_orthogonal(contour=False)
| >>> slices.plot(line_width=5)
|
| See :ref:`slice_example` for more examples using this filter.
|
| transform(self: '_MeshType_co', trans: 'TransformLike', transform_all_input_vectors: 'bool' = False, inplace: 'bool | None' = None, progress_bar: 'bool' = False) -> '_MeshType_co'
| Transform this mesh with a 4x4 transform.
|
| .. warning::
| When using ``transform_all_input_vectors=True``, there is
| no distinction in VTK between vectors and arrays with
| three components. This may be an issue if you have scalar
| data with three components (e.g. RGB data). This will be
| improperly transformed as if it was vector data rather
| than scalar data. One possible (albeit ugly) workaround
| is to store the three components as separate scalar
| arrays.
|
| .. warning::
| In general, transformations give non-integer results. This
| method converts integer-typed vector data to float before
| performing the transformation. This applies to the points
| array, as well as any vector-valued data that is affected
| by the transformation. To prevent subtle bugs arising from
| in-place transformations truncating the result to integers,
| this conversion always applies to the input mesh.
|
| .. warning::
| Shear transformations are not supported for :class:`~pyvista.ImageData` or
| :class:`~pyvista.RectilinearGrid`, and rotations are not supported for
| :class:`~pyvista.RectilinearGrid`. If present, a ``ValueError`` is raised.
| To fully support these transformations, the input should be cast to
| :class:`~pyvista.StructuredGrid` `before` applying this filter.
|
| .. note::
| Transforming :class:`~pyvista.ImageData` modifies its
| :class:`~pyvista.ImageData.origin`,
| :class:`~pyvista.ImageData.spacing`, and
| :class:`~pyvista.ImageData.direction_matrix` properties.
|
| .. versionchanged:: 0.48.0
| The parameter ``inplace`` must be specified whereas it previously
| defaulted to ``True``.
|
| .. versionchanged:: 0.45.0
| Transforming :class:`~pyvista.ImageData` now returns ``ImageData``.
| Previously, :class:`~pyvista.StructuredGrid` was returned.
|
| .. versionchanged:: 0.46.0
| Transforming :class:`~pyvista.RectilinearGrid` now returns ``RectilinearGrid``.
| Previously, :class:`~pyvista.StructuredGrid` was returned.
|
| .. versionchanged:: 0.47.0
| An error is now raised instead of a warning if a transformation cannot be
| applied.
|
| Parameters
| ----------
| trans : TransformLike
| Accepts a vtk transformation object or a 4x4
| transformation matrix.
|
| transform_all_input_vectors : bool, default: False
| When ``True``, all arrays with three components are
| transformed. Otherwise, only the normals and vectors are
| transformed. See the warning for more details.
|
| inplace : bool
| When ``True``, modifies the dataset inplace and returned dataset is
| the same dataset. When ``False`` a new transformed dataset is
| returned with the original unchanged. The value of this parameter
| must be explicitly set.
|
| progress_bar : bool, default: False
| Display a progress bar to indicate progress.
|
| Returns
| -------
| output : DataSet | MultiBlock
| Transformed dataset. Return type matches input.
|
| See Also
| --------
| pyvista.Transform
| Describe linear transformations via a 4x4 matrix.
| pyvista.Prop3D.transform
| Transform an actor.
|
| Examples
| --------
| Translate a mesh by ``(50, 100, 200)``.
|
| >>> import numpy as np
| >>> from pyvista import examples
| >>> mesh = examples.load_airplane()
|
| Here a 4x4 :class:`numpy.ndarray` is used, but any :class:`~pyvista.TransformLike`
| is accepted.
|
| >>> transform_matrix = np.array(
| ... [
| ... [1, 0, 0, 50],
| ... [0, 1, 0, 100],
| ... [0, 0, 1, 200],
| ... [0, 0, 0, 1],
| ... ]
| ... )
| >>> transformed = mesh.transform(transform_matrix, inplace=False)
| >>> transformed.plot(show_edges=True)
|
| translate(self: '_MeshType_co', xyz: 'VectorLike[float]', transform_all_input_vectors: 'bool' = False, inplace: 'bool' = False) -> '_MeshType_co'
| Translate the mesh.
|
| .. note::
| See also the notes at :func:`transform` which is used by this filter
| under the hood.
|
| Parameters
| ----------
| xyz : VectorLike[float]
| A vector of three floats.
|
| transform_all_input_vectors : bool, default: False
| When ``True``, all input vectors are
| transformed. Otherwise, only the points, normals and
| active vectors are transformed.
|
| inplace : bool, default: False
| Updates mesh in-place.
|
| Returns
| -------
| output : DataSet | MultiBlock
| Translated dataset. Return type matches input.
|
| See Also
| --------
| pyvista.Transform.translate
| Concatenate a translation matrix with a transformation.
|
| Examples
| --------
| Create a sphere and translate it by ``(2, 1, 2)``.
|
| >>> import pyvista as pv
| >>> mesh = pv.Sphere()
| >>> mesh.center
| (0.0, 0.0, 0.0)
| >>> trans = mesh.translate((2, 1, 2), inplace=False)
| >>> trans.center
| (2.0, 1.0, 2.0)
|
| triangulate(self: '_DataSetOrMultiBlockType', inplace: 'bool' = False, progress_bar: 'bool' = False)
| Return an all triangle mesh.
|
| More complex polygons will be broken down into triangles.
|
| Parameters
| ----------
| inplace : bool, default: False
| Updates mesh in-place.
|
| progress_bar : bool, default: False
| Display a progress bar to indicate progress.
|
| Returns
| -------
| pyvista.PolyData
| Mesh containing only triangles.
|
| Examples
| --------
| Generate a mesh with quadrilateral faces.
|
| >>> import pyvista as pv
| >>> plane = pv.Plane()
| >>> plane.point_data.clear()
| >>> plane.plot(show_edges=True, line_width=5)
|
| Convert it to an all triangle mesh.
|
| >>> mesh = plane.triangulate()
| >>> mesh.plot(show_edges=True, line_width=5)
|
| validate_mesh(self: '_DataSetOrMultiBlockType', validation_fields: 'MeshValidationFields | Sequence[MeshValidationFields] | None' = None, action: '_ActionOptions | None' = None, *, exclude_fields: 'MeshValidationFields | Sequence[MeshValidationFields] | None' = None, report_body: '_ReportBodyOptions' = 'message', **cell_validator_kwargs) -> '_MeshValidationReport[_DataSetOrMultiBlockType]'
| Validate this mesh's array data, points, and cells.
|
| This method returns a ``MeshValidationReport`` dataclass with information about the
| validity of a mesh. The dataclass contains validation fields which are specific to the
| mesh's data, points, and cells. By default, all validation fields below are checked and
| included in the report. Optionally, only a subset of fields may be requested, and a
| warning or error may be raised if the mesh is not valid.
|
| **Data validation fields**
|
| Fields specific to :attr:`~pyvista.DataSet.cell_data` and
| :attr:`~pyvista.DataSet.point_data` arrays.
|
| - ``cell_data_wrong_length``: Ensure the length of each cell data array matches
| :attr:`~pyvista.DataSet.n_cells`.
| - ``point_data_wrong_length``: Ensure the length of each point data array matches
| :attr:`~pyvista.DataSet.n_points`.
|
| .. note::
| When setting new arrays using PyVista's API, similar array validation checks are
| `already` implicitly performed. As such, these checks may be redundant in many cases.
| They are most useful for validating `newly` loaded or :func:`wrapped <pyvista.wrap>`
| meshes.
|
| **Point validation fields**
|
| - ``non_finite_points``: Ensure all points have real values (i.e. no ``NaN`` or ``Inf``).
| - ``unused_points``: Ensure all points are referenced by at least one cell.
|
| **Cell validation fields**
|
| - ``coincident_points``: Ensure there are no duplicate coordinates or repeated use of the
| same connectivity entry.
| - ``degenerate_faces``: Ensure faces do not collapse to a line or a point through repeated
| collocated vertices.
| - ``intersecting_edges``: Ensure two edges of a 2D cell do not intersect.
| - ``intersecting_faces``: Ensure two faces of a 3D cell do not intersect.
| - ``invalid_point_references``: Ensure all points referenced by cells are valid point ids
| that can be indexed by :class:`~pyvista.DataSet.points`.
| - ``inverted_faces``: Ensure the faces of a cell point in the direction required by its
| :class:`~pyvista.CellType`.
| - ``negative_size``: Ensure 1D, 2D, and 3D cells have positive length, area, and volume,
| respectively.
| - ``non_contiguous_edges``: Ensure edges around the perimeter of a 2D cell are contiguous.
| - ``non_convex``: Ensure all 2D and 3D cells are convex.
| - ``non_planar_faces``: Ensure vertices for a face all lie in the same plane.
| - ``wrong_number_of_points``: Ensure each cell has the minimum number of points needed to
| describe it.
| - ``zero_size``: Ensure 1D, 2D, and 3D cells have non-zero length, area, and volume,
| respectively.
|
| .. note::
| All cell fields are computed using :meth:`~pyvista.DataObjectFilters.cell_validator`,
| and the field names correspond to :class:`~pyvista.CellStatus` names.
|
| For each field, its value is:
|
| - ``None`` if the field is omitted from the report,
| - an empty list ``[]`` if the field is included but there is no issue to report for it, or
| - a list of invalid items (e.g. invalid array names or cell/point ids).
|
| In addition to the validation fields above, the report includes properties for
| convenience:
|
| - ``is_valid``: evaluates to ``True`` when all fields are ``None`` or empty.
| - ``invalid_fields``: tuple of validation field names where problems were detected.
| - ``mesh``: a shallow copy of the validated mesh. If any cell fields are included which
| are computed by :meth:`~pyvista.DataObjectFilters.cell_validator`, this mesh includes the
| output from that filter.
| - ``message``: message string generated by the report. The message contains a compact
| summary of any problems detected, and is formatted for printing to console. This is the
| message used when the ``action`` keyword is set for emitting warnings or raising errors.
| This value is ``None`` if the mesh is valid.
|
| Validating composite :class:`~pyvista.MultiBlock` is also supported. In this case, all
| mesh blocks are validated separately and the results are aggregated and reported per-block.
|
| .. versionadded:: 0.47
|
| .. versionchanged:: 0.48
|
| - Include cell fields ``zero_size`` and ``negative_size``.
| - Report fields are now sorted in alphabetical order. Point fields are also reported
| before cell fields.
| - The body of the report now shows the error message instead of validation fields,
| i.e. the default value of ``report_body`` is now ``'message'`` instead of
| ``'fields'``.
|
| Parameters
| ----------
| validation_fields : MeshValidationFields | sequence[MeshValidationFields], optional
| Select which field(s) to include in the validation report. All data, point, and cell
| fields are included by default. Specify individual fields by name, or use group name(s)
| to include multiple related validation fields:
|
| - ``'data'`` to include all data fields
| - ``'points'`` to include all point fields
| - ``'cells'`` to include all cell fields
| - ``'memory_safe'`` to include all fields that, if invalid, may cause a segmentation
| fault and crash Python. This option includes ``cell_data_wrong_length``,
| ``point_data_wrong_length``, and ``invalid_point_references``.
|
| Fields that are excluded from the report will have a value of ``None``.
|
| action : 'warn' | 'error', optional
| Issue a warning or raise an error if the mesh is not valid for the specified fields.
| By default, no action is taken.
|
| exclude_fields : MeshValidationFields | sequence[MeshValidationFields], optional
| Select which field(s) to exclude from the validation report. This is similar to
| using ``validation_fields``, but is subtractive instead of additive. All data, point,
| and cell fields are `included` by default, and no fields are excluded.
|
| .. versionadded:: 0.48
|
| report_body : 'fields' | 'message', optional
| Contents to show in the body of the report.
|
| - ``'fields'``: Show all validated fields. A list of any/all invalid ids are shown.
| - ``'message'``: Show the error message as the body of the report (if any).
|
| Using ``'fields'`` as the body is more explicit in terms of showing `which` fields
| have been validated. Using ``'message'`` is typically visually more compact though,
| and the message includes additional cell type-specific information.
|
| .. versionadded:: 0.48
|
| cell_validator_kwargs
| Keyword arguments passed to :meth:`~pyvista.DataObjectFilters.cell_validator`.
|
| .. versionadded:: 0.48
|
| Returns
| -------
| MeshValidationReport
| Report dataclass with information about mesh validity.
|
| See Also
| --------
| :meth:`~pyvista.DataObjectFilters.cell_validator`
| :meth:`~pyvista.DataObjectFilters.cell_quality`
| :meth:`~pyvista.UnstructuredGridFilters.remove_unused_points`
| :ref:`mesh_validation_example`
|
| Examples
| --------
| Create a :func:`~pyvista.Sphere` and check if it's a valid mesh.
|
| >>> import pyvista as pv
| >>> from pyvista import examples
| >>> mesh = pv.Sphere()
| >>> report = mesh.validate_mesh()
| >>> report.is_valid
| True
|
| Print the report. By default, the report is relatively minimal, and only includes
| an error message if the mesh is invalid.
|
| >>> print(report)
| Mesh Validation Report
| ----------------------
| Mesh info:
| Type : PolyData
| N Points : 842
| N Cells : 1680
| Cell types : {TRIANGLE}
| Report summary:
| Is valid : True
| Invalid fields : ()
|
| Use ``report_body`` to explicitly show the validated fields.
|
| >>> report = mesh.validate_mesh(report_body='fields')
| >>> print(report)
| Mesh Validation Report
| ----------------------
| Mesh info:
| Type : PolyData
| N Points : 842
| N Cells : 1680
| Cell types : {TRIANGLE}
| Report summary:
| Is valid : True
| Invalid fields : ()
| Invalid data arrays:
| Cell data wrong length : []
| Point data wrong length : []
| Invalid point ids:
| Non-finite points : []
| Unused points : []
| Invalid cell ids:
| Coincident points : []
| Degenerate faces : []
| Intersecting edges : []
| Intersecting faces : []
| Invalid point references : []
| Inverted faces : []
| Negative size : []
| Non-contiguous edges : []
| Non-convex : []
| Non-planar faces : []
| Wrong number of points : []
| Zero size : []
|
| Load a mesh with invalid cells, e.g. :func:`~pyvista.examples.downloads.download_cow`
| and validate it. Use ``'cells'`` to only validate the cells specifically.
|
| >>> mesh = examples.download_cow()
| >>> report = mesh.validate_mesh('cells', report_body='fields')
|
| Alternatively, use ``exclude_fields`` to `remove` fields from the report instead.
| For example, excluding ``data`` and ``points`` is the same as including ``cells``.
|
| >>> report_excluded = mesh.validate_mesh(exclude_fields=['data', 'points'])
| >>> report_excluded == report
| True
|
| Show the report. Note that only cell validation fields are reported (array and point
| fields are omitted).
|
| >>> print(report)
| Mesh Validation Report
| ----------------------
| Mesh info:
| Type : PolyData
| N Points : 2903
| N Cells : 3263
| Cell types : {TRIANGLE, POLYGON, QUAD}
| Report summary:
| Is valid : False
| Invalid fields (1) : ('non_convex',)
| Invalid cell ids:
| Coincident points : []
| Degenerate faces : []
| Intersecting edges : []
| Intersecting faces : []
| Invalid point references : []
| Inverted faces : []
| Negative size : []
| Non-contiguous edges : []
| Non-convex (3) : [1013, 1532, 3250]
| Non-planar faces : []
| Wrong number of points : []
| Zero size : []
|
| >>> report.is_valid
| False
|
| Show what the issue(s) are.
|
| >>> report.invalid_fields
| ('non_convex',)
|
| Show the cell ids of the non-convex cells.
|
| >>> report.non_convex
| [1013, 1532, 3250]
|
| Access the same underlying mesh array of non-convex cell ids that was internally computed
| by :meth:`~pyvista.DataObjectFilters.cell_validator`.
|
| >>> report.mesh.field_data['non_convex']
| pyvista_ndarray([1013, 1532, 3250])
|
| Print the message generated by the report. This is the message used when the
| ``action`` keyword is set for emitting warnings or raising errors.
|
| >>> print(report.message)
| PolyData mesh is not valid:
| - Mesh has 3 non-convex QUAD cells. Invalid cell ids: [1013, 1532, 3250]
|
| Show a validation report for cells with intersecting edges and unused points only.
|
| >>> report = mesh.validate_mesh(
| ... ['intersecting_edges', 'unused_points'], report_body='fields'
| ... )
| >>> print(report)
| Mesh Validation Report
| ----------------------
| Mesh info:
| Type : PolyData
| N Points : 2903
| N Cells : 3263
| Cell types : {TRIANGLE, POLYGON, QUAD}
| Report summary:
| Is valid : True
| Invalid fields : ()
| Invalid point ids:
| Unused points : []
| Invalid cell ids:
| Intersecting edges : []
|
| Even though other fields are invalid (i.e. ``non_convex``), for `these` specific
| validation fields the mesh is considered valid.
|
| >>> report.is_valid
| True
|
| Do minimal validation to ensure the mesh properties are "memory_safe". This helps to avoid
| a segmentation fault which may be caused by invalid memory accesses by VTK. In this case,
| we use ``action`` to raise an error if the mesh is not valid.
|
| >>> _ = mesh.validate_mesh('memory_safe', action='error')
|
| Validate the mesh as a :class:`~pyvista.MultiBlock` instead.
|
| >>> multi = mesh.cast_to_multiblock()
| >>> report = multi.validate_mesh()
| >>> print(report)
| Mesh Validation Report
| ----------------------
| Mesh info:
| Type : MultiBlock
| N Blocks : 1
| Report summary:
| Is valid : False
| Invalid fields (1) : ('non_convex',)
| Error message:
| MultiBlock mesh is not valid:
| * Block id 0 'Block-00' PolyData mesh is not valid:
| - Mesh has 3 non-convex QUAD cells. Invalid cell ids: [1013, 1532, 3250]
|
| Validate again but show the fields in report body.
| Instead of reporting problems with specific arrays, point ids, or cell ids, the errors
| are reported by block id. Here, block id ``0`` is reported as having non-convex cells.
|
| >>> report = multi.validate_mesh(report_body='fields')
| >>> print(report)
| Mesh Validation Report
| ----------------------
| Mesh info:
| Type : MultiBlock
| N Blocks : 1
| Report summary:
| Is valid : False
| Invalid fields (1) : ('non_convex',)
| Blocks with invalid data arrays:
| Cell data wrong length : []
| Point data wrong length : []
| Blocks with invalid points:
| Non-finite points : []
| Unused points : []
| Blocks with invalid cells:
| Coincident points : []
| Degenerate faces : []
| Intersecting edges : []
| Intersecting faces : []
| Invalid point references : []
| Inverted faces : []
| Negative size : []
| Non-contiguous edges : []
| Non-convex (1) : [0]
| Non-planar faces : []
| Wrong number of points : []
| Zero size : []
|
| Subreports for each block can be accessed with indexing.
|
| >>> len(report)
| 1
| >>> subreport = report[0]
| >>> subreport.non_convex
| [1013, 1532, 3250]
|
| ----------------------------------------------------------------------
| Methods inherited from pyvista.core.dataobject.DataObject:
|
| __dir__(self: 'Self') -> 'list[str]'
| Include pending accessor names so tab completion surfaces them.
|
| Plugin-contributed accessors registered via the ``pyvista.accessors``
| entry-point group are imported lazily on first attribute access.
| Listing their names alongside the normal attribute set lets IPython
| / Jupyter / REPL tab completion surface them without paying the
| plugin import cost ahead of time.
|
| __eq__(self: 'Self', other: 'object') -> 'bool'
| Test equivalency between data objects.
|
| __getstate__(self: 'Self') -> 'tuple[FunctionType, tuple[dict[str, Any]]] | dict[str, Any]'
| Support pickle.
|
| __setstate__(self: 'Self', state: 'Any') -> 'None'
| Support unpickle.
|
| add_field_data(self: 'Self', array: 'NumpyArray[float]', name: 'str', deep: 'bool' = True) -> 'None'
| Add field data.
|
| Use field data when size of the data you wish to associate
| with the dataset does not match the number of points or cells
| of the dataset.
|
| Parameters
| ----------
| array : sequence
| Array of data to add to the dataset as a field array.
|
| name : str
| Name to assign the field array.
|
| deep : bool, default: True
| Perform a deep copy of the data when adding it to the
| dataset.
|
| Examples
| --------
| Add field data to a PolyData dataset.
|
| >>> import pyvista as pv
| >>> import numpy as np
| >>> mesh = pv.Sphere()
| >>> mesh.add_field_data(np.arange(10), 'my-field-data')
| >>> mesh['my-field-data']
| pyvista_ndarray([0, 1, 2, 3, 4, 5, 6, 7, 8, 9])
|
| Add field data to a ImageData dataset.
|
| >>> mesh = pv.ImageData(dimensions=(2, 2, 1))
| >>> mesh.add_field_data(['I could', 'write', 'notes', 'here'], 'my-field-data')
| >>> mesh['my-field-data']
| pyvista_ndarray(['I could', 'write', 'notes', 'here'], dtype='<U7')
|
| Add field data to a MultiBlock dataset.
|
| >>> blocks = pv.MultiBlock()
| >>> blocks.append(pv.Sphere())
| >>> blocks['cube'] = pv.Cube(center=(0, 0, -1))
| >>> blocks.add_field_data([1, 2, 3], 'my-field-data')
| >>> blocks.field_data['my-field-data']
| pyvista_ndarray([1, 2, 3])
|
| cast_to_multiblock(self) -> 'MultiBlock'
| Convert this :class:`DataObject` to a :class:`~pyvista.MultiBlock`.
|
| Uses :vtk:`vtkConvertToMultiBlockDataSet` internally.
|
| .. versionadded:: 0.47
|
| Returns
| -------
| MultiBlock
| Converted dataset.
|
| clear_field_data(self: 'Self') -> 'None'
| Remove all field data.
|
| Examples
| --------
| Add field data to a PolyData dataset and then remove it.
|
| >>> import pyvista as pv
| >>> mesh = pv.Sphere()
| >>> mesh.field_data['my-field-data'] = range(10)
| >>> len(mesh.field_data)
| 1
| >>> mesh.clear_field_data()
| >>> len(mesh.field_data)
| 0
|
| copy(self: 'Self', deep: 'bool' = True) -> 'Self'
| Return a copy of the object.
|
| Parameters
| ----------
| deep : bool, default: True
| When ``True`` makes a full copy of the object. When
| ``False``, performs a shallow copy where the points, cell,
| and data arrays are references to the original object.
|
| Returns
| -------
| pyvista.DataSet
| Deep or shallow copy of the input. Type is identical to
| the input.
|
| Examples
| --------
| Create and make a deep copy of a PolyData object.
|
| >>> import pyvista as pv
| >>> mesh_a = pv.Sphere()
| >>> mesh_b = mesh_a.copy()
| >>> mesh_a == mesh_b
| True
|
| copy_attributes(self: 'Self', dataset: 'Self') -> 'None'
| Copy the data attributes of the input dataset object.
|
| Parameters
| ----------
| dataset : pyvista.DataSet
| Dataset to copy the data attributes from.
|
| Examples
| --------
| >>> import pyvista as pv
| >>> source = pv.ImageData(dimensions=(10, 10, 5))
| >>> source = source.compute_cell_sizes()
| >>> target = pv.ImageData(dimensions=(10, 10, 5))
| >>> target.copy_attributes(source)
| >>> target.plot(scalars='Volume', show_edges=True)
|
| copy_structure(self: 'Self', dataset: 'Self') -> 'None'
| Copy the structure (geometry and topology) of the input dataset object.
|
| Parameters
| ----------
| dataset : :vtk:`vtkDataSet`
| Dataset to copy the geometry and topology from.
|
| Examples
| --------
| >>> import pyvista as pv
| >>> source = pv.ImageData(dimensions=(10, 10, 5))
| >>> target = pv.ImageData()
| >>> target.copy_structure(source)
| >>> target.plot(show_edges=True)
|
| deep_copy(self: 'Self', to_copy: 'Self | _vtk.vtkDataObject') -> 'None'
| Overwrite this data object with another data object as a deep copy.
|
| Parameters
| ----------
| to_copy : DataObject | :vtk:`vtkDataObject`
| Data object to perform a deep copy from.
|
| head(self: 'Self', display: 'bool' = True, html: 'bool | None' = None) -> 'str'
| Return the header stats of this dataset.
|
| If in IPython, this will be formatted to HTML. Otherwise
| returns a console friendly string.
|
| Parameters
| ----------
| display : bool, default: True
| Display this header in iPython.
|
| html : bool, optional
| Generate the output as HTML.
|
| Returns
| -------
| str
| Header statistics.
|
| save(self: 'Self', filename: 'Path | str', binary: 'bool' = True, texture: 'NumpyArray[np.uint8] | str | None' = None, compression: '_CompressionOptions' = 'zlib', **writer_kwargs: 'Any') -> 'None'
| Save this vtk object to file.
|
| .. include:: /api/utilities/mesh_io.rst
|
| .. versionadded:: 0.45
|
| Support saving pickled meshes
|
| See Also
| --------
| pyvista.read
|
| Parameters
| ----------
| filename : str, pathlib.Path
| Filename of output file. Writer type is inferred from
| the extension of the filename.
|
| binary : bool, default: True
| If ``True``, write as binary. Otherwise, write as ASCII.
|
| texture : str, np.ndarray, optional
| Write a single texture array to file when using a PLY
| file. Texture array must be a 3 or 4 component array with
| the datatype ``np.uint8``. Array may be a cell array or a
| point array, and may also be a string if the array already
| exists in the PolyData.
|
| If a string is provided, the texture array will be saved
| to disk as that name. If an array is provided, the
| texture array will be saved as ``'RGBA'``
|
| .. note::
| This feature is only available when saving PLY files.
|
| compression : str or None, default: 'zlib'
| The compression type to use when ``binary`` is ``True``
| and VTK writer is of type :vtk:`vtkXMLWriter`. This
| argument has no effect otherwise. Acceptable values are
| ``'zlib'``, ``'lz4'``, ``'lzma'``, and ``None``. ``None``
| indicates no compression.
|
| .. versionadded:: 0.47
|
| **writer_kwargs : dict, optional
| Additional keyword arguments forwarded verbatim to a custom
| writer registered via :func:`pyvista.register_writer`. Use
| these to expose format-specific options such as compression
| level or thread count. When the target extension dispatches
| to a built-in VTK writer or to the pickle path, passing any
| extra keyword arguments raises :class:`TypeError` — PyVista
| never silently drops writer options.
|
| .. versionadded:: 0.48
|
| Raises
| ------
| TypeError
| If ``**writer_kwargs`` are provided but the target extension
| does not dispatch to a registered custom writer.
| ValueError
| If ``file_ext`` is not a supported extension.
|
| Notes
| -----
| Binary files write much faster than ASCII and have a smaller
| file size.
|
| shallow_copy(self: 'Self', to_copy: 'Self | _vtk.vtkDataObject') -> 'None'
| Shallow copy the given mesh to this mesh.
|
| Parameters
| ----------
| to_copy : DataObject | :vtk:`vtkDataObject`
| Data object to perform a shallow copy from.
|
| ----------------------------------------------------------------------
| Readonly properties inherited from pyvista.core.dataobject.DataObject:
|
| actual_memory_size
| Return the actual size of the dataset object.
|
| Returns
| -------
| int
| The actual size of the dataset object in kibibytes (1024
| bytes).
|
| Examples
| --------
| >>> from pyvista import examples
| >>> mesh = examples.load_airplane()
| >>> mesh.actual_memory_size # doctest:+SKIP
| 93
|
| field_data
| Return FieldData as DataSetAttributes.
|
| Use field data when size of the data you wish to associate
| with the dataset does not match the number of points or cells
| of the dataset.
|
| Returns
| -------
| DataSetAttributes
| FieldData as DataSetAttributes.
|
| Examples
| --------
| Add field data to a PolyData dataset and then return it.
|
| >>> import pyvista as pv
| >>> import numpy as np
| >>> mesh = pv.Sphere()
| >>> mesh.field_data['my-field-data'] = np.arange(10)
| >>> mesh.field_data['my-field-data']
| pyvista_ndarray([0, 1, 2, 3, 4, 5, 6, 7, 8, 9])
|
| memory_address
| Get address of the underlying VTK C++ object.
|
| Returns
| -------
| str
| Memory address formatted as ``'Addr=%p'``.
|
| Examples
| --------
| >>> import pyvista as pv
| >>> mesh = pv.Sphere()
| >>> mesh.memory_address
| 'Addr=...'
|
| ----------------------------------------------------------------------
| Data descriptors inherited from pyvista.core.dataobject.DataObject:
|
| user_dict
| Set or return a user-specified data dictionary.
|
| The dictionary is stored as a JSON-serialized string as part of the mesh's
| field data. Unlike regular field data, which requires values to be stored
| as an array, the user dict provides a mapping for scalar values.
|
| Since the user dict is stored as field data, it is automatically saved
| with the mesh when it is saved in a compatible file format (e.g. ``'.vtk'``).
| Any saved metadata is automatically de-serialized by PyVista whenever
| the user dict is accessed again. Since the data is stored as JSON, it
| may also be easily retrieved or read by other programs.
|
| Any JSON-serializable values are permitted by the user dict, i.e. values
| can have type ``dict``, ``list``, ``tuple``, ``str``, ``int``, ``float``,
| ``bool``, or ``None``. Storing NumPy arrays is not directly supported, but
| these may be cast beforehand to a supported type, e.g. by calling ``tolist()``
| on the array.
|
| To completely remove the user dict string from the dataset's field data,
| set its value to ``None``.
|
| .. note::
|
| The user dict is a convenience property intended for metadata storage.
| Values are JSON-serialized on every mutation, so it is not a substitute
| for a regular field data array when storing bulk array data with many
| entries (use a regular field data array for that instead).
|
| .. warning::
|
| Field data is typically passed-through by dataset filters, and therefore
| the user dict's items can generally be expected to persist and remain
| unchanged in the output of filtering methods. However, this behavior is
| not guaranteed, as it's possible that some filters may modify or clear
| field data. Use with caution.
|
| .. versionadded:: 0.44
|
| Returns
| -------
| UserDict
| JSON-serialized dict-like object which is subclassed from
| :py:class:`collections.UserDict`.
|
| Examples
| --------
| Load a mesh.
|
| >>> import pyvista as pv
| >>> from pyvista import examples
| >>> mesh = examples.load_ant()
|
| Add data to the user dict. The contents are serialized as JSON.
|
| >>> mesh.user_dict['name'] = 'ant'
| >>> mesh.user_dict
| {"name": "ant"}
|
| Alternatively, set the user dict from an existing dict.
|
| >>> mesh.user_dict = dict(name='ant')
|
| The user dict can be updated like a regular dict.
|
| >>> mesh.user_dict.update(
| ... {
| ... 'num_legs': 6,
| ... 'body_parts': ['head', 'thorax', 'abdomen'],
| ... }
| ... )
| >>> mesh.user_dict
| {"name": "ant", "num_legs": 6, "body_parts": ["head", "thorax", "abdomen"]}
|
| Data in the user dict is stored as field data.
|
| >>> mesh.field_data
| pyvista DataSetAttributes
| Association : NONE
| Contains arrays :
| _PYVISTA_USER_DICT str "{"name": "ant",..."
|
| Since it's field data, the user dict can be saved to file along with the
| mesh and retrieved later.
|
| >>> mesh.save('ant.vtk')
| >>> mesh_from_file = pv.read('ant.vtk')
| >>> mesh_from_file.user_dict
| {"name": "ant", "num_legs": 6, "body_parts": ["head", "thorax", "abdomen"]}
|
| ----------------------------------------------------------------------
| Data and other attributes inherited from pyvista.core.dataobject.DataObject:
|
| __hash__ = None
|
| ----------------------------------------------------------------------
| Methods inherited from pyvista.core.utilities.misc._NoNewAttrMixin:
|
| __setattr__(self, key: 'str', value: 'Any') -> 'None'
| Prevent adding new attributes to classes using "normal" methods.
|
| ----------------------------------------------------------------------
| Methods inherited from pyvista.core._vtk_utilities.DisableVtkSnakeCase:
|
| __getattribute__(self, item)
| Return getattr(self, name).
|
| ----------------------------------------------------------------------
| Static methods inherited from pyvista.core._vtk_utilities.DisableVtkSnakeCase:
|
| check_attribute(target, attr)
|
| ----------------------------------------------------------------------
| Class methods inherited from pyvista.core._vtk_utilities.vtkPyVistaOverride:
|
| __init_subclass__(**kwargs)
| This method is called when a class is subclassed.
|
| The default implementation does nothing. It may be
| overridden to extend subclasses.
|
| ----------------------------------------------------------------------
| Methods inherited from vtkmodules.vtkCommonDataModel.vtkImageData:
|
| AllocateScalars(...)
| AllocateScalars(self, dataType:int, numComponents:int) -> None
| C++: virtual void AllocateScalars(int dataType, int numComponents)
| AllocateScalars(self, pipeline_info:vtkInformation) -> None
| C++: virtual void AllocateScalars(vtkInformation *pipeline_info)
|
| Allocate the point scalars for this dataset. The data type
| determines the type of the array (VTK_FLOAT, VTK_INT etc.) where
| as numComponents determines its number of components.
|
| ApplyIndexToPhysicalMatrix(...)
| ApplyIndexToPhysicalMatrix(self, source:vtkMatrix4x4) -> None
| C++: void ApplyIndexToPhysicalMatrix(vtkMatrix4x4 *source)
|
| Set the transformation matrix from the index space to the
| physical space coordinate system of the dataset. The transform is
| a 4 by 4 matrix. The supplied matrix pointer is not stored in the
| the image object but the matrix values are used for updating the
| Origin, Spacing, and DirectionMatrix.
| \sa SetOrigin
| \sa SetSpacing
| \sa SetDirectionMatrix
|
| ApplyPhysicalToIndexMatrix(...)
| ApplyPhysicalToIndexMatrix(self, source:vtkMatrix4x4) -> None
| C++: void ApplyPhysicalToIndexMatrix(vtkMatrix4x4 *source)
|
| Get the transformation matrix from the physical space to the
| index space coordinate system of the dataset. The transform is a
| 4 by 4 matrix. The supplied matrix pointer is not stored in the
| the image object but the matrix values are used for updating the
| Origin, Spacing, and DirectionMatrix.
| \sa SetOrigin
| \sa SetSpacing
| \sa SetDirectionMatrix
|
| ComputeBounds(...)
| ComputeBounds(self) -> None
| C++: void ComputeBounds() override;
|
| Compute the data bounding box from data points. THIS METHOD IS
| NOT THREAD SAFE.
|
| ComputeCellId(...)
| ComputeCellId(self, ijk:[int, int, int]) -> int
| C++: vtkIdType ComputeCellId(int ijk[3]) override;
|
| Given a location in structured coordinates (i-j-k), return the
| cell id. Rely on vtkStructuredData::ComputeCellIdForExtent
|
| ComputeIndexToPhysicalMatrix(...)
| ComputeIndexToPhysicalMatrix(origin:(float, float, float),
| spacing:(float, float, float), direction:(float, float, float,
| float, float, float, float, float, float), result:[float,
| float, float, float, float, float, float, float, float, float,
| float, float, float, float, float, float]) -> None
| C++: static void ComputeIndexToPhysicalMatrix(
| double const origin[3], double const spacing[3],
| double const direction[9], double result[16])
|
| Static method to compute the IndexToPhysicalMatrix.
|
| ComputeInternalExtent(...)
| ComputeInternalExtent(self, intExt:[int, ...], tgtExt:[int, ...],
| bnds:[int, ...]) -> None
| C++: void ComputeInternalExtent(int *intExt, int *tgtExt,
| int *bnds)
|
| Given how many pixel are required on a side for boundary
| conditions (in bnds), the target extent to traverse, compute the
| internal extent (the extent for this ImageData that does not
| suffer from any boundary conditions) and place it in intExt
|
| ComputePhysicalToIndexMatrix(...)
| ComputePhysicalToIndexMatrix(origin:(float, float, float),
| spacing:(float, float, float), direction:(float, float, float,
| float, float, float, float, float, float), result:[float,
| float, float, float, float, float, float, float, float, float,
| float, float, float, float, float, float]) -> None
| C++: static void ComputePhysicalToIndexMatrix(
| double const origin[3], double const spacing[3],
| double const direction[9], double result[16])
|
| Static method to compute the PhysicalToIndexMatrix.
|
| ComputePointId(...)
| ComputePointId(self, ijk:[int, int, int]) -> int
| C++: vtkIdType ComputePointId(int ijk[3]) override;
|
| Given a location in structured coordinates (i-j-k), return the
| point id. Rely on vtkStructuredData::ComputePointIdForExtent
|
| ComputeStructuredCoordinates(...)
| ComputeStructuredCoordinates(self, x:(float, float, float),
| ijk:[int, int, int], pcoords:[float, float, float]) -> int
| C++: int ComputeStructuredCoordinates(const double x[3],
| int ijk[3], double pcoords[3]) override;
| ComputeStructuredCoordinates(self, x:(float, float, float),
| ijk:[int, int, int], pcoords:[float, float, float],
| tol2:float) -> int
| C++: virtual int ComputeStructuredCoordinates(const double x[3],
| int ijk[3], double pcoords[3], double tol2)
|
| Computes the structured coordinates for a point x[3]. The voxel
| is specified by the array ijk[3], and the parametric coordinates
| in the cell are specified with pcoords[3]. The function returns a
| 0 if the point x is outside of the volume, and a 1 if inside the
| volume, using squared tolerance tol2 (1e-12 if not provided).
|
| CopyAndCastFrom(...)
| CopyAndCastFrom(self, inData:vtkImageData, extent:[int, int, int,
| int, int, int]) -> None
| C++: virtual void CopyAndCastFrom(vtkImageData *inData,
| int extent[6])
| CopyAndCastFrom(self, inData:vtkImageData, x0:int, x1:int, y0:int,
| y1:int, z0:int, z1:int) -> None
| C++: virtual void CopyAndCastFrom(vtkImageData *inData, int x0,
| int x1, int y0, int y1, int z0, int z1)
|
| This method is passed a input and output region, and executes the
| filter algorithm to fill the output from the input. It just
| executes a switch statement to call the correct function for the
| regions data types.
|
| CopyInformationFromPipeline(...)
| CopyInformationFromPipeline(self, information:vtkInformation)
| -> None
| C++: void CopyInformationFromPipeline(vtkInformation *information)
| override;
|
| Override these to handle origin, spacing, scalar type, and scalar
| number of components. See vtkDataObject for details.
|
| CopyInformationToPipeline(...)
| CopyInformationToPipeline(self, information:vtkInformation)
| -> None
| C++: void CopyInformationToPipeline(vtkInformation *information)
| override;
|
| Copy information from this data object to the pipeline
| information. This is used by the vtkTrivialProducer that is
| created when someone calls SetInputData() to connect the image to
| a pipeline.
|
| CopyStructure(...)
| CopyStructure(self, ds:vtkDataSet) -> None
| C++: void CopyStructure(vtkDataSet *ds) override;
|
| Copy the geometric and topological structure of an input image
| data object.
|
| Crop(...)
| Crop(self, updateExtent:(int, ...)) -> None
| C++: void Crop(const int *updateExtent) override;
|
| Reallocates and copies to set the Extent to updateExtent. This is
| used internally when the exact extent is requested, and the
| source generated more than the update extent.
|
| DeepCopy(...)
| DeepCopy(self, src:vtkDataObject) -> None
| C++: void DeepCopy(vtkDataObject *src) override;
|
| The goal of the method is to copy the complete data from src into
| this object. The implementation is delegated to the differenent
| subclasses. If you want to copy the data up to the array pointers
| only, @see ShallowCopy.
|
| This method deep copy the field data and copy the internal
| structure.
|
| ExtendedNew(...)
| ExtendedNew() -> vtkImageData
| C++: static vtkImageData *ExtendedNew()
|
| FindCell(...)
| FindCell(self, x:[float, float, float], cell:vtkCell, cellId:int,
| tol2:float, subId:int, pcoords:[float, float, float],
| weights:[float, ...]) -> int
| C++: vtkIdType FindCell(double x[3], vtkCell *cell,
| vtkIdType cellId, double tol2, int &subId, double pcoords[3],
| double *weights) override;
| FindCell(self, x:[float, float, float], cell:vtkCell,
| gencell:vtkGenericCell, cellId:int, tol2:float, subId:int,
| pcoords:[float, float, float], weights:[float, ...]) -> int
| C++: vtkIdType FindCell(double x[3], vtkCell *cell,
| vtkGenericCell *gencell, vtkIdType cellId, double tol2,
| int &subId, double pcoords[3], double *weights) override;
|
| Locate cell based on global coordinate x and tolerance squared.
| If cell and cellId is non-nullptr, then search starts from this
| cell and looks at immediate neighbors. Returns cellId >= 0 if
| inside, < 0 otherwise. The parametric coordinates are provided
| in pcoords[3]. The interpolation weights are returned in
| weights[]. (The number of weights is equal to the number of
| points in the found cell). Tolerance is used to control how close
| the point is to be considered "in" the cell. THIS METHOD IS NOT
| THREAD SAFE.
|
| FindPoint(...)
| FindPoint(self, x:[float, float, float]) -> int
| C++: vtkIdType FindPoint(double x[3]) override;
| FindPoint(self, x:float, y:float, z:float) -> int
| C++: vtkIdType FindPoint(double x, double y, double z)
|
| GetActualMemorySize(...)
| GetActualMemorySize(self) -> int
| C++: unsigned long GetActualMemorySize() override;
|
| Return the actual size of the data in kibibytes (1024 bytes).
| This number is valid only after the pipeline has updated. The
| memory size returned is guaranteed to be greater than or equal to
| the memory required to represent the data (e.g., extra space in
| arrays, etc. are not included in the return value). THIS METHOD
| IS THREAD SAFE.
|
| GetArrayIncrements(...)
| GetArrayIncrements(self, array:vtkDataArray, increments:[int, int,
| int]) -> None
| C++: void GetArrayIncrements(vtkDataArray *array,
| vtkIdType increments[3])
|
| Since various arrays have different number of components, the
| will have different increments.
|
| GetArrayPointer(...)
| GetArrayPointer(self, array:vtkDataArray, coordinates:[int, int,
| int]) -> Pointer
| C++: void *GetArrayPointer(vtkDataArray *array,
| int coordinates[3])
| GetArrayPointer(self, array:vtkDataArray, x:int, y:int, z:int)
| -> Pointer
| C++: void *GetArrayPointer(vtkDataArray *array, int x, int y,
| int z)
|
| GetArrayPointerForExtent(...)
| GetArrayPointerForExtent(self, array:vtkDataArray, extent:[int,
| int, int, int, int, int]) -> Pointer
| C++: void *GetArrayPointerForExtent(vtkDataArray *array,
| int extent[6])
|
| These are convenience methods for getting a pointer from any
| filed array. It is a start at expanding image filters to process
| any array (not just scalars).
|
| GetAxisUpdateExtent(...)
| GetAxisUpdateExtent(self, axis:int, min:int, max:int,
| updateExtent:(int, ...)) -> None
| C++: virtual void GetAxisUpdateExtent(int axis, int &min,
| int &max, const int *updateExtent)
|
| GetCell(...)
| GetCell(self, cellId:int, cell:vtkGenericCell) -> None
| C++: void GetCell(vtkIdType cellId, vtkGenericCell *cell)
| override;
| GetCell(self, cellId:int) -> vtkCell
| C++: vtkCell *GetCell(vtkIdType cellId) override;
| GetCell(self, i:int, j:int, k:int) -> vtkCell
| C++: vtkCell *GetCell(int i, int j, int k) override;
|
| Standard vtkDataSet API methods. See vtkDataSet for more
| information.
|
| GetCellBounds(...)
| GetCellBounds(self, cellId:int, bounds:[float, float, float,
| float, float, float]) -> None
| C++: void GetCellBounds(vtkIdType cellId, double bounds[6])
| override;
|
| Get the bounds of the cell with cellId such that: 0 <= cellId <
| NumberOfCells. A subclass may be able to determine the bounds of
| cell without using an expensive GetCell() method. A default
| implementation is provided that actually uses a GetCell() call.
| This is to ensure the method is available to all datasets.
| Subclasses should override this method to provide an efficient
| implementation. THIS METHOD IS THREAD SAFE IF FIRST CALLED FROM A
| SINGLE THREAD AND THE DATASET IS NOT MODIFIED
|
| GetContinuousIncrements(...)
| GetContinuousIncrements(self, extent:[int, int, int, int, int,
| int], incX:int, incY:int, incZ:int) -> None
| C++: virtual void GetContinuousIncrements(int extent[6],
| vtkIdType &incX, vtkIdType &incY, vtkIdType &incZ)
| GetContinuousIncrements(self, scalars:vtkDataArray, extent:[int,
| int, int, int, int, int], incX:int, incY:int, incZ:int)
| -> None
| C++: virtual void GetContinuousIncrements(vtkDataArray *scalars,
| int extent[6], vtkIdType &incX, vtkIdType &incY,
| vtkIdType &incZ)
|
| Different ways to get the increments for moving around the data.
| incX is always returned with 0. incY is returned with the
| increment needed to move from the end of one X scanline of data
| to the start of the next line. incZ is filled in with the
| increment needed to move from the end of one image to the start
| of the next. The proper way to use these values is to for a loop
| over Z, Y, X, C, incrementing the pointer by 1 after each
| component. When the end of the component is reached, the pointer
| is set to the beginning of the next pixel, thus incX is properly
| set to 0. The first form of GetContinuousIncrements uses the
| active scalar field while the second form allows the scalar array
| to be passed in.
|
| GetData(...)
| GetData(info:vtkInformation) -> vtkImageData
| C++: static vtkImageData *GetData(vtkInformation *info)
| GetData(v:vtkInformationVector, i:int=0) -> vtkImageData
| C++: static vtkImageData *GetData(vtkInformationVector *v,
| int i=0)
|
| Retrieve an instance of this class from an information object.
|
| GetDataObjectType(...)
| GetDataObjectType(self) -> int
| C++: int GetDataObjectType() override;
|
| Return what type of dataset this is.
|
| GetDirectionMatrix(...)
| GetDirectionMatrix(self) -> vtkMatrix3x3
| C++: virtual vtkMatrix3x3 *GetDirectionMatrix()
|
| Set/Get the direction transform of the dataset. The direction
| matrix is a 3x3 transformation matrix supporting scaling and
| rotation.
|
| GetIncrements(...)
| GetIncrements(self) -> (int, int, int)
| C++: virtual vtkIdType *GetIncrements()
| GetIncrements(self, incX:int, incY:int, incZ:int) -> None
| C++: virtual void GetIncrements(vtkIdType &incX, vtkIdType &incY,
| vtkIdType &incZ)
| GetIncrements(self, inc:[int, int, int]) -> None
| C++: virtual void GetIncrements(vtkIdType inc[3])
| GetIncrements(self, scalars:vtkDataArray) -> (int, int, int)
| C++: virtual vtkIdType *GetIncrements(vtkDataArray *scalars)
| GetIncrements(self, scalars:vtkDataArray, incX:int, incY:int,
| incZ:int) -> None
| C++: virtual void GetIncrements(vtkDataArray *scalars,
| vtkIdType &incX, vtkIdType &incY, vtkIdType &incZ)
| GetIncrements(self, scalars:vtkDataArray, inc:[int, int, int])
| -> None
| C++: virtual void GetIncrements(vtkDataArray *scalars,
| vtkIdType inc[3])
|
| Different ways to get the increments for moving around the data.
| GetIncrements() calls ComputeIncrements() to ensure the
| increments are up to date. The first three methods compute the
| increments based on the active scalar field while the next three,
| the scalar field is passed in.
|
| Note that all methods which do not have the increments passed in
| are not thread-safe. When working on a given `vtkImageData`
| instance on multiple threads, each thread should use the `inc*`
| overloads to compute the increments to avoid racing with other
| threads.
|
| GetIndexToPhysicalMatrix(...)
| GetIndexToPhysicalMatrix(self) -> vtkMatrix4x4
| C++: virtual vtkMatrix4x4 *GetIndexToPhysicalMatrix()
|
| Get the transformation matrix from the index space to the
| physical space coordinate system of the dataset. The transform is
| a 4 by 4 matrix.
|
| GetNumberOfGenerationsFromBase(...)
| GetNumberOfGenerationsFromBase(self, type:str) -> int
| C++: vtkIdType GetNumberOfGenerationsFromBase(const char *type)
| override;
|
| Given the name of a base class of this class type, return the
| distance of inheritance between this class type and the named
| class (how many generations of inheritance are there between this
| class and the named class). If the named class is not in this
| class's inheritance tree, return a negative value. Valid
| responses will always be nonnegative. This method works in
| combination with vtkTypeMacro found in vtkSetGet.h.
|
| GetNumberOfGenerationsFromBaseType(...)
| GetNumberOfGenerationsFromBaseType(type:str) -> int
| C++: static vtkIdType GetNumberOfGenerationsFromBaseType(
| const char *type)
|
| Given a the name of a base class of this class type, return the
| distance of inheritance between this class type and the named
| class (how many generations of inheritance are there between this
| class and the named class). If the named class is not in this
| class's inheritance tree, return a negative value. Valid
| responses will always be nonnegative. This method works in
| combination with vtkTypeMacro found in vtkSetGet.h.
|
| GetOrigin(...)
| GetOrigin(self) -> (float, float, float)
| C++: virtual double *GetOrigin()
|
| Set/Get the origin of the dataset. The origin is the position in
| world coordinates of the point of extent (0,0,0). This point does
| not have to be part of the dataset, in other words, the dataset
| extent does not have to start at (0,0,0) and the origin can be
| outside of the dataset bounding box. The origin plus spacing
| determine the position in space of the points.
|
| GetPhysicalToIndexMatrix(...)
| GetPhysicalToIndexMatrix(self) -> vtkMatrix4x4
| C++: virtual vtkMatrix4x4 *GetPhysicalToIndexMatrix()
|
| Get the transformation matrix from the physical space to the
| index space coordinate system of the dataset. The transform is a
| 4 by 4 matrix.
|
| GetPointGradient(...)
| GetPointGradient(self, i:int, j:int, k:int, s:vtkDataArray,
| g:[float, float, float]) -> None
| C++: virtual void GetPointGradient(int i, int j, int k,
| vtkDataArray *s, double g[3])
|
| Given structured coordinates (i,j,k) for a point in a structured
| point dataset, compute the gradient vector from the scalar data
| at that point. The scalars s are the scalars from which the
| gradient is to be computed. This method will treat structured
| point datasets of any dimension.
|
| GetScalarComponentAsDouble(...)
| GetScalarComponentAsDouble(self, x:int, y:int, z:int,
| component:int) -> float
| C++: virtual double GetScalarComponentAsDouble(int x, int y,
| int z, int component)
|
| GetScalarComponentAsFloat(...)
| GetScalarComponentAsFloat(self, x:int, y:int, z:int,
| component:int) -> float
| C++: virtual float GetScalarComponentAsFloat(int x, int y, int z,
| int component)
|
| For access to data from wrappers
|
| GetScalarIndex(...)
| GetScalarIndex(self, coordinates:[int, int, int]) -> int
| C++: virtual vtkIdType GetScalarIndex(int coordinates[3])
| GetScalarIndex(self, x:int, y:int, z:int) -> int
| C++: virtual vtkIdType GetScalarIndex(int x, int y, int z)
|
| GetScalarIndexForExtent(...)
| GetScalarIndexForExtent(self, extent:[int, int, int, int, int,
| int]) -> int
| C++: virtual vtkIdType GetScalarIndexForExtent(int extent[6])
|
| Access the index for the scalar data
|
| GetScalarPointer(...)
| GetScalarPointer(self, coordinates:[int, int, int]) -> Pointer
| C++: virtual void *GetScalarPointer(int coordinates[3])
| GetScalarPointer(self, x:int, y:int, z:int) -> Pointer
| C++: virtual void *GetScalarPointer(int x, int y, int z)
| GetScalarPointer(self) -> Pointer
| C++: virtual void *GetScalarPointer()
|
| GetScalarPointerForExtent(...)
| GetScalarPointerForExtent(self, extent:[int, int, int, int, int,
| int]) -> Pointer
| C++: virtual void *GetScalarPointerForExtent(int extent[6])
|
| Access the native pointer for the scalar data
|
| GetScalarSize(...)
| GetScalarSize(self, meta_data:vtkInformation) -> int
| C++: virtual int GetScalarSize(vtkInformation *meta_data)
| GetScalarSize(self) -> int
| C++: virtual int GetScalarSize()
|
| Get the size of the scalar type in bytes.
|
| GetScalarTypeMax(...)
| GetScalarTypeMax(self, meta_data:vtkInformation) -> float
| C++: virtual double GetScalarTypeMax(vtkInformation *meta_data)
| GetScalarTypeMax(self) -> float
| C++: virtual double GetScalarTypeMax()
|
| GetScalarTypeMin(...)
| GetScalarTypeMin(self, meta_data:vtkInformation) -> float
| C++: virtual double GetScalarTypeMin(vtkInformation *meta_data)
| GetScalarTypeMin(self) -> float
| C++: virtual double GetScalarTypeMin()
|
| These returns the minimum and maximum values the ScalarType can
| hold without overflowing.
|
| GetSpacing(...)
| GetSpacing(self) -> (float, float, float)
| C++: virtual double *GetSpacing()
|
| Set the spacing (width,height,length) of the cubical cells that
| compose the data set.
|
| GetVoxelGradient(...)
| GetVoxelGradient(self, i:int, j:int, k:int, s:vtkDataArray,
| g:vtkDataArray) -> None
| C++: virtual void GetVoxelGradient(int i, int j, int k,
| vtkDataArray *s, vtkDataArray *g)
|
| Given structured coordinates (i,j,k) for a voxel cell, compute
| the eight gradient values for the voxel corners. The order in
| which the gradient vectors are arranged corresponds to the
| ordering of the voxel points. Gradient vector is computed by
| central differences (except on edges of volume where forward
| difference is used). The scalars s are the scalars from which the
| gradient is to be computed. This method will treat only 3D
| structured point datasets (i.e., volumes).
|
| IsA(...)
| IsA(self, type:str) -> int
| C++: vtkTypeBool IsA(const char *type) override;
|
| Return 1 if this class is the same type of (or a subclass of) the
| named class. Returns 0 otherwise. This method works in
| combination with vtkTypeMacro found in vtkSetGet.h.
|
| IsTypeOf(...)
| IsTypeOf(type:str) -> int
| C++: static vtkTypeBool IsTypeOf(const char *type)
|
| Return 1 if this class type is the same type of (or a subclass
| of) the named class. Returns 0 otherwise. This method works in
| combination with vtkTypeMacro found in vtkSetGet.h.
|
| NewInstance(...)
| NewInstance(self) -> vtkImageData
| C++: vtkImageData *NewInstance()
|
| PrepareForNewData(...)
| PrepareForNewData(self) -> None
| C++: void PrepareForNewData() override;
|
| make the output data ready for new data to be inserted. For most
| objects we just call Initialize. But for image data we leave the
| old data in case the memory can be reused.
|
| SafeDownCast(...)
| SafeDownCast(o:vtkObjectBase) -> vtkImageData
| C++: static vtkImageData *SafeDownCast(vtkObjectBase *o)
|
| SetAxisUpdateExtent(...)
| SetAxisUpdateExtent(self, axis:int, min:int, max:int,
| updateExtent:(int, ...), axisUpdateExtent:[int, ...]) -> None
| C++: virtual void SetAxisUpdateExtent(int axis, int min, int max,
| const int *updateExtent, int *axisUpdateExtent)
|
| Set / Get the extent on just one axis
|
| SetDirectionMatrix(...)
| SetDirectionMatrix(self, m:vtkMatrix3x3) -> None
| C++: virtual void SetDirectionMatrix(vtkMatrix3x3 *m)
| SetDirectionMatrix(self, elements:(float, float, float, float,
| float, float, float, float, float)) -> None
| C++: virtual void SetDirectionMatrix(const double elements[9])
| SetDirectionMatrix(self, e00:float, e01:float, e02:float,
| e10:float, e11:float, e12:float, e20:float, e21:float,
| e22:float) -> None
| C++: virtual void SetDirectionMatrix(double e00, double e01,
| double e02, double e10, double e11, double e12, double e20,
| double e21, double e22)
|
| SetOrigin(...)
| SetOrigin(self, i:float, j:float, k:float) -> None
| C++: virtual void SetOrigin(double i, double j, double k)
| SetOrigin(self, ijk:(float, float, float)) -> None
| C++: virtual void SetOrigin(const double ijk[3])
|
| SetScalarComponentFromDouble(...)
| SetScalarComponentFromDouble(self, x:int, y:int, z:int,
| component:int, v:float) -> None
| C++: virtual void SetScalarComponentFromDouble(int x, int y,
| int z, int component, double v)
|
| SetScalarComponentFromFloat(...)
| SetScalarComponentFromFloat(self, x:int, y:int, z:int,
| component:int, v:float) -> None
| C++: virtual void SetScalarComponentFromFloat(int x, int y, int z,
| int component, float v)
|
| SetSpacing(...)
| SetSpacing(self, i:float, j:float, k:float) -> None
| C++: virtual void SetSpacing(double i, double j, double k)
| SetSpacing(self, ijk:(float, float, float)) -> None
| C++: virtual void SetSpacing(const double ijk[3])
|
| ShallowCopy(...)
| ShallowCopy(self, src:vtkDataObject) -> None
| C++: void ShallowCopy(vtkDataObject *src) override;
|
| Shallow and Deep copy.
|
| TransformContinuousIndexToPhysicalPoint(...)
| TransformContinuousIndexToPhysicalPoint(self, i:float, j:float,
| k:float, xyz:[float, float, float]) -> None
| C++: virtual void TransformContinuousIndexToPhysicalPoint(
| double i, double j, double k, double xyz[3])
| TransformContinuousIndexToPhysicalPoint(self, ijk:(float, float,
| float), xyz:[float, float, float]) -> None
| C++: virtual void TransformContinuousIndexToPhysicalPoint(
| const double ijk[3], double xyz[3])
| TransformContinuousIndexToPhysicalPoint(i:float, j:float, k:float,
| origin:(float, float, float), spacing:(float, float, float),
| direction:(float, float, float, float, float, float, float,
| float, float), xyz:[float, float, float]) -> None
| C++: static void TransformContinuousIndexToPhysicalPoint(double i,
| double j, double k, double const origin[3],
| double const spacing[3], double const direction[9],
| double xyz[3])
|
| Convert coordinates from index space (ijk) to physical space
| (xyz).
|
| TransformIndexToPhysicalPoint(...)
| TransformIndexToPhysicalPoint(self, i:int, j:int, k:int,
| xyz:[float, float, float]) -> None
| C++: virtual void TransformIndexToPhysicalPoint(int i, int j,
| int k, double xyz[3])
| TransformIndexToPhysicalPoint(self, ijk:(int, int, int),
| xyz:[float, float, float]) -> None
| C++: virtual void TransformIndexToPhysicalPoint(const int ijk[3],
| double xyz[3])
|
| TransformPhysicalNormalToContinuousIndex(...)
| TransformPhysicalNormalToContinuousIndex(self, xyz:(float, float,
| float), ijk:[float, float, float]) -> None
| C++: virtual void TransformPhysicalNormalToContinuousIndex(
| const double xyz[3], double ijk[3])
|
| Convert normal from physical space (xyz) to index space (ijk).
|
| TransformPhysicalPlaneToContinuousIndex(...)
| TransformPhysicalPlaneToContinuousIndex(self, pplane:(float,
| float, float, float), iplane:[float, float, float, float])
| -> None
| C++: virtual void TransformPhysicalPlaneToContinuousIndex(
| double const pplane[4], double iplane[4])
|
| Convert a plane from physical to a continuous index. The plane is
| represented as n(x-xo)=0; or using a four component normal:
| pplane=( nx,ny,nz,-(n(x0)) ).
|
| TransformPhysicalPointToContinuousIndex(...)
| TransformPhysicalPointToContinuousIndex(self, x:float, y:float,
| z:float, ijk:[float, float, float]) -> None
| C++: virtual void TransformPhysicalPointToContinuousIndex(
| double x, double y, double z, double ijk[3])
| TransformPhysicalPointToContinuousIndex(self, xyz:(float, float,
| float), ijk:[float, float, float]) -> None
| C++: virtual void TransformPhysicalPointToContinuousIndex(
| const double xyz[3], double ijk[3])
|
| Convert coordinates from physical space (xyz) to index space
| (ijk).
|
| __buffer__(self, flags, /)
| Return a buffer object that exposes the underlying memory of the object.
|
| __delattr__(self, name, /)
| Implement delattr(self, name).
|
| __release_buffer__(self, buffer, /)
| Release the buffer object that exposes the underlying memory of the object.
|
| ----------------------------------------------------------------------
| Data descriptors inherited from vtkmodules.vtkCommonDataModel.vtkImageData:
|
| __this__
| Pointer to the C++ object.
|
| data_object_type
| read-only, calls GetDataObjectType
|
| increments
| read-only, calls GetIncrements
|
| scalar_pointer
| read-only, calls GetScalarPointer
|
| scalar_size
| read-only, calls GetScalarSize
|
| scalar_type_max
| read-only, calls GetScalarTypeMax
|
| scalar_type_min
| read-only, calls GetScalarTypeMin
|
| ----------------------------------------------------------------------
| Data and other attributes inherited from vtkmodules.vtkCommonDataModel.vtkImageData:
|
| __vtkname__ = 'vtkImageData'
|
| ----------------------------------------------------------------------
| Methods inherited from vtkmodules.vtkCommonDataModel.vtkCartesianGrid:
|
| BlankCell(...)
| BlankCell(self, ptId:int) -> None
| C++: virtual void BlankCell(vtkIdType ptId)
| BlankCell(self, i:int, j:int, k:int) -> None
| C++: virtual void BlankCell(int i, int j, int k)
|
| Methods for supporting blanking of cells. Blanking turns on or
| off cells in the structured grid. These methods should be called
| only after the dimensions of the grid are set.
|
| BlankPoint(...)
| BlankPoint(self, ptId:int) -> None
| C++: virtual void BlankPoint(vtkIdType ptId)
| BlankPoint(self, i:int, j:int, k:int) -> None
| C++: virtual void BlankPoint(int i, int j, int k)
|
| Methods for supporting blanking of cells. Blanking turns on or
| off points in the structured grid, and hence the cells connected
| to them. These methods should be called only after the dimensions
| of the grid are set.
|
| FindAndGetCell(...)
| FindAndGetCell(self, x:[float, float, float], cell:vtkCell,
| cellId:int, tol2:float, subId:int, pcoords:[float, float,
| float], weights:[float, ...]) -> vtkCell
| C++: vtkCell *FindAndGetCell(double x[3], vtkCell *cell,
| vtkIdType cellId, double tol2, int &subId, double pcoords[3],
| double *weights) override;
|
| Locate the cell that contains a point and return the cell. Also
| returns the subcell id, parametric coordinates and weights for
| subsequent interpolation. This method combines the derived class
| methods int FindCell and vtkCell *GetCell. Derived classes may
| provide a more efficient implementation. See for example
| vtkStructuredPoints. THIS METHOD IS NOT THREAD SAFE.
|
| GetCellDims(...)
| GetCellDims(self, cellDims:[int, int, int]) -> None
| C++: void GetCellDims(int cellDims[3])
|
| Given the node dimensions of this grid instance, this method
| computes the node dimensions. The value in each dimension can
| will have a lowest value of "1" such that computing the total
| number of cells can be achieved by simply by
| cellDims[0]*cellDims[1]*cellDims[2].
|
| GetCellNeighbors(...)
| GetCellNeighbors(self, cellId:int, ptIds:vtkIdList,
| cellIds:vtkIdList) -> None
| C++: void GetCellNeighbors(vtkIdType cellId, vtkIdList *ptIds,
| vtkIdList *cellIds) override;
| GetCellNeighbors(self, cellId:int, ptIds:vtkIdList,
| cellIds:vtkIdList, seedLoc:[int, ...]) -> None
| C++: void GetCellNeighbors(vtkIdType cellId, vtkIdList *ptIds,
| vtkIdList *cellIds, int *seedLoc)
|
| Topological inquiry to get all cells using list of points
| exclusive of cell specified (e.g., cellId). Note that the list
| consists of only cells that use ALL the points provided. THIS
| METHOD IS THREAD SAFE IF FIRST CALLED FROM A SINGLE THREAD AND
| THE DATASET IS NOT MODIFIED
|
| GetCellPoints(...)
| GetCellPoints(self, cellId:int, npts:int, pts:(int, ...),
| ptIds:vtkIdList) -> None
| C++: void GetCellPoints(vtkIdType cellId, vtkIdType &npts,
| vtkIdType const *&pts, vtkIdList *ptIds) override;
| GetCellPoints(self, cellId:int, ptIds:vtkIdList) -> None
| C++: void GetCellPoints(vtkIdType cellId, vtkIdList *ptIds)
| override;
|
| Topological inquiry to get points defining cell.
|
| This function MAY use ptIds, which is an object that is created
| by each thread, to guarantee thread safety.
|
| @warning Subsequent calls to this method may invalidate previous
| call
| results.
|
| THIS METHOD IS THREAD SAFE IF FIRST CALLED FROM A SINGLE THREAD
| AND THE DATASET IS NOT MODIFIED
|
| GetCellSize(...)
| GetCellSize(self, cellId:int) -> int
| C++: vtkIdType GetCellSize(vtkIdType cellId) override;
|
| Get the size of cell with cellId such that: 0 <= cellId <
| NumberOfCells. THIS METHOD IS THREAD SAFE IF FIRST CALLED FROM A
| SINGLE THREAD AND THE DATASET IS NOT MODIFIED
|
| @warning This method MUST be overridden for performance reasons.
| Default implementation is very inefficient.
|
| GetCellType(...)
| GetCellType(self, cellId:int) -> int
| C++: int GetCellType(vtkIdType cellId) override;
|
| Get type of cell with cellId such that: 0 <= cellId <
| NumberOfCells. THIS METHOD IS THREAD SAFE IF FIRST CALLED FROM A
| SINGLE THREAD AND THE DATASET IS NOT MODIFIED
|
| GetCellTypes(...)
| GetCellTypes(self) -> vtkConstantArray_IhE
| C++: vtkConstantArray<unsigned char> *GetCellTypes()
| GetCellTypes(self, types:vtkCellTypes) -> None
| C++: virtual void GetCellTypes(vtkCellTypes *types)
|
| GetCellTypesArray(...)
| GetCellTypesArray(self) -> vtkConstantArray_IiE
| C++: vtkConstantArray<int> *GetCellTypesArray()
|
| GetCells(...)
| GetCells(self) -> vtkStructuredCellArray
| C++: vtkStructuredCellArray *GetCells()
|
| Return the image data connectivity array.
|
| NOTE: the returned object should not be modified.
|
| GetDataDescription(...)
| GetDataDescription(self) -> int
| C++: virtual int GetDataDescription()
|
| Get the data description of the rectilinear grid.
|
| GetDataDimension(...)
| GetDataDimension(self) -> int
| C++: int GetDataDimension()
|
| Return the dimensionality of the data.
|
| GetDimensions(...)
| GetDimensions(self) -> (int, int, int)
| C++: int *GetDimensions()
| GetDimensions(self, dims:[int, int, int]) -> None
| C++: void GetDimensions(int dims[3])
| GetDimensions(self, dims:[int, int, int]) -> None
| C++: void GetDimensions(vtkIdType dims[3])
|
| Get dimensions of this structured points dataset. It is the
| number of points on each axis. Dimensions are computed from
| Extents during this call.
| \warning Non thread-safe, use second signature if you want it to
| be.
|
| GetExtent(...)
| GetExtent(self) -> (int, int, int, int, int, int)
| C++: virtual int *GetExtent()
|
| GetExtentType(...)
| GetExtentType(self) -> int
| C++: int GetExtentType() override;
|
| Structured extent. The extent type is a 3D extent
|
| GetMaxCellSize(...)
| GetMaxCellSize(self) -> int
| C++: int GetMaxCellSize() override;
|
| Convenience method returns largest cell size in dataset. This is
| generally used to allocate memory for supporting data structures.
| THIS METHOD IS THREAD SAFE
|
| GetMaxSpatialDimension(...)
| GetMaxSpatialDimension(self) -> int
| C++: int GetMaxSpatialDimension() override;
|
| Get the maximum/minimum spatial dimensionality of the data which
| is the maximum/minimum dimension of all cells.
|
| @warning This method MUST be overridden for performance reasons.
| Default implementation is very inefficient.
|
| GetMinSpatialDimension(...)
| GetMinSpatialDimension(self) -> int
| C++: int GetMinSpatialDimension() override;
|
| GetNumberOfCells(...)
| GetNumberOfCells(self) -> int
| C++: vtkIdType GetNumberOfCells() override;
|
| Determine the number of cells composing the dataset. THIS METHOD
| IS THREAD SAFE
|
| GetNumberOfPoints(...)
| GetNumberOfPoints(self) -> int
| C++: vtkIdType GetNumberOfPoints() override;
|
| Determine the number of points composing the dataset. THIS METHOD
| IS THREAD SAFE
|
| GetNumberOfScalarComponents(...)
| GetNumberOfScalarComponents(meta_data:vtkInformation) -> int
| C++: static int GetNumberOfScalarComponents(
| vtkInformation *meta_data)
| GetNumberOfScalarComponents(self) -> int
| C++: int GetNumberOfScalarComponents()
|
| GetPoint(...)
| GetPoint(self, id:int, x:[float, float, float]) -> None
| C++: void GetPoint(vtkIdType id, double x[3]) override;
| GetPoint(self, ptId:int) -> (float, float, float)
| C++: double *GetPoint(vtkIdType ptId) override;
|
| Copy point coordinates into user provided array x[3] for
| specified point id. THIS METHOD IS THREAD SAFE IF FIRST CALLED
| FROM A SINGLE THREAD AND THE DATASET IS NOT MODIFIED
|
| GetPointCells(...)
| GetPointCells(self, ptId:int, cellIds:vtkIdList) -> None
| C++: void GetPointCells(vtkIdType ptId, vtkIdList *cellIds)
| override;
|
| Topological inquiry to get cells using point. THIS METHOD IS
| THREAD SAFE IF FIRST CALLED FROM A SINGLE THREAD AND THE DATASET
| IS NOT MODIFIED
|
| GetPoints(...)
| GetPoints(self) -> vtkPoints
| C++: vtkPoints *GetPoints() override;
|
| Standard vtkDataSet API methods. See vtkDataSet for more
| information.
|
| GetScalarType(...)
| GetScalarType(meta_data:vtkInformation) -> int
| C++: static int GetScalarType(vtkInformation *meta_data)
| GetScalarType(self) -> int
| C++: int GetScalarType()
|
| GetScalarTypeAsString(...)
| GetScalarTypeAsString(self) -> str
| C++: const char *GetScalarTypeAsString()
|
| GetTupleIndex(...)
| GetTupleIndex(self, array:vtkDataArray, coordinates:[int, int,
| int]) -> int
| C++: vtkIdType GetTupleIndex(vtkDataArray *array,
| int coordinates[3])
| GetTupleIndex(self, array:vtkDataArray, x:int, y:int, z:int)
| -> int
| C++: vtkIdType GetTupleIndex(vtkDataArray *array, int x, int y,
| int z)
|
| GetTupleIndexForExtent(...)
| GetTupleIndexForExtent(self, array:vtkDataArray, extent:[int, int,
| int, int, int, int]) -> int
| C++: vtkIdType GetTupleIndexForExtent(vtkDataArray *array,
| int extent[6])
|
| Given a data array and a coordinate, return the index of the
| tuple in the array corresponding to that coordinate.
|
| GetValueIndex(...)
| GetValueIndex(self, array:vtkDataArray, coordinates:[int, int,
| int]) -> int
| C++: vtkIdType GetValueIndex(vtkDataArray *array,
| int coordinates[3])
| GetValueIndex(self, array:vtkDataArray, x:int, y:int, z:int)
| -> int
| C++: vtkIdType GetValueIndex(vtkDataArray *array, int x, int y,
| int z)
|
| GetValueIndexForExtent(...)
| GetValueIndexForExtent(self, array:vtkDataArray, extent:[int, int,
| int, int, int, int]) -> int
| C++: vtkIdType GetValueIndexForExtent(vtkDataArray *array,
| int extent[6])
|
| Given a data array and a coordinate, return the index of the
| value in the array corresponding to that coordinate, considering
| the number of components.
|
| HasAnyBlankCells(...)
| HasAnyBlankCells(self) -> bool
| C++: bool HasAnyBlankCells() override;
|
| Returns 1 if there are any blanking cells 0 otherwise. Blanking
| is supported only for vtkStructuredGrid and vtkUniformGrid
|
| HasAnyBlankPoints(...)
| HasAnyBlankPoints(self) -> bool
| C++: bool HasAnyBlankPoints() override;
|
| Returns 1 if there are any blanking points 0 otherwise. Blanking
| is supported only for vtkStructuredGrid and vtkUniformGrid
|
| HasNumberOfScalarComponents(...)
| HasNumberOfScalarComponents(meta_data:vtkInformation) -> bool
| C++: static bool HasNumberOfScalarComponents(
| vtkInformation *meta_data)
|
| HasScalarType(...)
| HasScalarType(meta_data:vtkInformation) -> bool
| C++: static bool HasScalarType(vtkInformation *meta_data)
|
| Initialize(...)
| Initialize(self) -> None
| C++: void Initialize() override;
|
| Restore data object to initial state. THIS METHOD IS NOT THREAD
| SAFE.
|
| IsCellVisible(...)
| IsCellVisible(self, cellId:int) -> int
| C++: unsigned char IsCellVisible(vtkIdType cellId)
|
| Return non-zero value if specified point is visible. These
| methods should be called only after the dimensions of the grid
| are set.
|
| IsPointVisible(...)
| IsPointVisible(self, ptId:int) -> int
| C++: unsigned char IsPointVisible(vtkIdType ptId)
|
| Return non-zero value if specified point is visible. These
| methods should be called only after the dimensions of the grid
| are set.
|
| SetDimensions(...)
| SetDimensions(self, i:int, j:int, k:int) -> None
| C++: void SetDimensions(int i, int j, int k)
| SetDimensions(self, dim:(int, int, int)) -> None
| C++: void SetDimensions(const int dim[3])
|
| Set dimensions of rectilinear grid dataset. This also sets the
| extent.
|
| SetExtent(...)
| SetExtent(self, extent:[int, int, int, int, int, int]) -> None
| C++: void SetExtent(int extent[6])
| SetExtent(self, xMin:int, xMax:int, yMin:int, yMax:int, zMin:int,
| zMax:int) -> None
| C++: void SetExtent(int xMin, int xMax, int yMin, int yMax,
| int zMin, int zMax)
|
| Set/Get the extent. On each axis, the extent is defined by the
| index of the first point and the index of the last point. The
| extent should be set before the "Scalars" are set or allocated.
| The Extent is stored in the order (X, Y, Z). The dataset extent
| does not have to start at (0,0,0). (0,0,0) is just the extent of
| the origin. The first point (the one with Id=0) is at extent
| (Extent[0],Extent[2],Extent[4]). As for any dataset, a data array
| on point data starts at Id=0.
|
| SetNumberOfScalarComponents(...)
| SetNumberOfScalarComponents(n:int, meta_data:vtkInformation)
| -> None
| C++: static void SetNumberOfScalarComponents(int n,
| vtkInformation *meta_data)
|
| Set/Get the number of scalar components for points. As with the
| SetScalarType method this is setting pipeline info. 1 if not set
| or empty.
|
| SetScalarType(...)
| SetScalarType(__a:int, meta_data:vtkInformation) -> None
| C++: static void SetScalarType(int, vtkInformation *meta_data)
|
| Set/Get the scalar data type for the points. This is setting
| pipeline info. Assume VTK_DOUBLE if not set or empty.
|
| UnBlankCell(...)
| UnBlankCell(self, ptId:int) -> None
| C++: virtual void UnBlankCell(vtkIdType ptId)
| UnBlankCell(self, i:int, j:int, k:int) -> None
| C++: virtual void UnBlankCell(int i, int j, int k)
|
| UnBlankPoint(...)
| UnBlankPoint(self, ptId:int) -> None
| C++: virtual void UnBlankPoint(vtkIdType ptId)
| UnBlankPoint(self, i:int, j:int, k:int) -> None
| C++: virtual void UnBlankPoint(int i, int j, int k)
|
| ----------------------------------------------------------------------
| Data descriptors inherited from vtkmodules.vtkCommonDataModel.vtkCartesianGrid:
|
| cell_types
| read-only, calls GetCellTypes
|
| cell_types_array
| read-only, calls GetCellTypesArray
|
| cells
| read-only, calls GetCells
|
| data_description
| read-only, calls GetDataDescription
|
| data_dimension
| read-only, calls GetDataDimension
|
| extent_type
| read-only, calls GetExtentType
|
| max_cell_size
| read-only, calls GetMaxCellSize
|
| max_spatial_dimension
| read-only, calls GetMaxSpatialDimension
|
| min_spatial_dimension
| read-only, calls GetMinSpatialDimension
|
| number_of_scalar_components
| read-only, calls GetNumberOfScalarComponents
|
| scalar_type
| read-only, calls GetScalarType
|
| ----------------------------------------------------------------------
| Methods inherited from vtkmodules.vtkCommonDataModel.vtkDataSet:
|
| AllocateCellGhostArray(...)
| AllocateCellGhostArray(self) -> vtkUnsignedCharArray
| C++: vtkUnsignedCharArray *AllocateCellGhostArray()
|
| Allocate ghost array for cells.
|
| AllocatePointGhostArray(...)
| AllocatePointGhostArray(self) -> vtkUnsignedCharArray
| C++: vtkUnsignedCharArray *AllocatePointGhostArray()
|
| Allocate ghost array for points.
|
| CheckAttributes(...)
| CheckAttributes(self) -> int
| C++: int CheckAttributes()
|
| This method checks to see if the cell and point attributes match
| the geometry. Many filters will crash if the number of tuples in
| an array is less than the number of points/cells. This method
| returns 1 if there is a mismatch, and 0 if everything is ok. It
| prints an error if an array is too short, and a warning if an
| array is too long.
|
| CopyAttributes(...)
| CopyAttributes(self, ds:vtkDataSet) -> None
| C++: virtual void CopyAttributes(vtkDataSet *ds)
|
| Copy the attributes associated with the specified dataset to this
| instance of vtkDataSet. THIS METHOD IS NOT THREAD SAFE.
|
| GenerateGhostArray(...)
| GenerateGhostArray(self, zeroExt:[int, int, int, int, int, int])
| -> None
| C++: virtual void GenerateGhostArray(int zeroExt[6])
| GenerateGhostArray(self, zeroExt:[int, int, int, int, int, int],
| cellOnly:bool) -> None
| C++: virtual void GenerateGhostArray(int zeroExt[6],
| bool cellOnly)
|
| Normally called by pipeline executives or algorithms only. This
| method computes the ghost arrays for a given dataset. The zeroExt
| argument specifies the extent of the region which ghost type = 0.
|
| GetAttributesAsFieldData(...)
| GetAttributesAsFieldData(self, type:int) -> vtkFieldData
| C++: vtkFieldData *GetAttributesAsFieldData(int type) override;
|
| Returns the attributes of the data object as a vtkFieldData. This
| returns non-null values in all the same cases as GetAttributes,
| in addition to the case of FIELD, which will return the field
| data for any vtkDataObject subclass.
|
| GetBounds(...)
| GetBounds(self) -> (float, float, float, float, float, float)
| C++: double *GetBounds()
| GetBounds(self, bounds:[float, float, float, float, float, float])
| -> None
| C++: void GetBounds(double bounds[6])
|
| Return a pointer to the geometry bounding box in the form
| (xmin,xmax, ymin,ymax, zmin,zmax). THIS METHOD IS NOT THREAD
| SAFE.
|
| GetCellData(...)
| GetCellData(self) -> vtkCellData
| C++: vtkCellData *GetCellData()
|
| Return a pointer to this dataset's cell data. THIS METHOD IS
| THREAD SAFE
|
| GetCellGhostArray(...)
| GetCellGhostArray(self) -> vtkUnsignedCharArray
| C++: vtkUnsignedCharArray *GetCellGhostArray()
|
| Get the array that defines the ghost type of each cell. We cache
| the pointer to the array to save a lookup involving string
| comparisons
|
| GetCellNumberOfFaces(...)
| GetCellNumberOfFaces(self, cellId:int, cellType:int,
| cell:vtkGenericCell) -> int
| C++: virtual int GetCellNumberOfFaces(vtkIdType cellId,
| unsigned char &cellType, vtkGenericCell *cell)
|
| Get the number of faces of a cell.
|
| Most of the times extracting the number of faces requires only
| extracting the cell type. However, for some cell types, the
| number of faces is not constant. For example, a convex point set
| cell can have a different number of faces for each cell. That's
| why this method requires the cell id and the dataset.
|
| GetCenter(...)
| GetCenter(self) -> (float, float, float)
| C++: double *GetCenter()
| GetCenter(self, center:[float, float, float]) -> None
| C++: void GetCenter(double center[3])
|
| Get the center of the bounding box. THIS METHOD IS NOT THREAD
| SAFE.
|
| GetDistinctCellTypes(...)
| GetDistinctCellTypes(self, types:vtkCellTypes) -> None
| C++: virtual void GetDistinctCellTypes(vtkCellTypes *types)
|
| Get a list of types of cells in a dataset. The list consists of
| an array of types (not necessarily in any order), with a single
| entry per type. For example a dataset 5 triangles, 3 lines, and
| 100 hexahedra would result a list of three entries, corresponding
| to the types VTK_TRIANGLE, VTK_LINE, and VTK_HEXAHEDRON. THIS
| METHOD IS THREAD SAFE IF FIRST CALLED FROM A SINGLE THREAD AND
| THE DATASET IS NOT MODIFIED
|
| GetGhostArray(...)
| GetGhostArray(self, type:int) -> vtkUnsignedCharArray
| C++: vtkUnsignedCharArray *GetGhostArray(int type) override;
|
| Returns the ghost array for the given type (point or cell). Takes
| advantage of the cache with the pointer to the array to save a
| string comparison.
|
| GetLength(...)
| GetLength(self) -> float
| C++: double GetLength()
|
| Return the length of the diagonal of the bounding box. THIS
| METHOD IS THREAD SAFE IF FIRST CALLED FROM A SINGLE THREAD AND
| THE DATASET IS NOT MODIFIED
|
| GetLength2(...)
| GetLength2(self) -> float
| C++: double GetLength2()
|
| Return the squared length of the diagonal of the bounding box.
| THIS METHOD IS THREAD SAFE IF FIRST CALLED FROM A SINGLE THREAD
| AND THE DATASET IS NOT MODIFIED
|
| GetMTime(...)
| GetMTime(self) -> int
| C++: vtkMTimeType GetMTime() override;
|
| Datasets are composite objects and need to check each part for
| MTime THIS METHOD IS THREAD SAFE
|
| GetMeshMTime(...)
| GetMeshMTime(self) -> int
| C++: virtual vtkMTimeType GetMeshMTime()
|
| Abstract method which return the mesh (geometry/topology)
| modification time. This time is different from the usual MTime
| which also takes into account the modification of data arrays.
| This function can be used to track the changes on the mesh
| separately from the data arrays (eg. static mesh over time with
| transient data). The default implementation returns the MTime. It
| is up to subclasses to provide a better approach.
|
| GetNumberOfElements(...)
| GetNumberOfElements(self, type:int) -> int
| C++: vtkIdType GetNumberOfElements(int type) override;
|
| Get the number of elements for a specific attribute type (POINT,
| CELL, etc.).
|
| GetPointData(...)
| GetPointData(self) -> vtkPointData
| C++: vtkPointData *GetPointData()
|
| Return a pointer to this dataset's point data. THIS METHOD IS
| THREAD SAFE
|
| GetPointGhostArray(...)
| GetPointGhostArray(self) -> vtkUnsignedCharArray
| C++: vtkUnsignedCharArray *GetPointGhostArray()
|
| Gets the array that defines the ghost type of each point. We
| cache the pointer to the array to save a lookup involving string
| comparisons
|
| GetScalarRange(...)
| GetScalarRange(self, range:[float, float]) -> None
| C++: virtual void GetScalarRange(double range[2])
| GetScalarRange(self) -> (float, float)
| C++: double *GetScalarRange()
|
| Convenience method to get the range of the first component (and
| only the first component) of any scalars in the data set. If the
| data has both point data and cell data, it returns the (min/max)
| range of combined point and cell data. If there are no point or
| cell scalars the method will return (0,1). Note: It might be
| necessary to call Update to create or refresh the scalars before
| calling this method. THIS METHOD IS THREAD SAFE IF FIRST CALLED
| FROM A SINGLE THREAD AND THE DATASET IS NOT MODIFIED
|
| HasAnyGhostCells(...)
| HasAnyGhostCells(self) -> bool
| C++: bool HasAnyGhostCells()
|
| Returns 1 if there are any ghost cells 0 otherwise.
|
| HasAnyGhostPoints(...)
| HasAnyGhostPoints(self) -> bool
| C++: bool HasAnyGhostPoints()
|
| Returns 1 if there are any ghost points 0 otherwise.
|
| NewCellIterator(...)
| NewCellIterator(self) -> vtkCellIterator
| C++: virtual vtkCellIterator *NewCellIterator()
|
| Return an iterator that traverses the cells in this data set.
|
| SetCellOrderAndRationalWeights(...)
| SetCellOrderAndRationalWeights(self, cellId:int,
| cell:vtkGenericCell) -> None
| C++: void SetCellOrderAndRationalWeights(vtkIdType cellId,
| vtkGenericCell *cell)
|
| Squeeze(...)
| Squeeze(self) -> None
| C++: virtual void Squeeze()
|
| Reclaim any extra memory used to store data. THIS METHOD IS NOT
| THREAD SAFE.
|
| SupportsGhostArray(...)
| SupportsGhostArray(self, type:int) -> bool
| C++: bool SupportsGhostArray(int type) override;
|
| Returns true for POINT or CELL, false otherwise
|
| ----------------------------------------------------------------------
| Data descriptors inherited from vtkmodules.vtkCommonDataModel.vtkDataSet:
|
| cell_ghost_array
| read-only, calls GetCellGhostArray
|
| length2
| read-only, calls GetLength2
|
| m_time
| read-only, calls GetMTime
|
| mesh_m_time
| read-only, calls GetMeshMTime
|
| point_ghost_array
| read-only, calls GetPointGhostArray
|
| scalar_range
| read-only, calls GetScalarRange
|
| ----------------------------------------------------------------------
| Data and other attributes inherited from vtkmodules.vtkCommonDataModel.vtkDataSet:
|
| CELL_DATA_FIELD = 2
|
| DATA_OBJECT_FIELD = 0
|
| FieldDataType = <class 'vtkmodules.vtkCommonDataModel.vtkDataSet.Field...
|
| POINT_DATA_FIELD = 1
|
| ----------------------------------------------------------------------
| Methods inherited from vtkmodules.vtkCommonDataModel.vtkDataObject:
|
| ALL_PIECES_EXTENT(...)
| ALL_PIECES_EXTENT() -> vtkInformationIntegerVectorKey
| C++: static vtkInformationIntegerVectorKey *ALL_PIECES_EXTENT()
|
| \ingroup InformationKeys
|
| BOUNDING_BOX(...)
| BOUNDING_BOX() -> vtkInformationDoubleVectorKey
| C++: static vtkInformationDoubleVectorKey *BOUNDING_BOX()
|
| \ingroup InformationKeys
|
| CELL_DATA_VECTOR(...)
| CELL_DATA_VECTOR() -> vtkInformationInformationVectorKey
| C++: static vtkInformationInformationVectorKey *CELL_DATA_VECTOR()
|
| \ingroup InformationKeys
|
| DATA_EXTENT(...)
| DATA_EXTENT() -> vtkInformationIntegerPointerKey
| C++: static vtkInformationIntegerPointerKey *DATA_EXTENT()
|
| \ingroup InformationKeys
|
| DATA_EXTENT_TYPE(...)
| DATA_EXTENT_TYPE() -> vtkInformationIntegerKey
| C++: static vtkInformationIntegerKey *DATA_EXTENT_TYPE()
|
| \ingroup InformationKeys
|
| DATA_NUMBER_OF_GHOST_LEVELS(...)
| DATA_NUMBER_OF_GHOST_LEVELS() -> vtkInformationIntegerKey
| C++: static vtkInformationIntegerKey *DATA_NUMBER_OF_GHOST_LEVELS(
| )
|
| \ingroup InformationKeys
|
| DATA_NUMBER_OF_PIECES(...)
| DATA_NUMBER_OF_PIECES() -> vtkInformationIntegerKey
| C++: static vtkInformationIntegerKey *DATA_NUMBER_OF_PIECES()
|
| \ingroup InformationKeys
|
| DATA_OBJECT(...)
| DATA_OBJECT() -> vtkInformationDataObjectKey
| C++: static vtkInformationDataObjectKey *DATA_OBJECT()
|
| \ingroup InformationKeys
|
| DATA_PIECE_NUMBER(...)
| DATA_PIECE_NUMBER() -> vtkInformationIntegerKey
| C++: static vtkInformationIntegerKey *DATA_PIECE_NUMBER()
|
| \ingroup InformationKeys
|
| DATA_TIME_STEP(...)
| DATA_TIME_STEP() -> vtkInformationDoubleKey
| C++: static vtkInformationDoubleKey *DATA_TIME_STEP()
|
| \ingroup InformationKeys
|
| DATA_TYPE_NAME(...)
| DATA_TYPE_NAME() -> vtkInformationStringKey
| C++: static vtkInformationStringKey *DATA_TYPE_NAME()
|
| \ingroup InformationKeys
|
| DIRECTION(...)
| DIRECTION() -> vtkInformationDoubleVectorKey
| C++: static vtkInformationDoubleVectorKey *DIRECTION()
|
| \ingroup InformationKeys
|
| DataHasBeenGenerated(...)
| DataHasBeenGenerated(self) -> None
| C++: void DataHasBeenGenerated()
|
| This method is called by the source when it executes to generate
| data. It is sort of the opposite of ReleaseData. It sets the
| DataReleased flag to 0, and sets a new UpdateTime.
|
| EDGE_DATA_VECTOR(...)
| EDGE_DATA_VECTOR() -> vtkInformationInformationVectorKey
| C++: static vtkInformationInformationVectorKey *EDGE_DATA_VECTOR()
|
| \ingroup InformationKeys
|
| FIELD_ACTIVE_ATTRIBUTE(...)
| FIELD_ACTIVE_ATTRIBUTE() -> vtkInformationIntegerKey
| C++: static vtkInformationIntegerKey *FIELD_ACTIVE_ATTRIBUTE()
|
| \ingroup InformationKeys
|
| FIELD_ARRAY_TYPE(...)
| FIELD_ARRAY_TYPE() -> vtkInformationIntegerKey
| C++: static vtkInformationIntegerKey *FIELD_ARRAY_TYPE()
|
| \ingroup InformationKeys
|
| FIELD_ASSOCIATION(...)
| FIELD_ASSOCIATION() -> vtkInformationIntegerKey
| C++: static vtkInformationIntegerKey *FIELD_ASSOCIATION()
|
| \ingroup InformationKeys
|
| FIELD_ATTRIBUTE_COMPONENT(...)
| FIELD_ATTRIBUTE_COMPONENT() -> vtkInformationIntegerKey
| C++: static vtkInformationIntegerKey *FIELD_ATTRIBUTE_COMPONENT()
|
| \ingroup InformationKeys
|
| If present, this key specifies an actual or virtual component of
| the array. Virtual components are functions of tuples that
| evaluate to a single number – such as L₁ or L₂ norms.
|
| This takes on values from the vtkArrayComponents enumeration as
| well as non-negative integers.
|
| FIELD_ATTRIBUTE_TYPE(...)
| FIELD_ATTRIBUTE_TYPE() -> vtkInformationIntegerKey
| C++: static vtkInformationIntegerKey *FIELD_ATTRIBUTE_TYPE()
|
| \ingroup InformationKeys
|
| FIELD_NAME(...)
| FIELD_NAME() -> vtkInformationStringKey
| C++: static vtkInformationStringKey *FIELD_NAME()
|
| \ingroup InformationKeys
|
| FIELD_NUMBER_OF_COMPONENTS(...)
| FIELD_NUMBER_OF_COMPONENTS() -> vtkInformationIntegerKey
| C++: static vtkInformationIntegerKey *FIELD_NUMBER_OF_COMPONENTS()
|
| \ingroup InformationKeys
|
| FIELD_NUMBER_OF_TUPLES(...)
| FIELD_NUMBER_OF_TUPLES() -> vtkInformationIntegerKey
| C++: static vtkInformationIntegerKey *FIELD_NUMBER_OF_TUPLES()
|
| \ingroup InformationKeys
|
| FIELD_OPERATION(...)
| FIELD_OPERATION() -> vtkInformationIntegerKey
| C++: static vtkInformationIntegerKey *FIELD_OPERATION()
|
| \ingroup InformationKeys
|
| FIELD_RANGE(...)
| FIELD_RANGE() -> vtkInformationDoubleVectorKey
| C++: static vtkInformationDoubleVectorKey *FIELD_RANGE()
|
| \ingroup InformationKeys
|
| GetActiveFieldInformation(...)
| GetActiveFieldInformation(info:vtkInformation,
| fieldAssociation:int, attributeType:int) -> vtkInformation
| C++: static vtkInformation *GetActiveFieldInformation(
| vtkInformation *info, int fieldAssociation, int attributeType)
|
| Return the information object within the input information
| object's field data corresponding to the specified association
| (FIELD_ASSOCIATION_POINTS or FIELD_ASSOCIATION_CELLS) and
| attribute (SCALARS, VECTORS, NORMALS, TCOORDS, or TENSORS)
|
| GetAssociationTypeAsString(...)
| GetAssociationTypeAsString(associationType:int) -> str
| C++: static const char *GetAssociationTypeAsString(
| int associationType)
|
| Given an integer association type, this static method returns a
| string type for the attribute (i.e. associationType = 0: returns
| "Points").
|
| GetAssociationTypeFromString(...)
| GetAssociationTypeFromString(associationName:str) -> int
| C++: static int GetAssociationTypeFromString(
| const char *associationName)
|
| Given a string association name, this static method returns an
| integer association type for the attribute (i.e. associationName
| = "Points": returns 0).
|
| GetAttributeTypeForArray(...)
| GetAttributeTypeForArray(self, arr:vtkAbstractArray) -> int
| C++: virtual int GetAttributeTypeForArray(vtkAbstractArray *arr)
|
| Retrieves the attribute type that an array came from. This is
| useful for obtaining which attribute type a input array to an
| algorithm came from (retrieved from
| GetInputAbstractArrayToProcesss).
|
| GetAttributes(...)
| GetAttributes(self, type:int) -> vtkDataSetAttributes
| C++: virtual vtkDataSetAttributes *GetAttributes(int type)
|
| Returns the attributes of the data object of the specified
| attribute type. The type may be: POINT - Defined in vtkDataSet
| subclasses. CELL - Defined in vtkDataSet subclasses. VERTEX -
| Defined in vtkGraph subclasses. EDGE - Defined in vtkGraph
| subclasses. ROW - Defined in vtkTable. The other attribute
| type, FIELD, will return nullptr since field data is stored as a
| vtkFieldData instance, not a vtkDataSetAttributes instance. To
| retrieve field data, use GetAttributesAsFieldData.
|
| @warning This method NEEDS to be
| overridden in subclasses to work as documented. If not, it
| returns nullptr for any type but FIELD.
|
| GetDataReleased(...)
| GetDataReleased(self) -> int
| C++: virtual vtkTypeBool GetDataReleased()
|
| Get the flag indicating the data has been released.
|
| GetFieldData(...)
| GetFieldData(self) -> vtkFieldData
| C++: virtual vtkFieldData *GetFieldData()
|
| GetGlobalReleaseDataFlag(...)
| GetGlobalReleaseDataFlag() -> int
| C++: static vtkTypeBool GetGlobalReleaseDataFlag()
|
| GetInformation(...)
| GetInformation(self) -> vtkInformation
| C++: virtual vtkInformation *GetInformation()
|
| Set/Get the information object associated with this data object.
|
| GetNamedFieldInformation(...)
| GetNamedFieldInformation(info:vtkInformation,
| fieldAssociation:int, name:str) -> vtkInformation
| C++: static vtkInformation *GetNamedFieldInformation(
| vtkInformation *info, int fieldAssociation, const char *name)
|
| Return the information object within the input information
| object's field data corresponding to the specified association
| (FIELD_ASSOCIATION_POINTS or FIELD_ASSOCIATION_CELLS) and name.
|
| GetUpdateTime(...)
| GetUpdateTime(self) -> int
| C++: vtkMTimeType GetUpdateTime()
|
| Used by Threaded ports to determine if they should initiate an
| asynchronous update (still in development).
|
| GlobalReleaseDataFlagOff(...)
| GlobalReleaseDataFlagOff(self) -> None
| C++: void GlobalReleaseDataFlagOff()
|
| GlobalReleaseDataFlagOn(...)
| GlobalReleaseDataFlagOn(self) -> None
| C++: void GlobalReleaseDataFlagOn()
|
| ORIGIN(...)
| ORIGIN() -> vtkInformationDoubleVectorKey
| C++: static vtkInformationDoubleVectorKey *ORIGIN()
|
| \ingroup InformationKeys
|
| PIECE_EXTENT(...)
| PIECE_EXTENT() -> vtkInformationIntegerVectorKey
| C++: static vtkInformationIntegerVectorKey *PIECE_EXTENT()
|
| \ingroup InformationKeys
|
| POINT_DATA_VECTOR(...)
| POINT_DATA_VECTOR() -> vtkInformationInformationVectorKey
| C++: static vtkInformationInformationVectorKey *POINT_DATA_VECTOR(
| )
|
| \ingroup InformationKeys
|
| ReleaseData(...)
| ReleaseData(self) -> None
| C++: void ReleaseData()
|
| Release data back to system to conserve memory resource. Used
| during visualization network execution. Releasing this data does
| not make down-stream data invalid.
|
| RemoveNamedFieldInformation(...)
| RemoveNamedFieldInformation(info:vtkInformation,
| fieldAssociation:int, name:str) -> None
| C++: static void RemoveNamedFieldInformation(vtkInformation *info,
| int fieldAssociation, const char *name)
|
| Remove the info associated with an array
|
| SIL(...)
| SIL() -> vtkInformationDataObjectKey
| C++: static vtkInformationDataObjectKey *SIL()
|
| \ingroup InformationKeys
|
| SPACING(...)
| SPACING() -> vtkInformationDoubleVectorKey
| C++: static vtkInformationDoubleVectorKey *SPACING()
|
| \ingroup InformationKeys
|
| SetActiveAttribute(...)
| SetActiveAttribute(info:vtkInformation, fieldAssociation:int,
| attributeName:str, attributeType:int) -> vtkInformation
| C++: static vtkInformation *SetActiveAttribute(
| vtkInformation *info, int fieldAssociation,
| const char *attributeName, int attributeType)
|
| Set the named array to be the active field for the specified type
| (SCALARS, VECTORS, NORMALS, TCOORDS, or TENSORS) and association
| (FIELD_ASSOCIATION_POINTS or FIELD_ASSOCIATION_CELLS). Returns
| the active field information object and creates on entry if one
| not found.
|
| SetActiveAttributeInfo(...)
| SetActiveAttributeInfo(info:vtkInformation, fieldAssociation:int,
| attributeType:int, name:str, arrayType:int, numComponents:int,
| numTuples:int) -> None
| C++: static void SetActiveAttributeInfo(vtkInformation *info,
| int fieldAssociation, int attributeType, const char *name,
| int arrayType, int numComponents, int numTuples)
|
| Set the name, array type, number of components, and number of
| tuples within the passed information object for the active
| attribute of type attributeType (in specified association,
| FIELD_ASSOCIATION_POINTS or FIELD_ASSOCIATION_CELLS). If there
| is not an active attribute of the specified type, an entry in the
| information object is created. If arrayType, numComponents, or
| numTuples equal to -1, or name=nullptr the value is not changed.
|
| SetFieldData(...)
| SetFieldData(self, __a:vtkFieldData) -> None
| C++: virtual void SetFieldData(vtkFieldData *)
|
| Assign or retrieve a general field data to this data object.
|
| SetGlobalReleaseDataFlag(...)
| SetGlobalReleaseDataFlag(val:int) -> None
| C++: static void SetGlobalReleaseDataFlag(vtkTypeBool val)
|
| Turn on/off flag to control whether every object releases its
| data after being used by a filter.
|
| SetInformation(...)
| SetInformation(self, __a:vtkInformation) -> None
| C++: virtual void SetInformation(vtkInformation *)
|
| SetPointDataActiveScalarInfo(...)
| SetPointDataActiveScalarInfo(info:vtkInformation, arrayType:int,
| numComponents:int) -> None
| C++: static void SetPointDataActiveScalarInfo(
| vtkInformation *info, int arrayType, int numComponents)
|
| Convenience version of previous method for use (primarily) by the
| Imaging filters. If arrayType or numComponents == -1, the value
| is not changed.
|
| VERTEX_DATA_VECTOR(...)
| VERTEX_DATA_VECTOR() -> vtkInformationInformationVectorKey
| C++: static vtkInformationInformationVectorKey *VERTEX_DATA_VECTOR(
| )
|
| \ingroup InformationKeys
|
| __rrshift__(self, value, /)
| Return value>>self.
|
| __rshift__(self, value, /)
| Return self>>value.
|
| ----------------------------------------------------------------------
| Data descriptors inherited from vtkmodules.vtkCommonDataModel.vtkDataObject:
|
| data_released
| read-only, calls GetDataReleased
|
| global_release_data_flag
| read-write, calls GetGlobalReleaseDataFlag/SetGlobalReleaseDataFlag
|
| information
| read-write, calls GetInformation/SetInformation
|
| update_time
| read-only, calls GetUpdateTime
|
| ----------------------------------------------------------------------
| Data and other attributes inherited from vtkmodules.vtkCommonDataModel.vtkDataObject:
|
| AttributeTypes = <class 'vtkmodules.vtkCommonDataModel.vtkDataObject.A...
|
| CELL = 1
|
| EDGE = 5
|
| FIELD = 2
|
| FIELD_ASSOCIATION_CELLS = 1
|
| FIELD_ASSOCIATION_EDGES = 5
|
| FIELD_ASSOCIATION_NONE = 2
|
| FIELD_ASSOCIATION_POINTS = 0
|
| FIELD_ASSOCIATION_POINTS_THEN_CELLS = 3
|
| FIELD_ASSOCIATION_ROWS = 6
|
| FIELD_ASSOCIATION_VERTICES = 4
|
| FIELD_OPERATION_MODIFIED = 2
|
| FIELD_OPERATION_PRESERVED = 0
|
| FIELD_OPERATION_REINTERPOLATED = 1
|
| FIELD_OPERATION_REMOVED = 3
|
| FieldAssociations = <class 'vtkmodules.vtkCommonDataModel.vtkDataObjec...
|
| FieldOperations = <class 'vtkmodules.vtkCommonDataModel.vtkDataObject....
|
| NUMBER_OF_ASSOCIATIONS = 7
|
| NUMBER_OF_ATTRIBUTE_TYPES = 7
|
| POINT = 0
|
| POINT_THEN_CELL = 3
|
| ROW = 6
|
| VERTEX = 4
|
| ----------------------------------------------------------------------
| Methods inherited from vtkmodules.vtkCommonCore.vtkObject:
|
| AddObserver(...)
| AddObserver(self, event:int, command:Callback, priority:float=0.0) -> int
| C++: unsigned long AddObserver(const char* event,
| vtkCommand* command, float priority=0.0f)
|
| Add an event callback command(o:vtkObject, event:int) for an event type.
| Returns a handle that can be used with RemoveEvent(event:int).
|
| BreakOnError(...)
| BreakOnError() -> None
| C++: static void BreakOnError()
|
| This method is called when vtkErrorMacro executes. It allows the
| debugger to break on error.
|
| DebugOff(...)
| DebugOff(self) -> None
| C++: virtual void DebugOff()
|
| Turn debugging output off.
|
| DebugOn(...)
| DebugOn(self) -> None
| C++: virtual void DebugOn()
|
| Turn debugging output on.
|
| GetCommand(...)
| GetCommand(self, tag:int) -> vtkCommand
| C++: vtkCommand *GetCommand(unsigned long tag)
|
| GetDebug(...)
| GetDebug(self) -> bool
| C++: bool GetDebug()
|
| Get the value of the debug flag.
|
| GetGlobalWarningDisplay(...)
| GetGlobalWarningDisplay() -> int
| C++: static vtkTypeBool GetGlobalWarningDisplay()
|
| GetObjectDescription(...)
| GetObjectDescription(self) -> str
| C++: std::string GetObjectDescription() override;
|
| The object description printed in messages and PrintSelf output.
| To be used only for reporting purposes.
|
| GetObjectName(...)
| GetObjectName(self) -> str
| C++: virtual std::string GetObjectName()
|
| GlobalWarningDisplayOff(...)
| GlobalWarningDisplayOff() -> None
| C++: static void GlobalWarningDisplayOff()
|
| GlobalWarningDisplayOn(...)
| GlobalWarningDisplayOn() -> None
| C++: static void GlobalWarningDisplayOn()
|
| HasObserver(...)
| HasObserver(self, event:int, __b:vtkCommand) -> int
| C++: vtkTypeBool HasObserver(unsigned long event, vtkCommand *)
| HasObserver(self, event:str, __b:vtkCommand) -> int
| C++: vtkTypeBool HasObserver(const char *event, vtkCommand *)
| HasObserver(self, event:int) -> int
| C++: vtkTypeBool HasObserver(unsigned long event)
| HasObserver(self, event:str) -> int
| C++: vtkTypeBool HasObserver(const char *event)
|
| InvokeEvent(...)
| InvokeEvent(self, event:int, callData:Any) -> int
| C++: int InvokeEvent(unsigned long event, void* callData)
| InvokeEvent(self, event:str, callData:Any) -> int
| C++: int InvokeEvent(const char* event, void* callData)
| InvokeEvent(self, event:int) -> int
| C++: int InvokeEvent(unsigned long event)
| InvokeEvent(self, event:str) -> int
| C++: int InvokeEvent(const char* event)
|
| This method invokes an event and returns whether the event was
| aborted or not. If the event was aborted, the return value is 1,
| otherwise it is 0.
|
| Modified(...)
| Modified(self) -> None
| C++: virtual void Modified()
|
| Update the modification time for this object. Many filters rely
| on the modification time to determine if they need to recompute
| their data. The modification time is a unique monotonically
| increasing unsigned long integer.
|
| RemoveAllObservers(...)
| RemoveAllObservers(self) -> None
| C++: void RemoveAllObservers()
|
| RemoveObserver(...)
| RemoveObserver(self, __a:vtkCommand) -> None
| C++: void RemoveObserver(vtkCommand *)
| RemoveObserver(self, tag:int) -> None
| C++: void RemoveObserver(unsigned long tag)
|
| RemoveObservers(...)
| RemoveObservers(self, event:int, __b:vtkCommand) -> None
| C++: void RemoveObservers(unsigned long event, vtkCommand *)
| RemoveObservers(self, event:str, __b:vtkCommand) -> None
| C++: void RemoveObservers(const char *event, vtkCommand *)
| RemoveObservers(self, event:int) -> None
| C++: void RemoveObservers(unsigned long event)
| RemoveObservers(self, event:str) -> None
| C++: void RemoveObservers(const char *event)
|
| SetDebug(...)
| SetDebug(self, debugFlag:bool) -> None
| C++: void SetDebug(bool debugFlag)
|
| Set the value of the debug flag. A true value turns debugging on.
|
| SetGlobalWarningDisplay(...)
| SetGlobalWarningDisplay(val:int) -> None
| C++: static void SetGlobalWarningDisplay(vtkTypeBool val)
|
| This is a global flag that controls whether any debug, warning or
| error messages are displayed.
|
| SetObjectName(...)
| SetObjectName(self, objectName:str) -> None
| C++: virtual void SetObjectName(const std::string &objectName)
|
| Set/get the name of this object for reporting purposes. The name
| appears in warning and debug messages and in the Print output.
| Setting the object name does not change the MTime and does not
| invoke a ModifiedEvent. Derived classes implementing copying
| methods are expected not to copy the ObjectName.
|
| ----------------------------------------------------------------------
| Data descriptors inherited from vtkmodules.vtkCommonCore.vtkObject:
|
| debug
| read-write, calls GetDebug/SetDebug
|
| global_warning_display
| read-write, calls GetGlobalWarningDisplay/SetGlobalWarningDisplay
|
| object_description
| read-only, calls GetObjectDescription
|
| object_name
| read-write, calls GetObjectName/SetObjectName
|
| ----------------------------------------------------------------------
| Methods inherited from vtkmodules.vtkCommonCore.vtkObjectBase:
|
| FastDelete(...)
| FastDelete(self) -> None
| C++: virtual void FastDelete()
|
| Delete a reference to this object. This version will not invoke
| garbage collection and can potentially leak the object if it is
| part of a reference loop. Use this method only when it is known
| that the object has another reference and would not be collected
| if a full garbage collection check were done.
|
| GetAddressAsString(...)
| GetAddressAsString(self, classname:str) -> str
|
| Get address of C++ object in format 'Addr=%p' after casting to
| the specified type. This method is obsolete, you can get the
| same information from o.__this__.
|
| GetClassName(...)
| GetClassName(self) -> str
| C++: const char *GetClassName()
|
| Return the class name as a string.
|
| GetIsInMemkind(...)
| GetIsInMemkind(self) -> bool
| C++: bool GetIsInMemkind()
|
| A local state flag that remembers whether this object lives in
| the normal or extended memory space.
|
| GetReferenceCount(...)
| GetReferenceCount(self) -> int
| C++: int GetReferenceCount()
|
| Return the current reference count of this object.
|
| GetUsingMemkind(...)
| GetUsingMemkind() -> bool
| C++: static bool GetUsingMemkind()
|
| A global state flag that controls whether vtkObjects are
| constructed in the usual way (the default) or within the extended
| memory space.
|
| InitializeObjectBase(...)
| InitializeObjectBase(self) -> None
| C++: void InitializeObjectBase()
|
| Register(...)
| Register(self, o:vtkObjectBase)
| C++: virtual void Register(vtkObjectBase *o)
|
| Increase the reference count by 1.
|
| SetMemkindDirectory(...)
| SetMemkindDirectory(directoryname:str) -> None
| C++: static void SetMemkindDirectory(const char *directoryname)
|
| The name of a directory, ideally mounted -o dax, to memory map an
| extended memory space within. This must be called before any
| objects are constructed in the extended space. It can not be
| changed once setup.
|
| SetReferenceCount(...)
| SetReferenceCount(self, __a:int) -> None
| C++: void SetReferenceCount(int)
|
| Sets the reference count. (This is very dangerous, use with
| care.)
|
| UnRegister(...)
| UnRegister(self, o:vtkObjectBase)
| C++: virtual void UnRegister(vtkObjectBase* o)
|
| Decrease the reference count (release by another object). This
| has the same effect as invoking Delete() (i.e., it reduces the
| reference count by 1).
|
| UsesGarbageCollector(...)
| UsesGarbageCollector(self) -> bool
| C++: virtual bool UsesGarbageCollector()
|
| Indicate whether the class uses `vtkGarbageCollector` or not.
|
| Most classes will not need to do this, but if the class
| participates in a strongly-connected reference count cycle,
| participation can resolve these cycles.
|
| If overriding this method to return true, the `ReportReferences`
| method should be overridden to report references that may be in
| cycles.
|
| ----------------------------------------------------------------------
| Class methods inherited from vtkmodules.vtkCommonCore.vtkObjectBase:
|
| override(...)
| This method can be used to override a VTK class with a Python subclass.
| The class type passed to override will afterwards be instantiated
| instead of the type override is called on.
| For example,
|
| class foo(vtk.vtkPoints):
| pass
| vtk.vtkPoints.override(foo)
|
| will lead to foo being instantied every time vtkPoints() is called.
| The main objective of this functionality is to enable developers to
| extend VTK classes with more pythonic subclasses that contain
| convenience functionality.
|
| ----------------------------------------------------------------------
| Data descriptors inherited from vtkmodules.vtkCommonCore.vtkObjectBase:
|
| class_name
| read-only, calls GetClassName
|
| is_in_memkind
| read-only, calls GetIsInMemkind
|
| memkind_directory
| write-only, calls SetMemkindDirectory
|
| reference_count
| read-write, calls GetReferenceCount/SetReferenceCount
|
| using_memkind
| read-only, calls GetUsingMemkind
Generate example 3D data using numpy.random.random(). Feel free to use
your own 3D numpy array here.
arr = np.random.random((100, 100, 100))
arr.shape
(100, 100, 100)
Create the pyvista.ImageData.
Note
You will likely need to ravel the array with Fortran-ordering:
arr.ravel(order="F")
vol = pv.ImageData()
vol.dimensions = arr.shape
vol["array"] = arr.ravel(order="F")
Plot the ImageData
vol.plot()
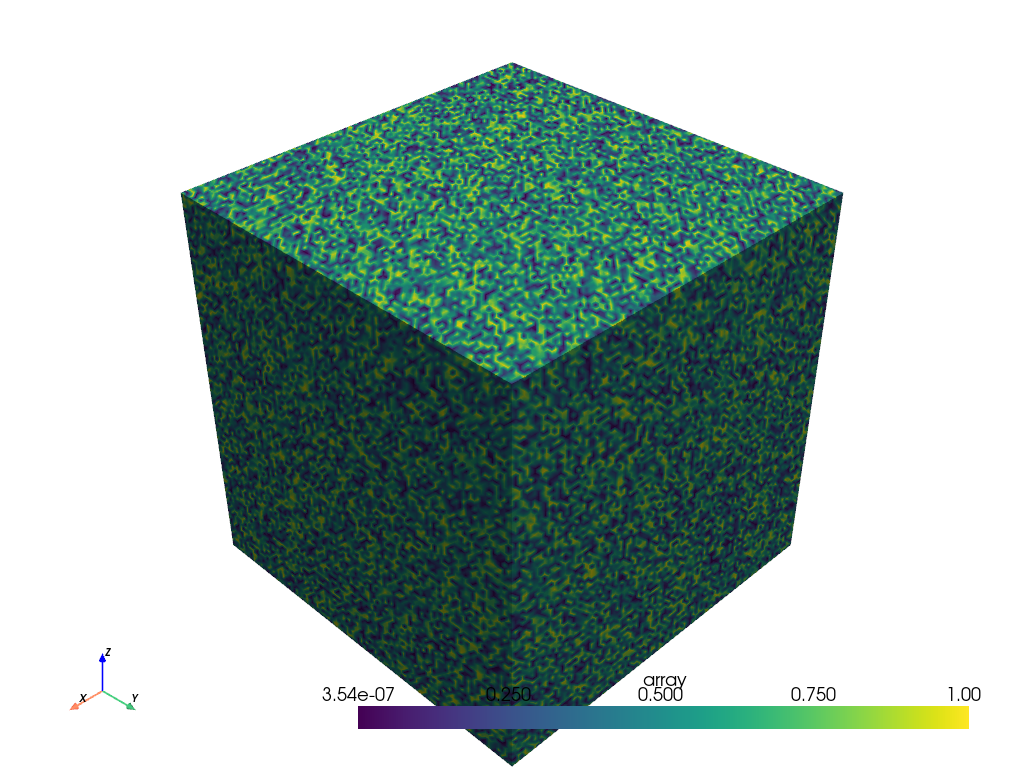
Example#
PyVista has several examples that use ImageData.
See the PyVista documentation for further details on Volume Rendering
Here’s one of these example datasets:
from pyvista import examples

vol = examples.download_knee_full()

pl = pv.Plotter()
pl.add_volume(vol, cmap="bone", opacity="sigmoid")
pl.show()
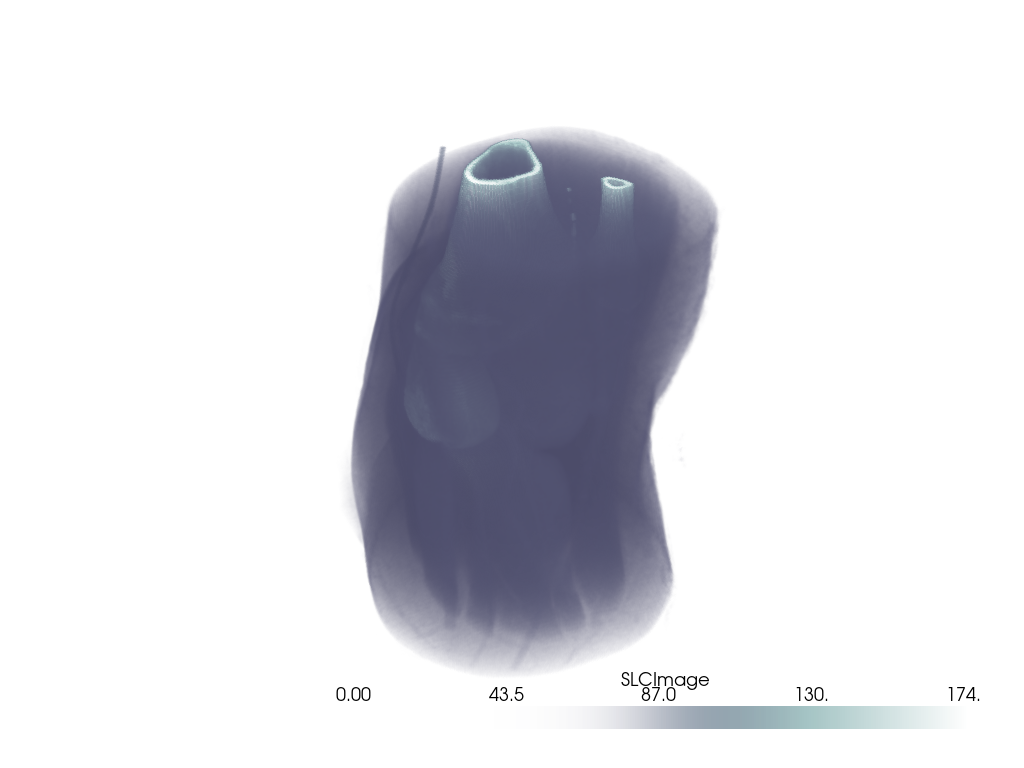
vol = pv.Wavelet()
vol.plot(volume=True)
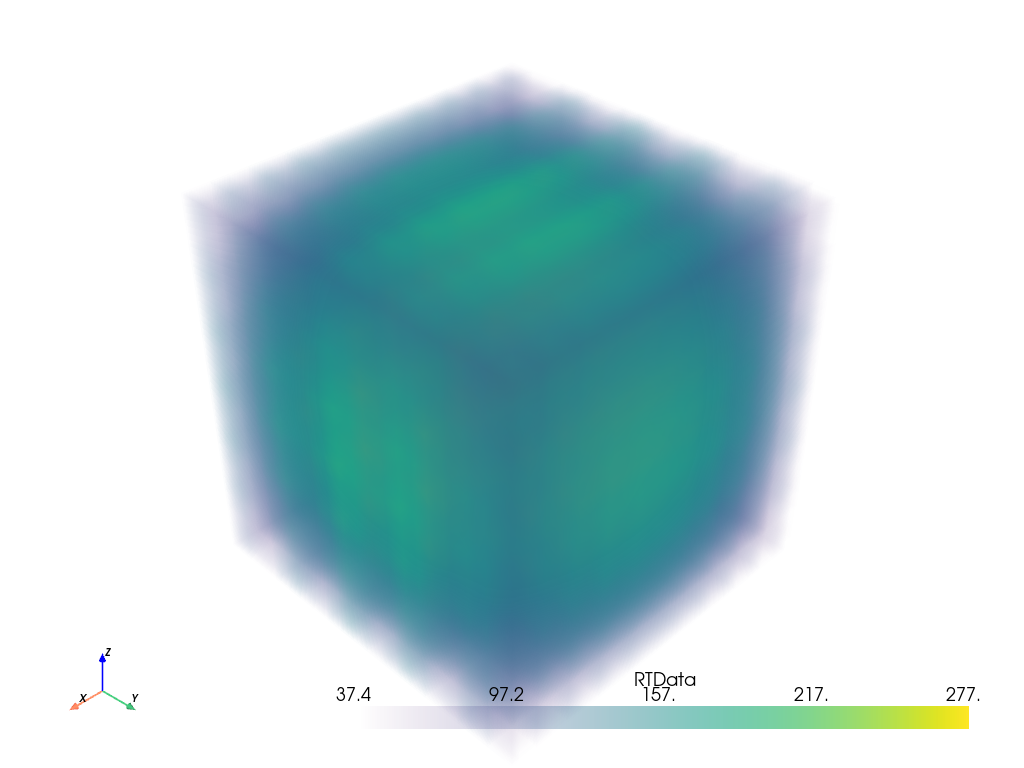
Total running time of the script: (0 minutes 5.452 seconds)