Note
Go to the end to download the full example code. or to run this example in your browser via Binder
Label Points#
Use string arrays in a point set to label points
import numpy as np
import pyvista as pv
from pyvista import examples
The pyvista.Plotter.add_point_labels() method makes it easy to add
point labels to a scene.
Help on function add_point_labels in module pyvista.plotting.plotter:

add_point_labels(self, points: 'MatrixLike[float] | VectorLike[float] | DataSet | _vtk.vtkAlgorithm', labels: 'Sequence[str | int] | str', italic: 'bool' = False, bold: 'bool' = True, font_size: 'int | None' = None, text_color: 'ColorLike | None' = None, font_family: 'FontFamilyOptions | None' = None, font_file: 'str | None' = None, shadow: 'bool' = False, show_points: 'bool' = True, point_color: 'ColorLike | None' = None, point_size: 'float | None' = None, name: 'str | None' = None, shape_color: 'ColorLike' = 'grey', shape: "Literal['rect', 'rounded_rect'] | None" = 'rounded_rect', fill_shape: 'bool' = True, margin: 'int' = 3, shape_opacity: 'float' = 1.0, pickable: 'bool' = False, render_points_as_spheres: 'bool' = False, tolerance: 'float' = 0.001, reset_camera: 'bool | None' = None, always_visible: 'bool' = False, render: 'bool' = True, justification_horizontal: 'HorizontalOptions | None' = None, justification_vertical: 'VerticalOptions | None' = None, background_color: 'ColorLike | None' = None, background_opacity: 'float | None' = None) -> '_vtk.vtkActor2D'
    Create a point actor with one label from list labels assigned to each point.

    Parameters
    ----------
    points : sequence | DataSet | :vtk:`vtkAlgorithm`
        An ``n x 3`` sequence points or :class:`pyvista.DataSet` with
        points or mesh-producing algorithm.

    labels : list | str
        List of labels.  Must be the same length as points. If a
        string name is given with a :class:`pyvista.DataSet` input for
        points, then these are fetched.

    italic : bool, default: False
        Italicises title and bar labels.

    bold : bool, default: True
        Bolds title and bar labels.

    font_size : float, optional
        Sets the size of the title font.

    text_color : ColorLike, optional
        Color of text. Either a string, RGB sequence, or hex color string.

        * ``text_color='white'``
        * ``text_color='w'``
        * ``text_color=[1.0, 1.0, 1.0]``
        * ``text_color='#FFFFFF'``

    font_family : str, optional
        Font family.  Must be either ``'courier'``, ``'times'``,
        or ``'arial``. This is ignored if the `font_file` is set.

    font_file : str, default: None
        The absolute file path to a local file containing a freetype
        readable font.

    shadow : bool, default: False
        Adds a black shadow to the text.

    show_points : bool, default: True
        Controls if points are visible.

    point_color : ColorLike, optional
        Either a string, rgb list, or hex color string.  One of
        the following.

        * ``point_color='white'``
        * ``point_color='w'``
        * ``point_color=[1.0, 1.0, 1.0]``
        * ``point_color='#FFFFFF'``

    point_size : float, optional
        Size of points if visible.

    name : str, optional
        The name for the added actor so that it can be easily
        updated.  If an actor of this name already exists in the
        rendering window, it will be replaced by the new actor.

    shape_color : ColorLike, default: "grey"
        Color of shape (if visible).  Either a string, rgb
        sequence, or hex color string.

    shape : str, default: "rounded_rect"
        The string name of the shape to use. Options are ``'rect'`` or
        ``'rounded_rect'``. If you want no shape, pass ``None``.

    fill_shape : bool, default: True
        Fill the shape with the ``shape_color``. Outlines if ``False``.

    margin : int, default: 3
        The size of the margin on the label background shape.

    shape_opacity : float, default: 1.0
        The opacity of the shape in the range of ``[0, 1]``.

    pickable : bool, default: False
        Set whether this actor is pickable.

    render_points_as_spheres : bool, default: False
        Render points as spheres rather than dots.

    tolerance : float, default: 0.001
        A tolerance to use to determine whether a point label is
        visible.  A tolerance is usually required because the
        conversion from world space to display space during
        rendering introduces numerical round-off.

    reset_camera : bool, optional
        Reset the camera after adding the points to the scene.

    always_visible : bool, default: False
        Skip adding the visibility filter.

    render : bool, default: True
        Force a render when ``True``.

    justification_horizontal : str, optional
        Text's horizontal justification.
        Should be either "left", "center" or "right".

        .. warning::
            If the justification is not default,
            the shape will be out of alignment with the label.
            If you use other than default,
            Please use the background color.
            See: https://github.com/pyvista/pyvista/pull/5407

    justification_vertical : str, optional
        Text's vertical justification.
        Should be either "bottom", "center" or "top".

        .. warning::
            If the justification is not default,
            the shape will be out of alignment with the label.
            If you use other than default,
            Please use the background color.
            See: https://github.com/pyvista/pyvista/pull/5407

    background_color : Color, optional
        Background color of text's property.

    background_opacity : float, optional
        Background opacity of text's property.

    Returns
    -------
    :vtk:`vtkActor2D`
        VTK label actor.  Can be used to change properties of the labels.

    See Also
    --------
    :ref:`point_labels_example`

    Examples
    --------
    >>> import numpy as np
    >>> import pyvista as pv
    >>> pl = pv.Plotter()
    >>> points = np.array([[0.0, 0.0, 0.0], [1.0, 1.0, 0.0], [2.0, 0.0, 0.0]])
    >>> labels = ['Point A', 'Point B', 'Point C']
    >>> actor = pl.add_point_labels(
    ...     points,
    ...     labels,
    ...     italic=True,
    ...     font_size=20,
    ...     point_color='red',
    ...     point_size=20,
    ...     render_points_as_spheres=True,
    ...     always_visible=True,
    ...     shadow=True,
    ... )
    >>> pl.camera_position = 'xy'
    >>> pl.show()
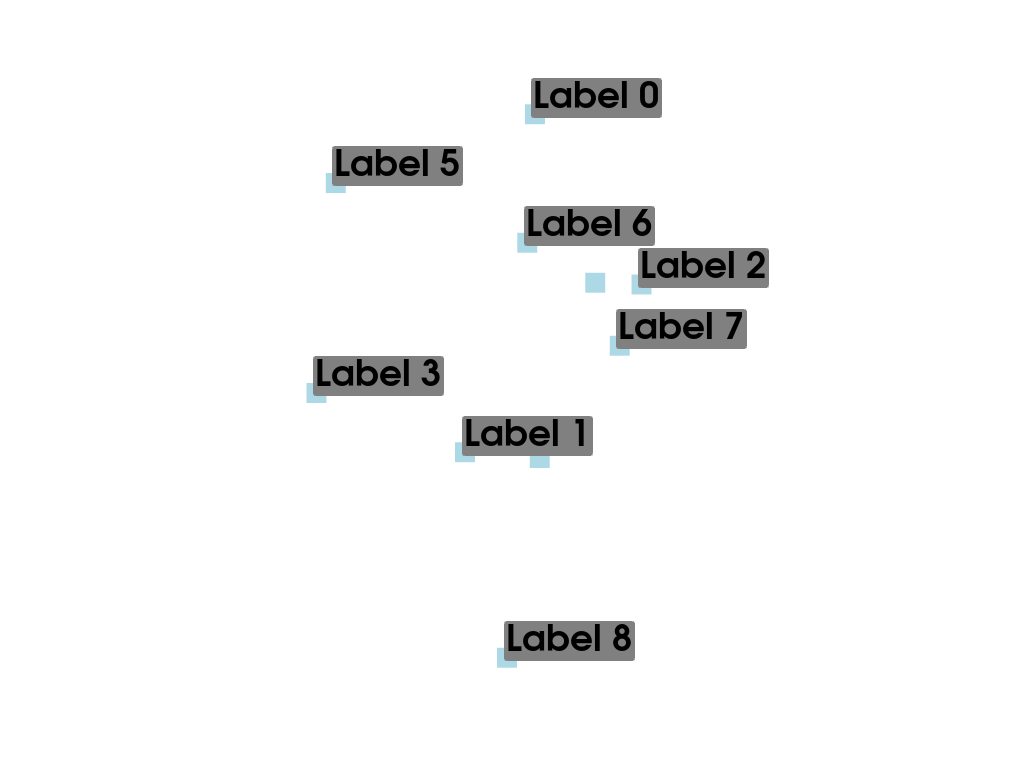
Label Point Cloud#
Let’s make a random point cloud and label each point in 3D space
# Make some random points
poly = pv.PolyData(np.random.rand(10, 3))
Add string labels to the point data - this associates a label with every node:
poly["My Labels"] = [f"Label {i}" for i in range(poly.n_points)]
poly
Now plot the points with labels using pyvista.Plotter.add_point_labels()
# (your code here, answer below)
plotter = pv.Plotter()
plotter.add_point_labels(poly, "My Labels", point_size=20, font_size=36)
plotter.show()
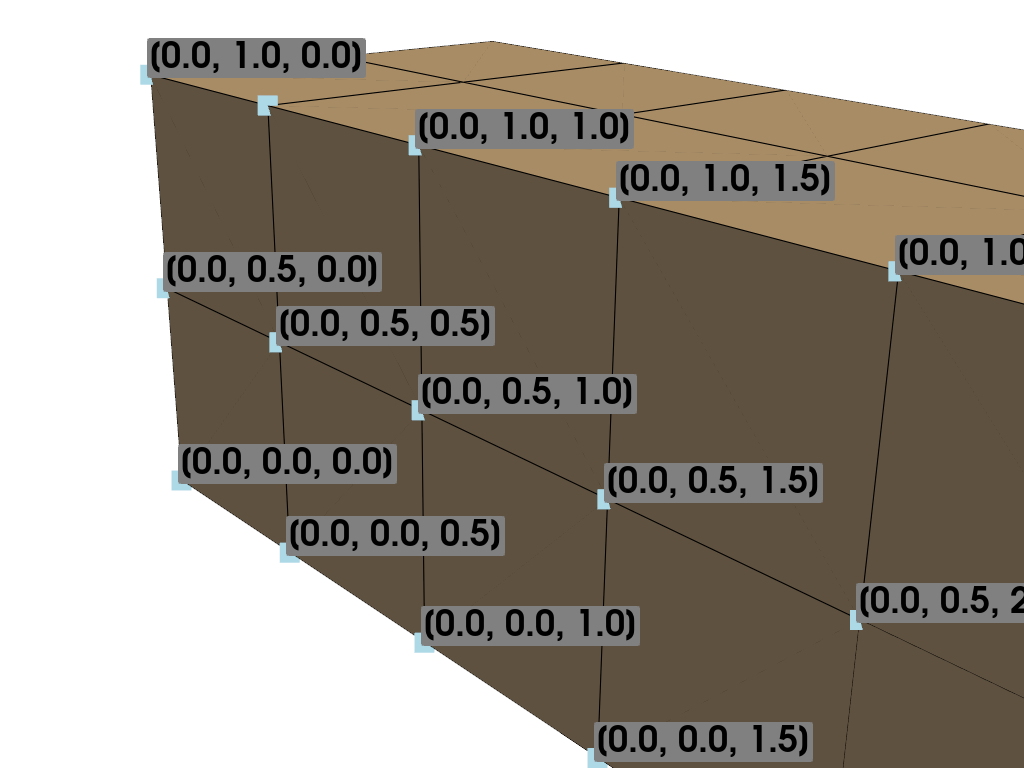
Label Node Locations#
This example will label the nodes of a mesh with their coordinate locations
# Load example beam file
grid = pv.UnstructuredGrid(examples.hexbeamfile)
Create plotting class and add the unstructured grid
plotter = pv.Plotter()
plotter.add_mesh(grid, show_edges=True, color="tan")

# Add labels to points on the yz plane (where x == 0)
points = grid.points
mask = points[:, 0] == 0
plotter.add_point_labels(points[mask], points[mask].tolist(), point_size=20, font_size=36)

plotter.camera_position = [(-1.5, 1.5, 3.0), (0.05, 0.6, 1.2), (0.2, 0.9, -0.25)]

plotter.show()
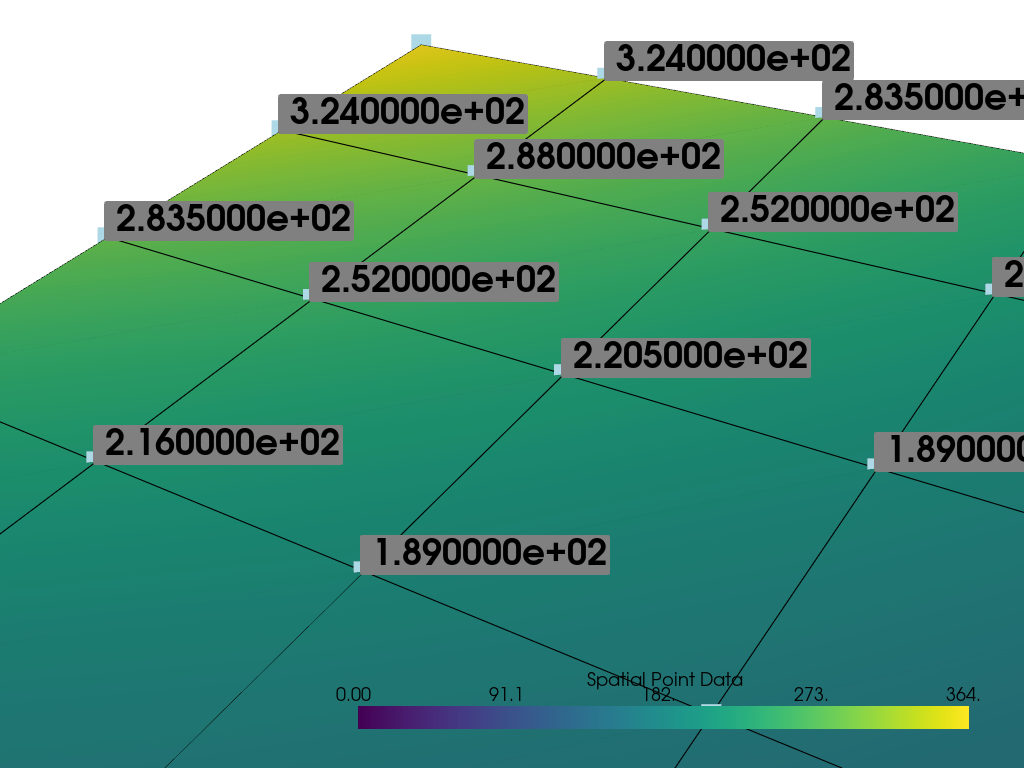
Label Scalar Values#
This example will label each point with their scalar values
mesh = examples.load_uniform().slice()
pl = pv.Plotter()

# Add the mesh:
pl.add_mesh(mesh, scalars="Spatial Point Data", show_edges=True)
# Add the points with scalar labels:
pl.add_point_scalar_labels(mesh, "Spatial Point Data", point_size=20, font_size=36)

# Use a nice camera position:
pl.camera_position = [(7, 4, 5), (4.4, 7.0, 7.2), (0.8, 0.5, 0.25)]

pl.show()
Total running time of the script: (0 minutes 0.524 seconds)