Note
Go to the end to download the full example code. or to run this example in your browser via Binder
Clipping with Planes & Boxes#
Clip/cut any dataset using using planes or boxes.
import pyvista as pv
from pyvista import examples
Clip with Plane#
Clip any dataset by a user defined plane using the
pyvista.DataSetFilters.clip() filter
help(dataset.clip)
Help on method clip in module pyvista.core.filters.data_object:

clip(normal: 'VectorLike[float] | _NormalsLiteral | None' = None, origin: 'VectorLike[float] | None' = None, invert: 'bool' = True, value: 'float' = 0.0, inplace: 'bool' = False, return_clipped: 'bool' = False, progress_bar: 'bool' = False, crinkle: 'bool' = False, plane: 'PolyData | None' = None) method of pyvista.core.pointset.PolyData instance
    Clip a dataset by a plane by specifying the origin and normal.

    The origin and normal may be set explicitly or implicitly using a
    :func:`~pyvista.Plane`.

    If no parameters are given, the clip will occur in the center
    of the dataset along the x-axis.

    Parameters
    ----------
    normal : VectorLike[float] | str, optional
        Length-3 vector for the normal vector direction. Can also
        be specified as a string conventional direction such as
        ``'x'`` for ``(1, 0, 0)`` or ``'-x'`` for ``(-1, 0, 0)``, etc.
        The ``'x'`` direction is used by default.

    origin : VectorLike[float], optional
        The center ``(x, y, z)`` coordinate of the plane on which the clip
        occurs. The default is the center of the dataset.

    invert : bool, default: True
        If ``True``, remove mesh parts in the ``normal`` direction from ``origin``.
        If ``False``, remove parts in the opposite direction.

    value : float, default: 0.0
        Set the clipping value along the normal direction.

    inplace : bool, default: False
        Updates mesh in-place.

    return_clipped : bool, default: False
        Return both unclipped and clipped parts of the dataset.

    progress_bar : bool, default: False
        Display a progress bar to indicate progress.

    crinkle : bool, default: False
        Crinkle the clip by extracting the entire cells along the
        clip. This adds the ``"cell_ids"`` array to the ``cell_data``
        attribute that tracks the original cell IDs of the original
        dataset.

    plane : PolyData, optional
        :func:`~pyvista.Plane` mesh to use for clipping. Use this as an
        alternative to setting ``origin`` and ``normal``. The mean of the
        plane's normal vectors is used for the ``normal`` parameter and
        the mean of the plane's points is used for the ``origin`` parameter.

        .. versionadded:: 0.47

    Returns
    -------
    output : DataSet | MultiBlock | tuple[DataSet | MultiBlock, DataSet | MultiBlock]
        Clipped mesh when ``return_clipped=False`` or a tuple containing the
        unclipped and clipped meshes. Output mesh type matches input type for
        :class:`~pyvista.PointSet`, :class:`~pyvista.PolyData`, and
        :class:`~pyvista.MultiBlock`; otherwise the output type is
        :class:`~pyvista.UnstructuredGrid`.

    Examples
    --------
    Clip a cube along the +X direction.  ``triangulate`` is used as
    the cube is initially composed of quadrilateral faces and
    subdivide only works on triangles.

    >>> import pyvista as pv
    >>> cube = pv.Cube().triangulate().subdivide(3)
    >>> clipped_cube = cube.clip()
    >>> clipped_cube.plot()

    Clip a cube in the +Z direction.  This leaves half a cube
    below the XY plane.

    >>> import pyvista as pv
    >>> cube = pv.Cube().triangulate().subdivide(3)
    >>> clipped_cube = cube.clip('z')
    >>> clipped_cube.plot()

    See :ref:`clip_with_surface_example` for more examples using this filter.
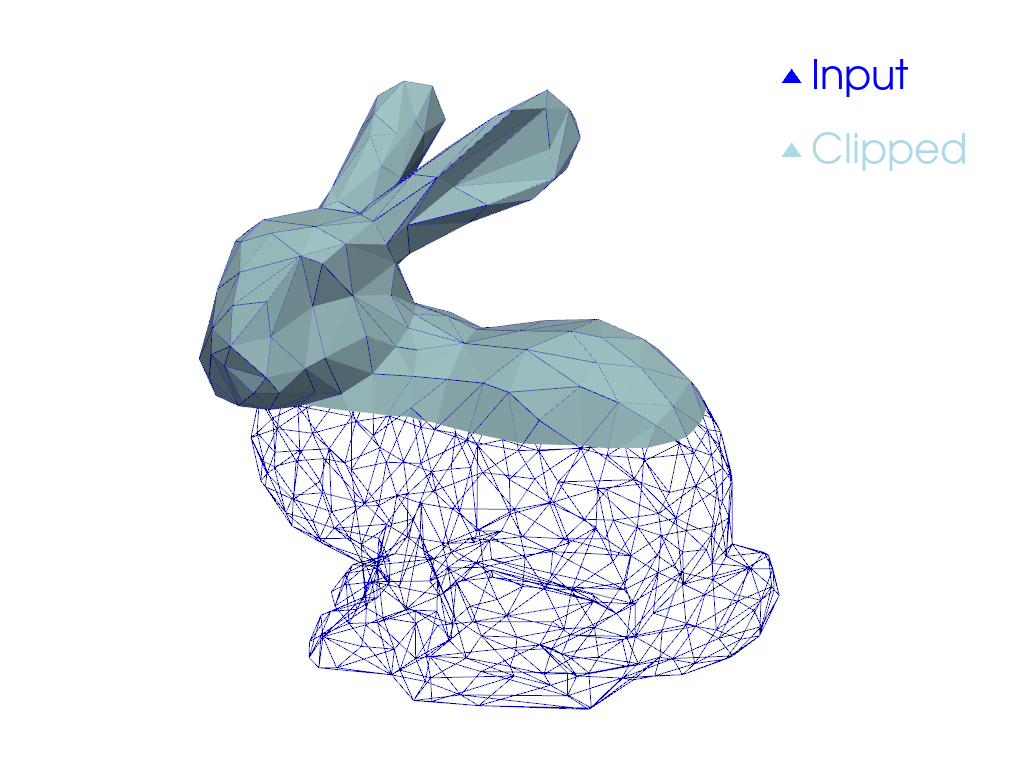
Perform a clip with a Y axis normal
clipped = dataset.clip("y", invert=False)
clipped
Plot the result.
pl = pv.Plotter()
pl.add_mesh(dataset, style="wireframe", color="blue", label="Input")
pl.add_mesh(clipped, label="Clipped")
pl.add_legend()
pl.camera_position = [(0.24, 0.32, 0.7), (0.02, 0.03, -0.02), (-0.12, 0.93, -0.34)]
pl.show()
Clip with Bounds#
Clip any dataset by a set of XYZ bounds using the
pyvista.DataSetFilters.clip_box() filter.
First, download an example dataset.
dataset = examples.download_office()
help(dataset.clip_box)
Help on method clip_box in module pyvista.core.filters.data_object:

clip_box(bounds: 'float | VectorLike[float] | PolyData | None' = None, invert: 'bool' = True, factor: 'float' = 0.35, progress_bar: 'bool' = False, merge_points: 'bool' = True, crinkle: 'bool' = False) method of pyvista.core.pointset.StructuredGrid instance
    Clip a dataset by a bounding box defined by the bounds.

    If no bounds are given, a corner of the dataset bounds will be removed.

    Parameters
    ----------
    bounds : sequence[float], optional
        Length 6 sequence of floats: ``(x_min, x_max, y_min, y_max, z_min, z_max)``.
        Length 3 sequence of floats: distances from the min coordinate of
        of the input mesh. Single float value: uniform distance from the
        min coordinate. Length 12 sequence of length 3 sequence of floats:
        a plane collection (normal, center, ...).
        :class:`pyvista.PolyData`: if a poly mesh is passed that represents
        a box with 6 faces that all form a standard box, then planes will
        be extracted from the box to define the clipping region.

    invert : bool, default: True
        Flag on whether to flip/invert the clip.

    factor : float, default: 0.35
        If bounds are not given this is the factor along each axis to
        extract the default box.

    progress_bar : bool, default: False
        Display a progress bar to indicate progress.

    merge_points : bool, default: True
        If ``True``, coinciding points of independently defined mesh
        elements will be merged.

    crinkle : bool, default: False
        Crinkle the clip by extracting the entire cells along the
        clip. This adds the ``"cell_ids"`` array to the ``cell_data``
        attribute that tracks the original cell IDs of the original
        dataset.

    Returns
    -------
    pyvista.UnstructuredGrid
        Clipped dataset.

    Examples
    --------
    Clip a corner of a cube.  The bounds of a cube are normally
    ``[-0.5, 0.5, -0.5, 0.5, -0.5, 0.5]``, and this removes 1/8 of
    the cube's surface.

    >>> import pyvista as pv
    >>> cube = pv.Cube().triangulate().subdivide(3)
    >>> clipped_cube = cube.clip_box([0, 1, 0, 1, 0, 1])
    >>> clipped_cube.plot()

    See :ref:`clip_with_plane_box_example` for more examples using this filter.
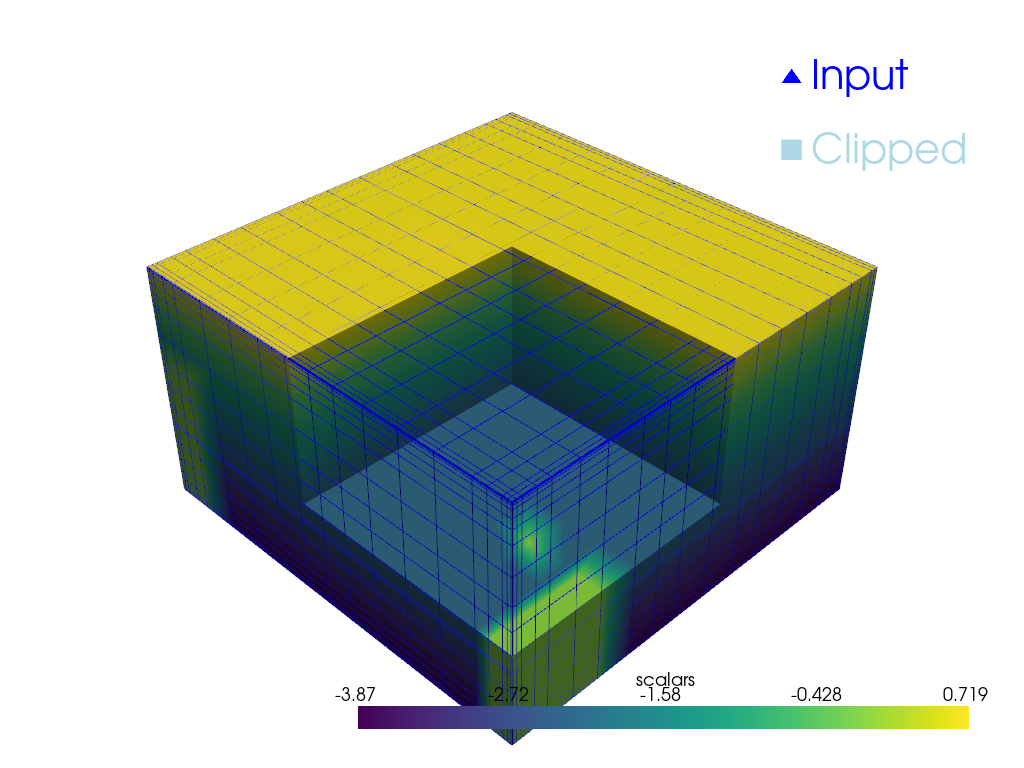
Clip the dataset with a bounding box defined by the values in bounds
(xmin, xmax, ymin, ymax, zmin, zmax)
bounds = [2, 4.5, 2, 4.5, 1, 3]
clipped = dataset.clip_box(bounds)
clipped
Plot the original dataset and the clipped one.
pl = pv.Plotter()
pl.add_mesh(dataset, style="wireframe", color="blue", label="Input")
pl.add_mesh(clipped, label="Clipped")
pl.add_legend()
pl.show()
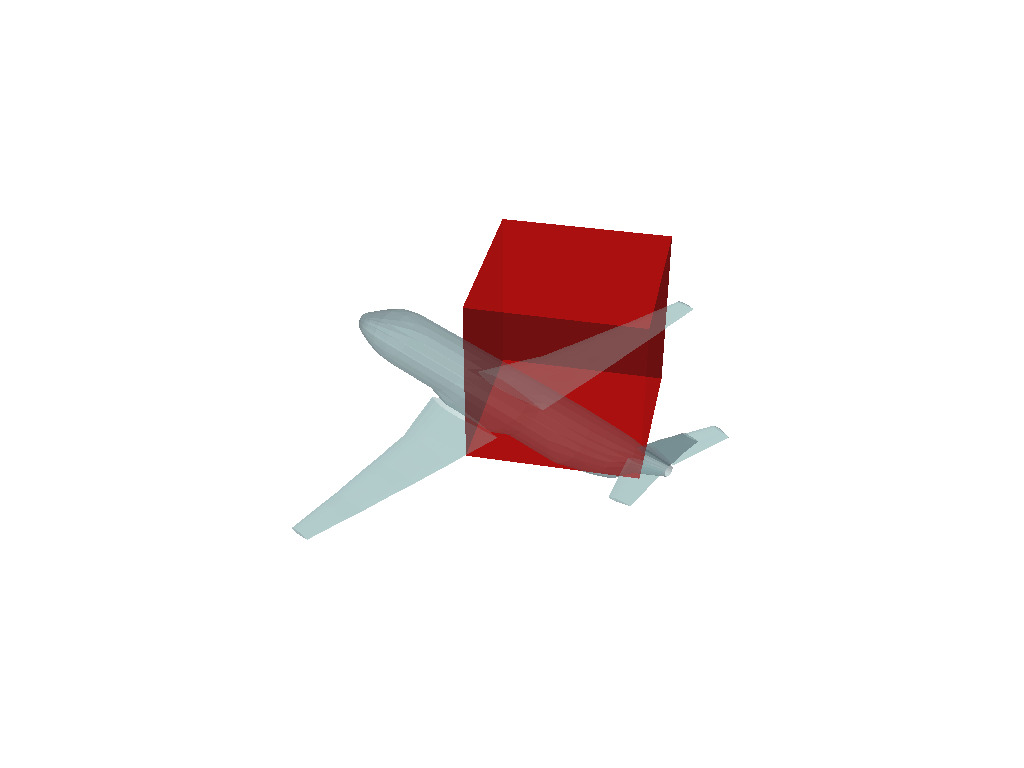
Clip with Rotated Box#
Clip any dataset by an arbitrarily rotated solid box using the
pyvista.DataSetFilters.clip_box() filter.
mesh = examples.load_airplane()

# Use `pv.Box()` or `pv.Cube()` to create a region of interest
roi = pv.Cube(center=(0.9e3, 0.2e3, mesh.center[2]), x_length=500, y_length=500, z_length=500)
roi.rotate_z(33, inplace=True)

pl = pv.Plotter()
pl.add_mesh(roi, opacity=0.75, color="red")
pl.add_mesh(mesh, opacity=0.5)
pl.show()
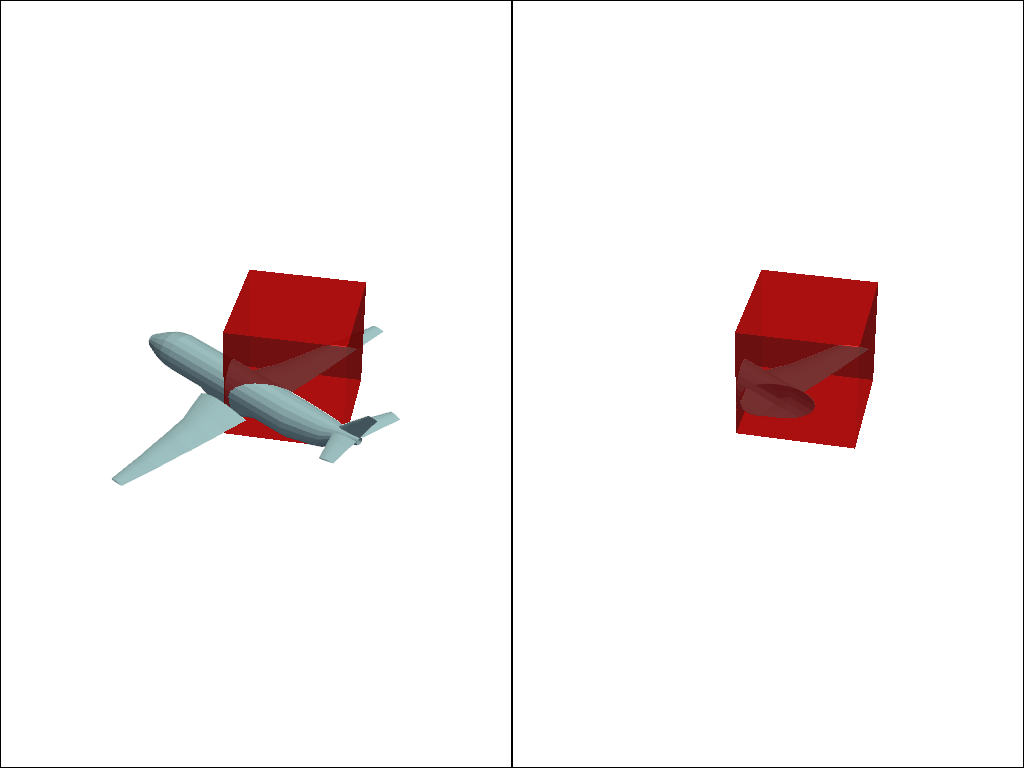
Run the box clipping algorithm with the defined box geometry.
extracted = mesh.clip_box(roi, invert=False)

pl = pv.Plotter(shape=(1, 2))
pl.add_mesh(roi, opacity=0.75, color="red")
pl.add_mesh(mesh)
pl.subplot(0, 1)
pl.add_mesh(extracted)
pl.add_mesh(roi, opacity=0.75, color="red")
pl.link_views()
pl.view_isometric()
pl.show()
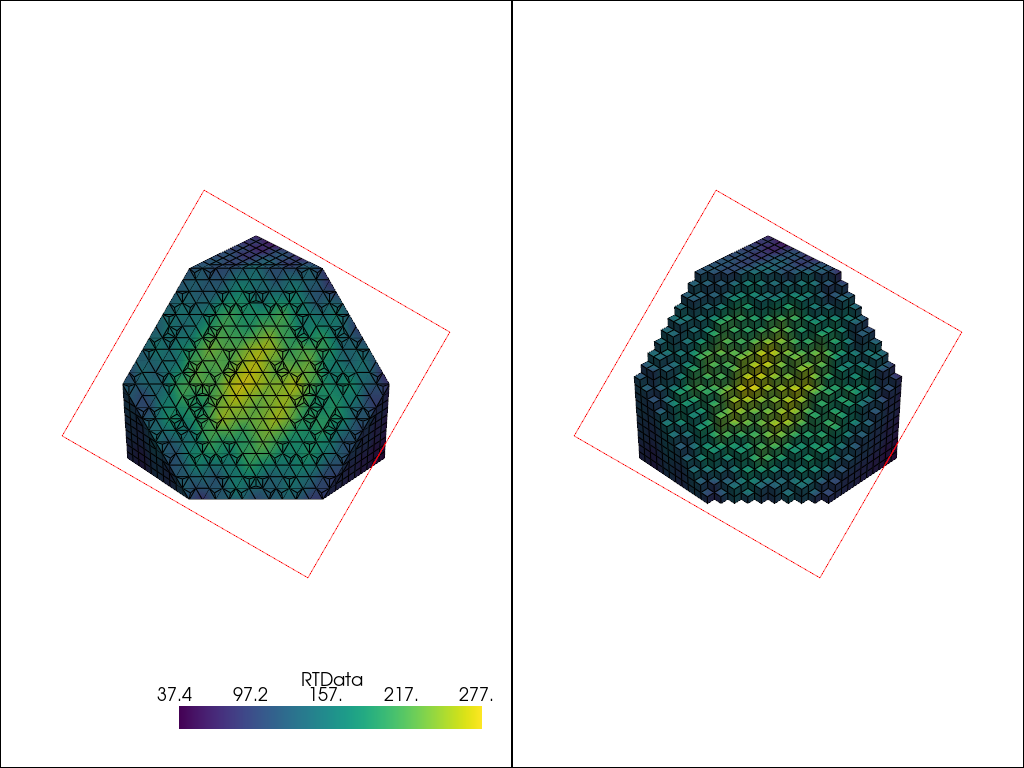
Crinkled Clipping#
Crinkled clipping is useful if you don’t want the clip filter to truly clip cells on the boundary, but want to preserve the input cell structure and to pass the entire cell on through the boundary.
This option is available for pyvista.DataSetFilters.clip(),
pyvista.DataSetFilters.clip_box(), and
pyvista.DataSetFilters.clip_surface(), but not available when clipping
by scalar in pyvista.DataSetFilters.clip_scalar().
# Input mesh
mesh = pv.Wavelet()
Define clipping plane
Perform a standard clip
Perform a crinkled clip to compare
Plot comparison
pl = pv.Plotter(shape=(1, 2))
pl.add_mesh(clipped, show_edges=True)
pl.add_mesh(plane.extract_feature_edges(), color="r")
pl.subplot(0, 1)
pl.add_mesh(crinkled, show_edges=True)
pl.add_mesh(plane.extract_feature_edges(), color="r")
pl.link_views()
pl.show()
Total running time of the script: (0 minutes 1.776 seconds)