Note
Go to the end to download the full example code. or to run this example in your browser via Binder
Plotting Glyphs (Vectors or PolyData)#
Use vectors in a dataset to plot and orient glyphs/geometric objects.
import numpy as np
import pyvista as pv
from pyvista import examples
Example dataset with normals
mesh = examples.load_random_hills()
Glyphying can be done via the pyvista.DataSetFilters.glyph() filter
help(mesh.glyph)
Help on method glyph in module pyvista.core.filters.data_set:

glyph(orient: 'bool | str' = True, scale: 'bool | str' = True, factor: 'float' = 1.0, geom: '_vtk.vtkDataSet | DataSet | Sequence[_vtk.vtkDataSet | DataSet] | None' = None, indices: 'VectorLike[int] | None' = None, tolerance: 'float | None' = None, absolute: 'bool' = False, clamping: 'bool' = False, rng: 'VectorLike[float] | None' = None, color_mode: "Literal['scale', 'scalar', 'vector']" = 'scale', progress_bar: 'bool' = False) method of pyvista.core.pointset.PolyData instance
    Copy a geometric representation (called a glyph) to the input dataset.

    The glyph may be oriented along the input vectors, and it may
    be scaled according to scalar data or vector
    magnitude. Passing a table of glyphs to choose from based on
    scalars or vector magnitudes is also supported.  The arrays
    used for ``orient`` and ``scale`` must be either both point data
    or both cell data.

    Parameters
    ----------
    orient : bool | str, default: True
        If ``True``, use the active vectors array to orient the glyphs.
        If string, the vector array to use to orient the glyphs.
        If ``False``, the glyphs will not be orientated.

    scale : bool | str | sequence[float], default: True
        If ``True``, use the active scalars to scale the glyphs.
        If string, the scalar array to use to scale the glyphs.
        If ``False``, the glyphs will not be scaled.

    factor : float, default: 1.0
        Scale factor applied to scaling array.

    geom : :vtk:`vtkDataSet` | tuple[:vtk:`vtkDataSet`], optional
        The geometry to use for the glyph. If missing, an arrow glyph
        is used. If a sequence, the datasets inside define a table of
        geometries to choose from based on scalars or vectors. In this
        case a sequence of numbers of the same length must be passed as
        ``indices``. The values of the range (see ``rng``) affect lookup
        in the table.

        .. note::

            The reference direction is relative to ``(1, 0, 0)`` on the
            provided geometry. That is, the provided geometry will be rotated
            from ``(1, 0, 0)`` to the direction of the ``orient`` vector at
            each point.

    indices : sequence[float], optional
        Specifies the index of each glyph in the table for lookup in case
        ``geom`` is a sequence. If given, must be the same length as
        ``geom``. If missing, a default value of ``range(len(geom))`` is
        used. Indices are interpreted in terms of the scalar range
        (see ``rng``). Ignored if ``geom`` has length 1.

    tolerance : float, optional
        Specify tolerance in terms of fraction of bounding box length.
        Float value is between 0 and 1. Default is None. If ``absolute``
        is ``True`` then the tolerance can be an absolute distance.
        If ``None``, points merging as a preprocessing step is disabled.

    absolute : bool, default: False
        Control if ``tolerance`` is an absolute distance or a fraction.

    clamping : bool, default: False
        Turn on/off clamping of "scalar" values to range.

    rng : sequence[float], optional
        Set the range of values to be considered by the filter
        when scalars values are provided.

    color_mode : str, optional, default: ``'scale'``
        If ``'scale'`` , color the glyphs by scale.
        If ``'scalar'`` , color the glyphs by scalar.
        If ``'vector'`` , color the glyphs by vector.

        .. versionadded:: 0.44

    progress_bar : bool, default: False
        Display a progress bar to indicate progress.

    Returns
    -------
    pyvista.PolyData
        Glyphs at either the cell centers or points.

    Examples
    --------
    Create arrow glyphs oriented by vectors and scaled by scalars.
    Factor parameter is used to reduce the size of the arrows.

    >>> import pyvista as pv
    >>> from pyvista import examples
    >>> mesh = examples.load_random_hills()
    >>> arrows = mesh.glyph(scale='Normals', orient='Normals', tolerance=0.05)
    >>> pl = pv.Plotter()
    >>> actor = pl.add_mesh(arrows, color='black')
    >>> actor = pl.add_mesh(
    ...     mesh,
    ...     scalars='Elevation',
    ...     cmap='terrain',
    ...     show_scalar_bar=False,
    ... )
    >>> pl.show()

    See :ref:`glyph_example`, :ref:`movie_glyphs_example`, and
    :ref:`glyph_table_example` for more examples using this filter.
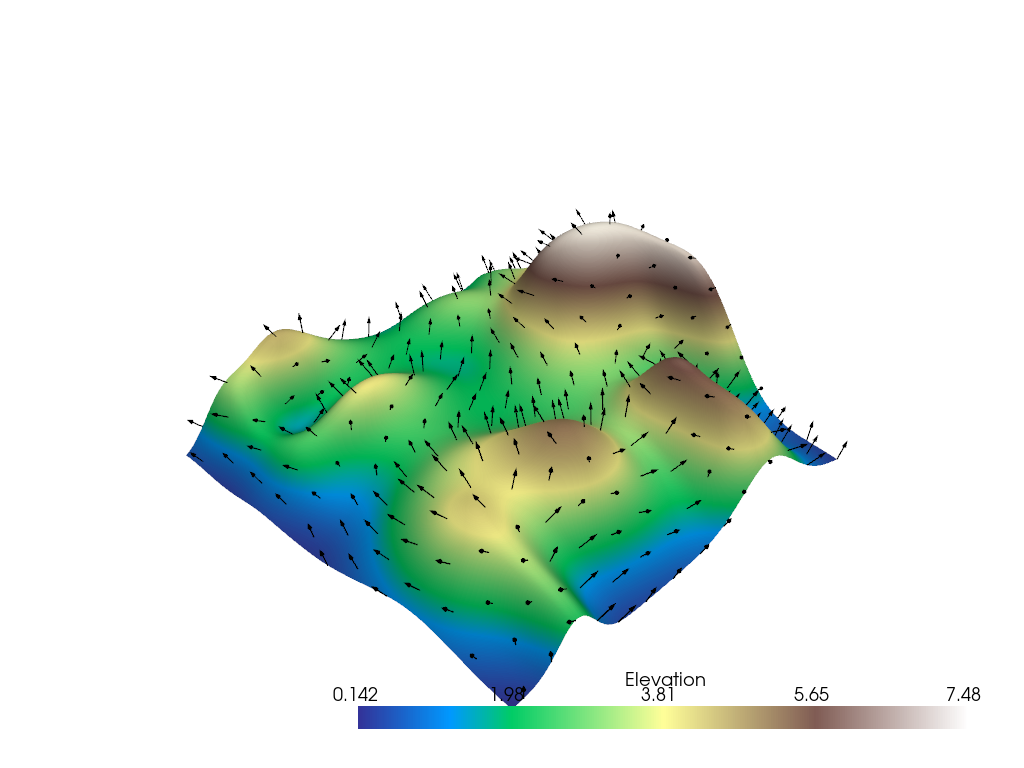
Sometimes you might not want glyphs for every node in the input dataset. In this case, you can choose to build glyphs for a subset of the input dataset by using a merging tolerance. Here we specify a merging tolerance of five percent which equates to five percent of the bounding box’s length.
create a subset of arrows using the glyph filter
arrows = mesh.glyph(scale="Normals", orient="Normals", tolerance=0.05)
pl = pv.Plotter()
pl.add_mesh(arrows, color="black")
pl.add_mesh(mesh, scalars="Elevation", cmap="terrain", smooth_shading=True)
pl.show()
A common approach is to load vectors directly to the mesh object and then
access the pyvista.DataSet.arrows property to produce glyphs.
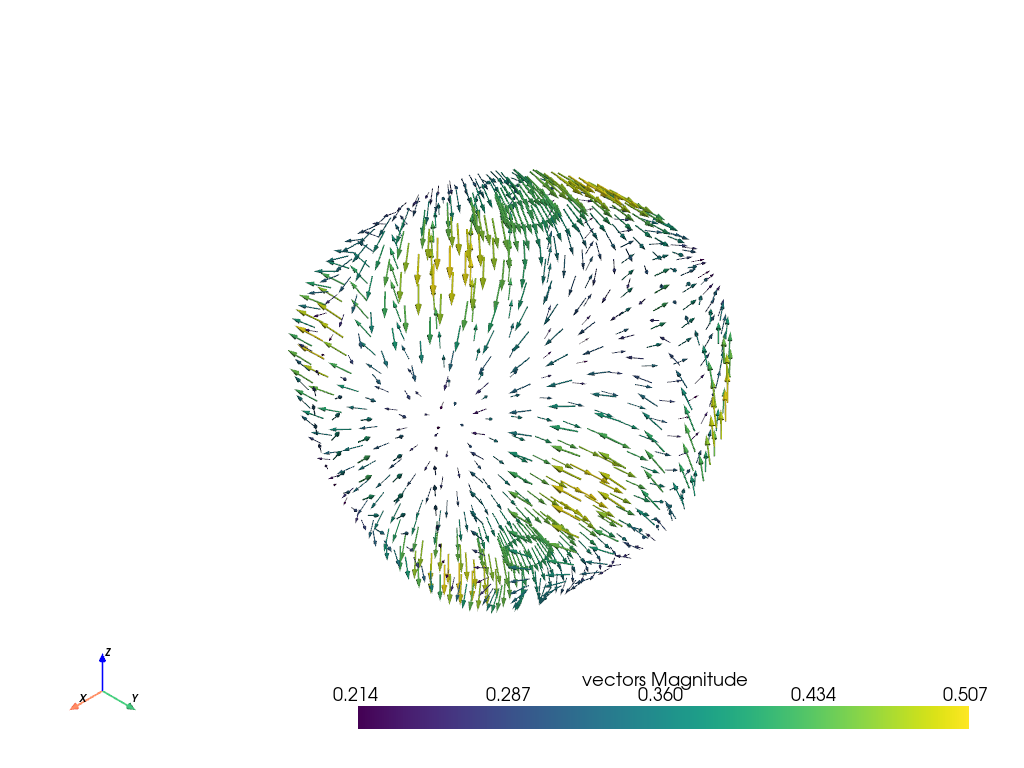
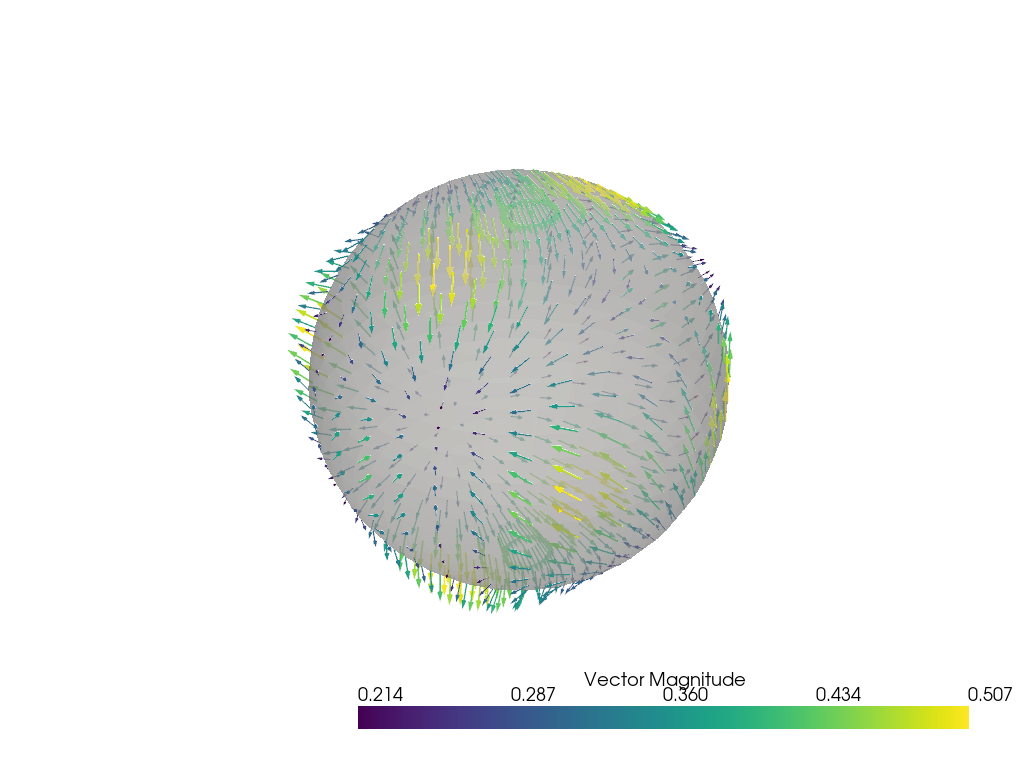
sphere = pv.Sphere(radius=3.14)

# make cool swirly pattern
vectors = np.vstack(
    (
        np.sin(sphere.points[:, 0]),
        np.cos(sphere.points[:, 1]),
        np.cos(sphere.points[:, 2]),
    )
).T
vectors
array([[ 0.        ,  1.        , -0.99999875],
       [ 0.        ,  1.        , -0.99999875],
       [ 0.33300975,  1.        , -0.9998    ],
       ...,
       [ 0.83088565,  0.97835207, -0.98625994],
       [ 0.61331964,  0.9901682 , -0.9971885 ],
       [ 0.32600534,  0.99750996, -0.9998    ]],
      shape=(842, 3), dtype=float32)
# add and scale
sphere["vectors"] = vectors * 0.3
sphere.set_active_vectors("vectors")

# plot just the arrows
sphere.arrows.plot()
Plot the arrows and the sphere.
pl = pv.Plotter()
pl.add_mesh(sphere.arrows, lighting=False, scalar_bar_args={"title": "Vector Magnitude"})
pl.add_mesh(sphere, color="grey", ambient=0.6, opacity=0.5, show_edges=False)
pl.show()
Total running time of the script: (0 minutes 0.995 seconds)